Results for the year ended 30 June 2017 - 21 August 2017 - Goodman Group
←
→
Page content transcription
If your browser does not render page correctly, please read the page content below
Results for the year ended 30 June 2017
21 August 2017
+   This document has been prepared by Goodman Group (Goodman Limited (ABN 69 000 123 071), Goodman Funds Management Limited (ABN 48
    067 796 641; AFSL Number 223621) as the Responsible Entity for Goodman Industrial Trust (ARSN 091 213 839) and Goodman Logistics (HK)
    Limited (Company Number 1700359; ARBN 155911142 – A Hong Kong company with limited liability)). This document is a presentation of general
    background information about the Group’s activities current at the date of the presentation. It is information in a summary form and does not purport
    to be complete. It is to be read in conjunction with the Goodman Group Financial Report for the year ended 30 June 2017 and Goodman Group’s
    other announcements released to ASX (available at www.asx.com.au). It is not intended to be relied upon as advice to investors or potential
    investors and does not take into account the investment objectives, financial situation or needs of any particular investor. These should be
    considered, with professional advice, when deciding if an investment is appropriate.

+   This Presentation uses operating profit and operating EPS to present a clear view of the underlying profit from operations. Operating profit
    comprises profit attributable to Securityholders adjusted for profit on disposal of investment properties, net property valuations gains, non-property
    impairment losses, net gains/losses from the fair value movements on derivative financial instruments and unrealised fair value and foreign
    exchange movements on interest bearing liabilities and other non-cash adjustments or non-recurring items e.g. the share based payments expense
    associated with Goodman’s Long Term Incentive Plan (LTIP). A reconciliation to statutory profit is provided in summary on page 10 of this
    Presentation and in detail on page 7 of the Directors’ Report as announced on ASX and available from the Investor Centre at www.goodman.com.

+   The calculation of fair value requires estimates and assumptions which are continually evaluated and are based on historical experience and
    expectations of future events that are believed to be reasonable in the circumstances

+   This document contains certain "forward-looking statements". The words "anticipate", "believe", "expect", "project", "forecast", "estimate", "likely",
    "intend", "should", "could", "may", "target", "plan" and other similar expressions are intended to identify forward-looking statements. Indications of,
    and guidance on, future earnings and financial position and performance are also forward-looking statements. Due care and attention has been
    used in the preparation of forecast information. Such forward-looking statements are not guarantees of future performance and involve known and
    unknown risks, uncertainties and other factors, many of which are beyond the control of the Group, that may cause actual results to differ materially
    from those expressed or implied in such statements. There can be no assurance that actual outcomes will not differ materially from these
    statements. Neither the Group, nor any other person, gives any representation, warranty, assurance or guarantee that the occurrence of the events
    expressed or implied in any forward looking-statements in this document will actually occur.

+   This document does not constitute an offer, invitation, solicitation, recommendation, advice or recommendation with respect to the issue, purchase,
    or sale of any stapled securities or other financial products in the Group.

+   This document does not constitute an offer to sell, or the solicitation of an offer to buy, any securities in the United States or to any “US person” (as
    defined in Regulation S under the US Securities Act of 1933, as amended (Securities Act) (US Person)). Securities may not be offered or sold in the
    United States or to US Persons absent registration or an exemption from registration. The stapled securities of Goodman Group have not been, and
    will not be, registered under the Securities Act or the securities laws of any state or jurisdiction of the United States.

                                                                                                                                                           2
Section 4 – outlook
Image of Amazon warehouse

               Section1+1+
              Section
              Highlights
                Highlights

                                Goodman Interlink, Hong Kong
                             Erfurt, Zalando, Germany
+        Delivering consistent and sustainable growth
         –     Operating profit¹ of $776.0 million, up 8.6% on FY16
         –     Operating EPS¹ of 43.1 cents², up 7.5% on FY16
         –     Distribution per security of 25.9 cents, up 8% on FY16
         –     FY2018 forecast operating EPS of 45.7 cents, up 6% on FY17
         –     Statutory accounting profit of $778.1 million, NTA up 3% to $4.21 per security

+        Strong operating performance across the divisions
         –    Development WIP at $3.5 billion, margins remain strong
         –    Occupancy increased to 97% across the portfolio
         –    $1.6 billion in valuation uplift across the Group and Partnerships with cap rates tightening by ~50bps to 5.9%
         –    Total AUM increased to $34.6 billion notwithstanding $3.5 billion in asset sales across the Group and Partnerships

+        $1.2 billion of urban renewal sales settled during the year, ahead of expectations
         –    $2.1 billion of urban renewal sales have completed since 2014, providing capital for development activities and debt reduction

         –    Significant ongoing activity with respect to planning and delivery of additional urban renewal sites across the platform

         –    Currently the Group controls sites capable of delivering 35,000 apartments

    1.       Operating profit and operating EPS comprises profit attributable to Securityholders adjusted for property, derivative and foreign currency mark to market and other non-cash or non-recurring items
    2.       Calculated based on weighted average diluted securities of 1,798.4 million which includes 11.1 million LTIP securities which have achieved the required performance hurdles and will vest in September
             2017 and September 2018
                                                                                                                                                                                                                      5
+        Capital management initiatives providing operational flexibility and the ability to fund financial obligations and
         long term growth
         –     Financial Risk Management policy changes in line with current operating practice, resulting in reduced gearing targets and credit rating
               upgrade to BBB+ Stable (S&P) and Baa1 Stable (Moody’s)
         –     Further deleveraging of the balance sheet with gearing at 5.9%¹
         –     Leverage across Partnerships also declining with look through gearing of 18%²
         –     Increase in liquidity to $3.2 billion to meet near term obligations and provide operational flexibility
         –     Announced the repurchase of $327 million of Goodman PLUS hybrid securities post balance date
         –     £250 million EMTN paying 9.75% coupon expiring July 2018
         –     Completed “par for par” exchange, covenant consent and change of obligor for US$967 million in US144A Bonds

+        The Group has sold over $8 billion of assets over the past three years, concentrating and redeploying capital into
         large, wealthy consumer dominated markets
         –     Net investment income down given volume of sales in FY16 and FY17 but quality of underlying portfolio will deliver stronger results long term
         –     Ongoing demand for prime industrial space across the global portfolio remains strong, resulting in average rental reversions of 2.5%
         –     Consumer demand and e-commerce globally sustaining development volumes with WIP at $3.5 billion, 88% leased upon completion

+        Forecast to deliver FY18 operating profit of $828m and operating EPS of 45.7 cents (up 6% on FY17)
         –     Forecast distribution of 27.5 cents per security (up 6% on FY17) with payout ratio unchanged

    1.       Calculated as total interest bearing liabilities over total assets, both net of cash and fair values of cross currency swaps used to hedge foreign liabilities denominated in currencies other than those to which the
             proceeds are applied equating to $169.8 million (2016: $258.2 million) – refer to Note 13 of the Financial Statements
    2.       Based on $2.2 billion net debt over $12.4 billion net assets of Group and proportionate share of Partnerships

                                                                                                                                                                                                                                      6
+   Occupancy increased to 97% reflecting portfolio quality improvement
          +   Retention rate of 81% and WALE of 4.7 years
          +   Like for like rental growth at 3.0% and positive lease reversions of 2.5% on new leasing deals
 Own      +   Leased 3.1 million sqm across the global platform equating to $373.1 million of property income across the Group and
              Partnerships
          +   Urban renewal projects continue to be progressed with significant activity expected over the next three to five years and
              land bank supporting 35,000 apartments

          +   WIP of $3.5 billion across 77 projects in 12 countries with a forecast yield on cost of 7.8%
          +   Development commencements of $2.8 billion with 65% pre-committed and 68% developed for Partnerships or third
              parties
Develop
          +   Development completions of $2.7 billion with 88% pre-committed and 82% developed for Partnerships or third parties
          +   Development holdings increasing in Partnerships in line with increased activity levels
          +   Customer enquiry remains strong globally with continued level of pre-commitment on commencements

          +   Total assets under management of $34.6 billion, with external assets under management increasing to $30.5 billion, up
              4% on 30 June 2016
          +   Average total return in the Partnerships of 14.4%
          +   Continued focus on asset rotation, disposing $3.5 billion of property assets across the Group and Partnerships to third
Manage        parties
          +   Strength in asset pricing driving a $1.6 billion valuation uplift across the Group and Partnerships resulting in a global
              WACR of 5.9%
          +   Average Partnership gearing declined to 21%, with $11 billion available in undrawn debt, equity and cash. Limited draw
              down in FY17 given asset rotation

                                                                                                                                          7
Section
 Section2+2+
  Results
Results
  Overview
overview

               Stockyards Industrial Estate, Australia
                   M7 Business Hub, Australia
+   Operating profit growth whilst reducing gearing                                                                                                  FY16               FY17
    –   EBIT margin across Management and Development operations have
        increased to 67% (65% in FY16)
                                                                                    Operating profit ($m)                                           714.5               776.0
    –   Overall ROA at 9.1%, over 10% excluding cash
                                                                                    Statutory accounting profit ($m)                              1,274.6               778.1
    –   Dilutionary impact on investment earnings from asset sales offset by
        lower net interest expense                                                  Operating EPS (cents)1                                            40.1                43.1
                                                                                    Distribution per security (cents)                                 24.0                25.9
+   FX translation of EBIT (-2%) offset by hedge benefits
+   Net tangible assets increased 3% to $4.21 per security
                                                                                                                                                 As at                 As at
    –   $398 million of unrealised and realised property valuation gains, offset
                                                                                                                                              30 June               30 June
        by fair value of US bonds ($173m) and other items
                                                                                                                                                 2016                  2017
                                                                                    NTA per security ($)                                           4.10                   4.21
                                                                                    Gearing (balance sheet) (%)2                                   11.8                    5.9

    Operating earnings by                                                           Available liquidity ($b)                                         2.6                   3.2
    geographic segment                                                              WACR (look through) (%)                                          6.4                   5.9

                                                                                   1.    Operating profit and operating EPS comprises profit attributable to Securityholders
                                                                                         adjusted for property and intangible valuations, derivative and foreign currency mark
                                                                                         to market and other non-cash or non-recurring items and calculated based on
                                                                                         weighted average securities of 1,798.4 million which includes 11.1 million LTIP
                                                                                         securities which have achieved the required performance hurdles and will vest in
                                                                                         September 2017 and September 2018
                                                                                   2.    Calculated as total interest bearing liabilities over total assets, both net of cash and
                                                                                         fair values of cross currency swaps used to hedge foreign liabilities denominated in
                                                                                         currencies other than those to which the proceeds are applied equating to $169.8
                                                                                         million (2016: $258.2 million) – refer to Note 13 of the Financial Statements

                                                                                                                                                                                    9
+   Statutory profit of $778 million, includes strong property         Income statement
    valuations offset by fair value movements of derivatives                                                                                          FY16               FY17
    and other non-cash or non-recurring items                                                                                                           $M                 $M
    –   Continued strong revaluations of $1.6 billion across the       Property investment                                                           406.6               396.7
        platform (Group’s share $398 million); less contribution
                                                                       Management                                                                    259.7               266.6
        from urban renewal than FY16; UK weaker due to non
        core assets                                                    Development                                                                   464.1               482.9

    –   Currency and derivative movements, including fair value        Operating expenses                                                           (244.0)            (239.7)
        of US Bonds post successful exchange offer, saw                Operating EBITDA                                                              886.4               906.5
        unrealised loss of $244 million
                                                                       Operating EBIT                                                                878.7               898.0
    –   Other items included usual LTIP treatment and UK
        restructure charge for Business Parks closure                  Net borrowing costs                                                           (88.9)              (54.0)

+   Full year operating profit of $776 million                         Tax expense                                                                   (55.2)              (49.3)

    –   Underlying investment income growth offset by asset            Operating profit (pre minorities)                                             734.6               794.7
        sales. Cornerstone ROA 6% with solid underlying growth         Minorities1                                                                   (20.1)              (18.7)
    –   Management earnings up 3% with net investment and              Operating profit (post minorities)                                            714.5               776.0
        valuations offsetting asset sales and higher performance
        fees                                                           Weighted average securities       (million)2                                1,781.2             1,798.4

    –   Continued growth in development revenue supported by           Operating EPS (cps)                                                             40.1                   43.1
        strong margins and volumes, offset by increase in              Non operating items3
        development within Partnerships
                                                                       Property valuation related movements                                          614.4               397.6
    –   Lower net interest expense resulting from asset sales,
                                                                       Fair value adjustments and unrealised foreign currency                          81.5            (243.8)
        debt reduction and lower rates                                 exchange movements related to capital management
        –    Lower capitalised interest as a result of lower average   Other non-cash adjustments or non-recurring items                            (135.8)            (151.7)
             interest rates and new development increasingly in
                                                                       Statutory profit                                                            1,274.6               778.1
             Partnerships
                                                                       1.    Goodman PLUS Trust hybrid securities
        –    Lower average rates and hedging benefit                   2.    Includes 11.1 million securities which have achieved the required performance hurdles and will
                                                                             vest in September 2017 and September 2018
    –   Overheads down 2% with reduction in staff costs and            3.    Refer Appendix 1 slide 24
        positive FX offset by Brazil consolidation
                                                                                                                                                                               10
Balance sheet
+ Stabilised investment properties decreased as a result of FY16 FY17
urban renewal settlements and asset sales $m $m
Stabilised investment properties 2,553 1,834
+ Partnership cornerstones steady, asset rotation in Partnership cornerstones1 4,950 4,967
Partnerships limiting the need for new equity
Development holdings² 2,239 2,576
Intangibles 781 772
+ Development holdings increasing in Partnerships in line with
increased activity levels Cash 1,337 2,095
– Group average development capital down over two years (net Other assets 528 467
of ABPP reclassification) and expected to decrease into FY18
Total assets 12,388 12,711
+ Total property revaluations across the Group and Interest bearing liabilities (2,865) (2,878)
Partnerships of $1.6 billion
Other liabilities (1,129) (1,211)
Total liabilities (3,994) (4,089)
Minorities (326) (326)
Net assets (post minorities) 8,068 8,296
Net asset value ($)³ 4.54 4.64
Net tangible assets ($)³ 4.10 4.21
Balance sheet gearing (%)4 11.8 5.9
1. Includes Goodman’s investments in its Partnerships and other investments
2. Includes inventories, investment properties under development and investments in
Partnerships which have a principle focus on development
3. Based on 1,789.1 million securities on issue
4. Gearing calculated as total interest bearing liabilities over total assets, both net of cash and fair
values of cross currency swaps used to hedge foreign liabilities denominated in currencies
other than those to which the proceeds are applied equating to $169.8 million (2016: $258.2
million) - refer to Note 13 of the Financial Statements
11+ Gearing reduced to 5.9%¹ (18.0%² look through) and Goodman Group debt maturity profile
expected to remain low at this point of the cycle
+ Significant liquidity and balance sheet capacity maintained
given current development volume and future obligations
– Liquidity increased to $3.2 billion
– Maturities covered to June 2022
+ Cash and available lines of credit of $3,163 million as at 30
June 2017
– $2,095 million in cash
– $1,068 million of available lines
+ Average debt maturity profile of 3.7 years
+ ICR at 9.5 times (7.1 times look through)
+ Successful completion of exchange offer for US$1 billion of
US144A / Reg S bonds, with over 96% acceptance reached
to amend certain financial covenants
+ The Group has reduced its gearing target under its
Financial Risk Management Policy from 25-35% to 0-25%,
in line with its current operating practice
- LTV covenant reduced and URPAT test removed on Bank
debt and exchange offer US Bonds
+ Credit Rating upgrade from S&P and Moody’s BBB+ / Baa1
respectively and Stable outlook
1. Gearing calculated as total interest bearing liabilities over total assets, both net of cash and fair values of cross currency swaps used to hedge foreign liabilities denominated in currencies other than
those to which the proceeds are applied equating to $169.8 million (2016: $258.2 million) - refer to Note 13 of the Financial Statements 12
2. Based on $2.2 billion net debt on $12.4 billion net assets of Group and proportionate share of PartnershipsSection 3+
Operational
Performance
Interlink, Berlin
Goodman Fiege Brieseleang, Hong Kong
Osaka Nanko, Japan+ Property fundamentals improving reflecting a high quality portfolio Property investment ($m) FY16 FY17
as a result of repositioning and strength of customers
Direct 141.5 130.5
– High occupancy at 97%
Cornerstones 265.1 266.2
– Retention remains high at 81% and WALE of 4.7 years
Property investment earnings 406.6 396.7
– Like for like rental growth of 3%
+ Lower overall investment income reflects impact of asset sales Key metrics1 FY16 FY17
program
WACR (%) 6.4 5.9
– Income return on cornerstone investments at 6%
WALE (yrs) 4.7 4.7
– Direct investments yield lower given increasing asset values,
Customer retention (%) 79 81
including higher and better use valuations and loss of income in
providing vacant possession for urban renewal sales Occupancy (%) 96 97
+ Capital allocation to direct and cornerstone investments impacted 1. Key metrics shown in the above table relate to Goodman and managed Partnership
by asset sales properties
– $2.5 billion of assets sales across Partnerships, primarily reinvested
into development pipeline
– Improving quality of the portfolio expected to be reflected in better
growth and real estate returns over the long term
– Temporarily lowering income growth but providing funding for
development activities driving higher total returns
+ $1.2 billion of urban renewal sites settled in FY17
– Current sites under control across the Australian portfolio, capable of
accommodating pipeline of 35,000 apartments in various stages of
planning with value still to be realised
14+ Deliberate strategy over the past five years to de-risk Development ($M) FY16 FY17
development WIP by shifting the majority of works into the
Development income 1,393.2 1,402.8
Partnerships
Development expenses (929.1) (919.9)
– Reduce Group capital allocation to development over time
Development earnings 464.1 482.9
– Lower gross development revenue growth, but more diversified
exposure and lower volatility in earnings
– Return on development capital increasing as a result Key metrics FY16 FY17
+ Development WIP at $3.5 billion Work in progress ($b) 3.4 3.5
– Globally diversified workbook with Americas’ contribution Work in progress (million sqm) 2.5 2.4
increasing. Average project end value of $45 million Number of developments 81 77
– Margins remain strong with good indicative customer enquiry into Development for third parties or Partnerships (%) 74 75
FY18 providing a robust outlook for WIP
Pre-commitment (%) 68 64
+ Partnerships continue to favour a develop to hold strategy
Yield (%) 7.8 7.8
resulting in a higher return on equity for the Group
– Development off balance sheet (within Partnerships) increased to Work in progress (end value) $B
average 75% of WIP in FY17
Opening (June 2016) 3.4
+ Selective development led strategy across key gateway cities Completions (2.7)
reflected in metrics
Commencements 2.8
– 88% leased and 82% pre-sold / de-risked on completion
Closing (June 2017) 3.5
– Investment partnering approach in most markets
– Limiting speculative development to supply constrained markets
which are proven logistics locations
– High levels of liquidity and equity funding provides competitive
advantage in dealing with suppliers and large projects
15+ External assets under management (AUM) of $30.5 billion up Management ($M) FY16 FY17
4% on FY16 net of asset sales of $2.5 billion
Management earnings² 259.7 266.6
+ Continued strong performance of the Partnerships and AUM
growth increasing management earnings
Key metrics FY16 FY17
– Partnership average total return of 14.4% for FY17, supported by
Number of Partnerships 16 16
portfolio improvement and develop to hold strategy
– Strong historic returns within Partnerships supporting External AUM (end of period) ($B) 29.3 30.5
performance fees in FY17 and forecast to continue into FY18
+ Asset sales continue to fund growth, limiting the need to raise
new equity in most regions Third party equity raised within
+ Equity commitments and liquidity available of $11 billion across Partnerships
the Partnership platform providing capital for the Partnerships
to participate in growth opportunities
– $4.6 billion in undrawn debt facilities and cash
– $6.4¹ billion in undrawn equity
+ Terms have been agreed with our Partners for a Brazilian
Partnership with a ~$1 billion equity commitment
1. Partnership investments are subject to Investment Committee approval
2. Includes gross up of property outgoings of $8.3 million (2016: $15.1 million) 16+ Major achievements completed during the year include
Third party AUM by region
– GAIP received ratings upgrade from Standard & Poors, a second rating
from Moody’s and subsequently completed a new US$600 million 10 year
debt issuance
– GHKLP completed restructuring of the unsecured debt platform, with
weighted average debt expiry extending to 5.5 years and net liquidity
increasing to HK$2.9 billion
– GEP completed equity raising with €399 million of uncalled equity now
available
– GAP reduction in gearing from 26% to 7.3% with available liquidity of
~$1 billion
– Completed $2.5 billion of asset sales across the Partnerships while
growing AUM
Third party AUM by type
Third party assets under management
17GAIP GHKLP GEP GAP GCLP GMT1 GJCP5 GNAP GUKP
Total assets $6.8bn $4.7bn $4.5bn $3.6bn $2.9bn $2.3bn $1.9bn $1.3bn $0.3bn9
GMG co-investment 27.5% 20.0% 20.4% 19.9% 20.0% 21.0%2 16.8%2 55.0% 33.3%
GMG co-investment $1.3bn $0.7bn $0.5bn $0.6bn $0.4bn $0.3bn2 $0.2bn2 $0.7bn $0.1bn
Number of properties 95 11 115 36 32 13 11 7 3
Occupancy 98% 98% 97% 99% 97% 98% 100% 97%10 100%
Weighted average
4.8 years 2.8 years 5.0 years 4.6 years 3.5 years 5.8 years 3.4 years 5.5 years10 7.9 years
lease expiry3
WACR 6.2% 5.2% 6.0% 6.2% 6.3% 6.5% 4.7 % 4.3% 5.3%
Gearing4 25.6% 10.0% 33.1% 7.3% 8.8% 30.6%6 35.0% - -
Weighted average
debt expiry 5.8 years 5.5 years 5.9 years 3.5 years 2.4 years 4.7 years2 6.1 years n/a n/a
Total shareholder
return8 11.6% 14.5% 10.9% 18.2% 12.9% 13.8%7 12.9% n/a 7.9%
1. As at 31 March 2017 (as disclosed to the New Zealand stock exchange in May 2017) 6. On a proportionately consolidated basis including the trusts interest in the Viaduct Joint Venture
2. As at 30 June 2017 7. Based on cash distributions and net asset values, rather than reference to the listed share price
3. WALE of leased portfolio to next break as at 30 June 2017 8. Return based on Partnerships latest year end audited financial statements. Based on local currency
4. Gearing calculated as total interest bearing liabilities over total assets, both net of cash. 9. Includes the built out end value of committed developments
5. As at 31 May 2017 10. Includes development properties
18Section 3+
Section 4+
Outlook and
Summary
Pudong International
Airport Logistics Park,
China
Pudong International Airport Logistics Park, China+ Macro structural changes are supporting sustainable business growth in gateway cities
– Focus on consumer dominated markets given growth in consumerism
– The evolution of e-commerce and supply chain transformation is underway but still in early stages
+ Servicing the consumer through the advancement of technology is changing logistics requirements
– Rapidly advancing technological developments are changing the logistics and warehouse distribution environment as our
customers demand for modern, strategically located facilities increases
– These changes are disrupting many industries but are creating strong demand for logistics product in gateway cities and we expect
this transition to continue or accelerate
+ Speed and price to meet consumer expectations are key
– Smartphone market penetration and preference for shopping online has grown significantly and is increasing
– Proximity to the consumer is becoming the critical factor in reducing cost and distribution time from point of “click” to receipt of
goods
– Marginal cost savings provided by cheaper rents in inferior locations is secondary to revenue generation through capturing a larger
customer base through speed and price competitiveness
– This is reinforcing locational choice as imperative to the long term outlook and returns of logistics real estate
20+ Deliberate repositioning of our business and structural changes in the industry are expected to sustain long term
growth
– Continued improvement in portfolio quality following the sale of over $8 billion of real estate in the last three years, underpinning
strong rental growth and positive total return outlook versus sector benchmarks
– Impact of the remaining estimated $2 billion of asset sales and dilution from FY17 sales being absorbed in the business
– Significant financial flexibility through low gearing and $3.2 billion of liquidity, plus access to capital across our Partnerships.
Intention to run low gearing at this point in the property cycle
– Broad diversity of earnings across business divisions, scale and global diversification provide security of income
– $34.6 billion of AUM now significantly concentrated in key gateway markets offering superior demand and growth
characteristics
– Operational costs expected to be flat, and ability to grow AUM significantly utilising the existing platform
– Strong forward order book and development pipeline driven by growing technological change and scarcity of land in our gateway
city locations will see higher value growth over time
– Strong performance and development within Partnerships underpinning ongoing performance fees. Transition to net investment
(following significant sales program) will also support growing management and investment revenues
+ Urban renewal pipeline of 35,000 apartments across the Australian portfolio will provide a source of capital for
future activities
+ Performance across all divisions remains resilient
– Positioned to deliver FY18 forecast operating profit of $828 million and operating EPS of 45.7 cents (up 6.0% on FY17)
– Forecast full year distribution of 27.5 cents per security
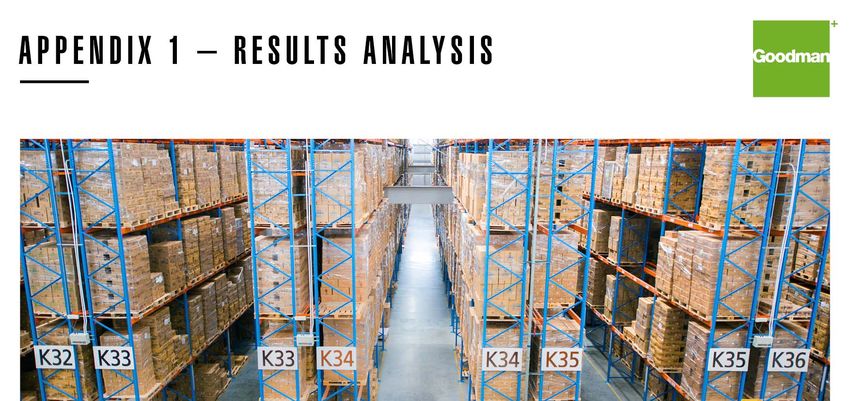
21Appendix 1+
Results analysis
Westney
Pinnacle Industry
Corporate Park,
Park, New Zealand
Australia
Banfield Distribution Centre, Australia
Kobe, JapanTotal income by business segment for the year ended 30 June 2017
Category Total Property Management Development Operating Non-
investment expenses operating
items
$M $M $M $M $M $M
Gross property income 177.1 177.4 (0.3)
Management income 266.3 266.3
Development income 1,207.1 1,207.1
Net gain from fair value adjustments on investment properties 180.9 180.9
Net gain on disposal of investment properties 128.8 79.8 49.0
Net gain on disposal of controlled entities 0.4 0.4
Share of net results of equity accounted investments¹ 587.7 266.2 0.3 115.6 205.61
Net loss on disposal of equity investments (0.1) (0.1)
Total income 2,548.2 443.6 266.6 1,402.8 435.2
Property and development expenses (966.8) (46.9) (919.9)
Employee, administrative and other expenses (357.8) (248.2)4 (109.6)
Impairment losses (93.0) (93.0)
EBIT² / Segment operating earnings 1,130.6 396.73 266.63 482.93 (248.2) 232.6
1. Includes share of associate and JVE property valuation gains of $265.8 million, share of fair value adjustments of derivative financial instruments in associates and joint ventures of $(50.6) million and
other non-cash, non-recurring items within associates of $(9.6) million
2. Look through EBIT is $995.0 million and reflects $97.0 million adjustment to GMG proportionate share of Partnerships interest and tax (2016: $985.2 million)
3. Segment operating earnings is total income less property and development expenses (excludes employee, administrative and employee expenses) 23
4. Includes gross up of property outgoings of $8.3 million (2016: $15.1 million)Category Total Property Management Development Operating Non-operating
investment expenses items
$M $M $M $M $M $M
EBIT / Segment operating earnings 1,130.6 396.7 266.6 482.9 (248.2) 232.6
Net gain from fair value adjustments on investment properties (180.9) (180.9)
Net gain on disposal of investment properties (49.0) (49.0)
Share of net gain from fair value adjustments on investment
properties, unrealised derivative gains and non-recurring (205.6) (205.6)
items within associates and JVEs
Impairment losses 93.0 93.0
Straight-lining of rental income 0.3 0.3
Share based payments expense 85.4 85.4
Restructure costs 24.2 24.2
Operating EBIT / Segment operating earnings 898.0 396.7 266.6 482.9 (248.2) -
Net finance expense (statutory) (279.4)
Add: fair value adjustments on derivative financial instruments 45.6
Add: fair value adjustments on debt modification 173.1
Add: debt modification costs 32.2
Less: foreign exchange gains (25.5)
Net finance expense (operating) (54.0)
Income tax expense (statutory) (54.4)
Add: deferred tax expense on fair value adjustments on investments 5.1
Income tax expense (operating) (49.3)
Minorities (18.7)
Operating profit available for distribution 776.0
Net cash provided by operating activities¹ 586.4
1. Difference between operating profit pre-minorities and cash provided by operating activities of $(208.3) million relates to:
- $(194.6) million development activities including capitalised and prepaid interest
- $71.4 million cash share of equity accounted income
- $(5.3) million of other working capital movements 24
- ($79.8) million of development cash flows recognised in investment activitiesNon-operating items in statutory income statement Year ended
30 June 2017
$M $M
Property valuation related movements
Profit on disposal of investment properties 49.0
Net gain from fair value adjustments attributable to investment properties 180.9
Share of net gain from fair value adjustments attributable to investment properties in associates and joint ventures after tax 265.8
Impairment loss (93.0)
Profit on disposal of investment properties (5.1)
Subtotal 397.6
Fair value adjustments and unrealised foreign currency exchange movements related to capital management
Fair value adjustments on derivative financial instruments – GMG (45.6)
Fair value adjustments on debt modification (173.1)
Share of fair value adjustments on derivative financial instruments in associates and joint ventures (50.6)
Unrealised foreign exchange gain 25.5
Subtotal (243.8)
Other non-cash adjustments or non-recurring items
Straight-lining rental income (0.3)
Restructure costs (24.2)
Share based payments expense (85.4)
Debt modification costs (32.2)
Net capital losses not distributed and deferred tax adjustments (9.6)
Subtotal (151.7)
TOTAL 2.1
25As at 30 June 2017 Direct Property Developments Other Total
Assets investments $M $M $M
$M $M Capital allocation
Cash - - - 2,095.1 2,095.1
Receivables - - 398.5 188.3 586.8
Inventories - - 1,235.5 - 1,235.5
Investment properties 1,833.8 - 176.4 - 2,010.2
Investments accounted for using equity method - 4,966.8 555.9 - 5,522.7
Intangibles - - - 771.9 771.9
Other assets - 0.6 209.2 279.2 489.0
Total assets 1,833.8 4,967.4 2,575.5 3,334.5 12,711.2
Interest bearing liabilities - - - (2,878.3) (2,878.3)
Other liabilities - - - (1,210.7) (1,210.7)
Total liabilities (4,089.0) (4,089.0)
Net assets/(liabilities) 8,622.2
Gearing1 % 5.9
NTA (per security)2 $ 4.21
Australia / New Zealand 1,804.8 2,467.8 450.8 103.6 4,827.0
Asia - 1,403.1 211.1 245.0 1,859.2
CE - 615.6 546.2 660.2 1,822.0
UK 29.0 10.2 826.7 176.2 1,042.1
Americas - 470.7 540.7 36.5 1,047.9
Other - - - 2,113.0 2,113.0
Total assets 1,833.8 4,967.4 2,575.5 3,334.5 12,711.2
1. Calculated as total interest bearing liabilities over total assets, both net of cash and fair values of cross currency swaps used to hedge foreign liabilities denominated in
currencies other than those to which the proceeds are applied equating to $169.8 million (2016: $258.2 million) – refer to Note 13 of the Financial Statements 26
2. Calculated based on 1,789.1 million securities on issue+ Operating margins have steadily increased + ROA has increased
– Focused strategy – Positive performance from investment property on a like for
like basis
– Income growth has exceeded expense growth in the active
business – More assets and developments are in Partnerships
– Management and Development earnings contribute a combined – Higher margins in active business
56% of EBIT in FY17 (54% in FY16)
– Elevated cash balances mask underlying growth - will
correct over time, >10% if cash is excluded
Management and FY13 FY14 FY15 FY16 FY17
Developments
Total return on operating assets1
Management and
389 482 544 724 750
Development income ($M)
Operating expenses ($M) (163) (207) (221) (252) (248)
EBIT ($M) 226 276 323 472 501
Management and
58% 57% 59% 65% 67%
development margin (%)
Operating EBIT
1. Operating assets = Total Assets – Intangibles – Historical Property Valuations and Impairments
27+ For year ended 30 June 2017¹
1. Calculated on 1,789.1 million securities being closing securities on issue 28+ Movement primarily driven by cap rate compression and rental growth across the regions given the continued strong investor
interest in the sector.
+ Repositioning of portfolio has also partly driven cap rate compression along with the stabilisation of development projects
+ Over the past 12 months the global average weighted cap rate reduced from 6.4% to 5.9%. Revaluation gains across the entire
portfolio totalled $1.6 billion
30 June 2017 property valuations (look through)
Valuation
Book value movement since WACR WACR movement since
(GMG exposure) June 2016 June 2016
$M $M % %
Australia / New Zealand 5,481.7 423.8 6.2¹ (0.5)
Asia 1,962.4 42.4 5.4 (0.1)
UK / Continental Europe 2,229.7 (101.8) 6.2 (0.2)
Americas 1,006.7 33.2 4.3 (0.2)
Total / Average 10,680.5 397.6 5.9 (0.5)
1. Australia excludes urban renewal sites which are valued on a rate per residential unit site basis
29Appendix 2+
Investment
Goodman Interlink, Hong KongAcross the Group and Partnerships:
+ 3.1 million sqm leased during the year
+ Reversions of 2.5% on leasing transactions, with rent growing at 3.0%
+ High occupancy at 97%
Region Leasing area (sqm) Net annual rent ($M) Average lease term (years)
Australia / New Zealand 1,410,517 188.4 5.0
Asia 886,378 121.5 3.7
UK / Continental Europe 823,470 63.2 4.0
Total 3,120,365 373.1 4.4
1. Leasing for stabilised properties only
31Top 20 global customers (by net income or a look through basis)
32Top 20 sub-regions (by AUM)
33Portfolio snapshot Key metrics²
+ 23 properties with a total value of $1.8 billion located Total assets A$1.8 billion
primarily in the Sydney market Customers 261
Number of properties 23
– Represents a significant part of the urban renewal
portfolio Occupancy 93%
Weighted average cap rate 6.1%¹
+ Leasing transactions remain strong across the portfolio
– 215,378 sqm ($27 million net annual rental) of 1. Excludes urban renewal sites as valued on a rate per residential unit site basis and
development land
existing space leased 2. Stabilised properties
– customer retention of 65%
+ 93% occupancy and a weighted average lease expiry of
5.3 years
+ Average portfolio valuation cap rate of 6.1%¹
WALE of 5.3 years (by net income) Top 10 customers make up 25.9% of portfolio income
34Rheinberg Logistics Centre , Germany
Appendix 3+
Development
Bungarribee Industrial Estate, AustraliaFY17 Developments Completions Commencements Work in progress
Value ($bn) 2.7 2.8 3.5
Area (m sqm) 2.2 2.1 2.4
Yield (%) 8.0 7.7 7.8
Pre-committed (%) 88 65 64
Weighted average lease term (years) 8.8 9.4 10.6
Development for third parties or Partnerships (%) 82 68 75
Australia / New Zealand (%) 30 22 23
Asia (%) 28 25 27
Americas (%) 7 7 18
UK / Continental Europe (%) 35 46 32
Work in progress On balance sheet Third party funds Total end value Third party funds Pre committed
by region end value end value % of total % of total
$M $M $M
Australia / New Zealand 68 724 792 91 77
Asia 115 814 929 88 22
Americas - 623 623 100 68
UK / Continental Europe 693 439 1,132 39 88
Total 876 2,600 3,476 75 64
36Development volume
+ Maintained development pipeline of $10 billion
– Forecast GLA of 6.1 million sqm
– Development pipeline allocated as Asia Pacific 56%, Europe
30% and Americas 14%
+ The Group’s development future cash commitments
Commitments as at 30 June 2017 $M
Gross GMG cost to complete 649
Less pre-sold¹ cost to complete (203)
Net GMG cost to complete 446
GMG share of Partnerships cost to 961
complete
1. Pre-sold projects are reimbursed by instalments throughout the project or at practical completion
of the project
Work in progress as at 30 June
2017
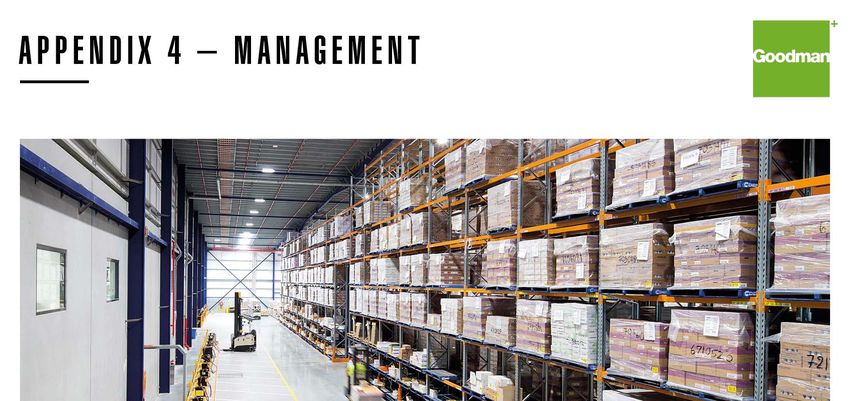
37Appendix 4+
Management
Senec Logistics Centre,
BirminghamBusiness Slovakia
Park, U.K
Interlink Industrial Estate, Australia39
Key events                                                                                                  Key metrics¹
+ Execution of asset rotation strategy with committed investment
                                                                                                              Total assets                                                          $6.8bn
  property disposals totaling $765 million during the year
                                                                                                              Interest bearing liabilities                                          $2.1bn
+ Completed 121,736 sqm of developments with an end value of                                                  Gearing²                                                              25.6%
  $309 million                                                                                                Customers                                                                593
                                                                                                              Number of properties                                                      95
+ Development work in progress at 30 June 2017 of 163,744
  sqm with an estimated end value of $353 million                                                             Occupancy                                                               98%
                                                                                                              Weighted average lease expiry                                       4.8 years
+ $366 million of upward revaluations during the year
                                                                                                              Weighted average cap rate                                               6.2%
+ Ratings upgrade from BBB to BBB+ (Standard & Poors) and                                                     GMG co-investment                                                     27.5%
  second rating of Baa1 (Moody’s) achieved                                                                    GMG co-investment                                                     $1.3bn

+ New US$600 million 10 year debt issuance during the year
                                                                                                             Debt maturity profile
+ Delivered a total return of 11.6% for FY17

 1.   As at 30 June 2017
 2.   Gearing calculated as total interest bearing liabilities over total assets, both net of cash and the net receivable balance of the fair value of the cross currency swaps           40
Key events Key metrics¹
+ Leased 584,000 sqm, representing HK$485 million of Total assets $4.7 billion
annualised rental income. Average uplift of 26%
Interest bearing liabilities $0.7 billion
+ 98% occupancy with a weighted average lease expiry of 2.8 Gearing2 10.0%
years Customers 199
Number of properties 11
+ Revaluation uplift of HK$1.9 billion over the period driven by
strong market rental growth and a tightening in the market Occupancy 98%
capitalisation rate Weighted average lease expiry 2.8 years
Weighted average cap rate 5.2%
+ Completed restructuring of the unsecured debt platform,
GMG co-investment 20.0%
with weighted average debt expiry extending to 5.5 years
and net liquidity increasing to HK$2.9 billion GMG co-investment $0.7 billion
+ Delivered a total return of 14.5% for the Partnership’s
financial year ended 31 March 2017 Debt maturity profile
1. As at 30 June 2017
2. Gearing calculated as total interest bearing liabilities over total assets, both net of cash
41Key events Key metrics¹
+ Secured over 809,900 sqm of new and renewed leases Total assets $4.5 billion
(excluding developments), representing €35 million of annual Interest bearing liabilities $1.6 billion
rental income
Gearing ² 33.1%
+ €323 million of new committed acquisitions (459,000 sqm Customers 150
GLA) Number of properties 115
Occupancy 97%
+ Committed €98 million of new developments (including land
Weighted average lease expiry 3
banks) 5.0 years
Weighted average cap rate 6.0%
+ Secured portfolio sales of €106 million consistent with the GMG co-investment 20.4%
Groups asset rotation program
GMG co-investment $0.5 billion
+ Revaluation uplift of €100 million in FY17 on the
Partnerships’ investment properties (including joint ventures
Debt maturity profile
and developments)
+ As at 30 June 2017 the Partnership has €399 million of
uncalled equity available post closing of a €284 million raise
in FY17
+ Delivered a total return of 10.9% for the 12 months ended
December 2016
1. As at 30 June 2017
2. Gearing calculated as total interest bearing liabilities over total assets, both net of cash and
not including uncalled equity
3. WALE of leased portfolio to next break 42Key events Key metrics¹
+ Execution of asset rotation strategy generating $931 million of Total assets $3.6 billion
proceeds from the sale of investment properties during FY17
Interest bearing liabilities $0.3 billion
+ Completed 28,439 sqm of developments with total project Gearing² 7.3%
costs of $60 million Customers 250
Number of properties 36
+ Work in progress of 31,912 sqm as at 30 June 2017 with
forecast total project cost of $27 million Occupancy 99%
Weighted average lease expiry 4.6 years
+ $259 million of upward revaluations across Australian and
Weighted average cap rate 6.2%
European portfolios
GMG co-investment 19.9%
+ Reduction in Partnership gearing from 26% to 7.3% with GMG co-investment $0.6 billion
available liquidity of c. $1 billion at 30 June 2017
+ Delivered a total return of 18.2% for FY17 Debt maturity profile
1. As at 30 June 2017
2. Gearing calculated as total interest bearing liabilities over total assets, both net of cash
43Key events Key metrics¹
+ Secured over 560,000 sqm of new and renewed leases
Total assets $2.9 billion
(excluding developments) in FY17, increasing occupancy to
97% Interest bearing liabilities $0.4 billion
Gearing² 8.8%
+ Completed 10 development projects with an estimated value Customers 86
of US$266M
Number of stabilised properties 32
+ Revaluation uplift of US$115 million in FY17 on the Occupancy 97%
Partnership’s development completion and investment Weighted average lease expiry3 3.5 years
properties
Weighted average cap rate 6.3%
+ In February 2017, the Partnership’s banking facilities were GMG co-investment 20.0%
fully transitioned to unsecured platform GMG co-investment $0.4 billion
+ Delivered a total return of 12.9% for the financial year ended
31 December 2016 Debt maturity profile
1. As at 30 June 2017
2. Gearing calculated as total interest bearing liabilities over total assets (net of cash)
3. WALE of leased portfolio to next break
44Key events Key metrics¹
+ 4.0% increase in operating earnings before tax from Total assets $2.3 billion
NZ$117 million to NZ$122 million
Interest bearing liabilities $0.7 billion
+ An 8.3% increase in net tangible assets to 130.4 cents per Gearing3 30.6%
unit Customers 240
Number of properties 13
+ Commencement of 8 new development projects totalling
NZ$97 million Occupancy 98%
Weighted average lease expiry 5.8 years
+ A successful sales programme with NZ$279 million of
Weighted average cap rate 6.5%
asset disposals
GMG co-investment² 21.0%
+ Strong balance sheet with a look through loan to value GMG co-investment² $0.4 billion
ratio of 30.6%
+ Further completion of treasury initiatives significantly Debt maturity profile2
improving the diversity and tenor of the Trust’s debt
facilities to 4.7 years2
+ Delivered a total return of 13.8% for the 12 months ended
31 March 2017
1. As at 31 March 2017 (as disclosed to the NZX in May 2017)
2. As at 30 June 2017
3. On a proportionated consolidated basis including the Trust’s interest in the Viaduct joint
venture 45Key Events Key metrics1
+ Acquired a new industrial asset from the Goodman Japan Total assets $1.9 billion
Development Partnership in August 2016 further improving Interest bearing liabilities $0.8 billion
the quality of the portfolio
Gearing² 35.0 %
+ Maintained 100% occupancy on portfolio with an average Customers 24
lease expiry of 3.4 years as at May 2017 Number of stabilised properties 11
+ Awarded the Regional Sector Leader for private industrial Occupancy 100%
funds in Asia in the 2016 GRESB survey Weighted average lease expiry 3.4 years
+ Delivered a total return of 12.9% for the 12 months ended Weighted average cap rate 4.7 %
February 2017 GMG co-investment3 16.8%
GMG co-investment 3 $0.2 billion
Debt maturity profile3
1. As at 31 May 2017
2. Gearing calculated as total interest bearing liabilities over total assets, both net of cash
3. As at 30 June 2017 46Key Events Key metrics¹
+ Stabilised and value add portfolio of 4.5m sqft with a current Total assets² $1.3 billion
book value of US$560m Interest bearing liabilities n/a
Gearing n/a
+ Leased 1.0m sqft to Syncreon at Goodman Logistics Centre
Carlisle, Central Pennsylvania Customers 17
Number of stabilised properties 7
+ Expanded partnership with Amazon, pre-leasing an Occupancy2 97%
additional 1.0m sqft at Goodman Commerce Center
Weighted average lease expiry2 5.5 years
Eastvale, California
Weighted average cap rate 4.3%
+ Pre-leased 0.3m sqft of space (Building 3) to an e- GMG co-investment 55.0%
commerce customer at Goodman Logistics Center Santa GMG co-investment $0.7 billion
Fe Springs, California
+ Commenced construction of 0.9m sqft of space (Building 1
and 2) at Goodman Logistics Center Santa Fe Springs,
California
+ Acquisition of a 73 acre site in Fontana, California providing
1.6m sqft of future development opportunity
+ Key customers in the portfolio include Amazon, Walmart,
Georgia Pacific, VW, and Vons/Safeway
1. As at 30 June 2017
2. Includes development properties 47Key Events Key metrics¹
Total assets $0.3 billion
+ New Partnership established alongside CPPIB and APG
brings over £1 billion of investment capacity for high quality Interest bearing liabilities n/a
logistics and industrial development opportunities Gearing² n/a
Customers 3
+ Initial portfolio comprised two developments in proven
Number of stabilised properties 3
logistics locations close to London and Birmingham, for a
combined 590,000 sqft Occupancy 100%
Weighted average lease expiry3 7.9 years
+ Targeting further high quality logistics and industrial Weighted average cap rate 5.3%
property opportunities across the investment spectrum GMG co-investment 33.3%
GMG co-investment $0.1 billion
1. As at 30 June 2017
2. Gearing calculated as total interest bearing liabilities over total assets, both net of cash
3. WALE of leased portfolio to next break as at 30 June 2017
48Appendix 5+
Capital
management
Torun Logistics Centre, PolandCovenants Test Covenant Result Headroom
Net liabilities1 as a percentage of net tangible assets is
Gearing ratio 45.0% 14.4% 30.6%
not more than 45.0%
Interest cover ratio EBITDA to interest expense at least 2.0x 2.0x 9.5x 7.5x
Secured debt as a percentage of total tangible assets is
Priority debt 15.0% 1.6% 13.4%
not more than 15.0%
Unsecured debt as a percentage of unencumbered
Unencumbered assets 66.7% 26.7% 40.0%
assets is not more than 66.7%
1. Net liabilities = total liabilities less cash and excludes trade payables, mark to market derivatives, deferred tax liabilities and provisions for Securityholder distributions
50Currency mix – including the impact Currency mix – outstanding debt
of Capital Hedging FX Swaps
51+ Updated Financial Risk Management Policy aligned with current operating practice
- Gearing target reduced to 0% - 25%
+ Interest risk management:
- Policy to ensure between 60% and 100% of current year interest rates are fixed
- 94% hedged over next 12 months
- Weighted average hedge maturity of 3.8 years
- Weighted average hedge rate of 4.02%¹,²
+ Foreign currency risk management:
- Policy to hedge between 65% and 90% of foreign currency denominated net assets
- 80% hedged as at 30 June 2017, of which 63% is debt and liabilities and 37% is derivatives
- Weighted average maturity of derivatives 3.2 years
1. Includes the strike rate on interest rate cap hedges
2. Includes the 10 year EMTN £250 million at 9.75% fixed rate 52Interest rate Interest rate hedge profile
+ Interest rates are hedged to 94% over
next 12 months
+ Weighted average hedge rate of 4.02%1
- NZD – hedge rate 4.01%
- JPY – hedge rate 2.88%
- HKD – hedge rate 2.16%
- GBP – hedge rate 4.51%2
- Euro – hedge rate 1.68%
- USD – hedge rate 6.34%
+ Weighted average maturity of 3.8 years
1. Includes the strike rate on interest rate cap hedges
2. Includes the 10 year EMTN £250 million at 9.75% fixed rate 53Interest rate hedging profile1
Euro payable GBP payable HKD payable NZD payable JPY payable USD payable AUD receivable
As at Fixed Fixed2 Fixed Fixed Fixed Fixed A$M Fixed
June rate rate rate rate rate rate Rate
€M % £M % HK$M % NZ$M % ¥M % US$M % %
2018 (579.6) 2.19 (427.7) 7.02 (2,594.8) 2.04 (240.0) 4.46 (20,500.0) 2.51 (464.8) 6.36 698.2 3.34
2019 (373.3) 1.59 (192.1) 3.31 (2,287.9) 2.31 (212.8) 4.33 (17,541.1) 2.68 (464.8) 6.36 176.9 3.09
2020 (277.2) 1.19 (150.0) 3.00 (1,582.0) 2.19 (198.2) 3.87 (16,500.0) 2.76 (464.8) 6.36 75.0 2.53
2021 (250.0) 1.29 (150.0) 3.00 (1,143.0) 2.10 (77.7) 3.17 (13,563.0) 3.14 (306.7) 6.33 75.0 2.53
2022 (97.9) 1.47 (150.0) 3.00 (844.9) 2.14 (50.0) 2.43 (12,500.0) 3.32 (36.2) 6.12 70.0 2.55
2023 - - (108.9) 3.00 (688.2) 2.17 (3.4) 2.43 (9,486.3) 3.32 - - 50.0 2.64
2024 - - - - (287.4) 2.29 - - - - - - 44.9 2.65
1. Includes the strike rate on interest rate cap hedges
2. Includes the 10 year EMTN £250 million at 9.75% fixed rate 54Foreign currency denominated balance sheet hedging maturity profile
Currency Maturity Weighted average Amount receivable1 Amount payable1
exchange rate
NZ$ 2017 / 2018 / 2021 1.1674 A$65.4m NZ$100.0m
HK$ 2018 / 2020 / 2021 / 2022 6.5396 A$529.4m HK$3,390.0m
€ 2017 / 2018 / 2020 / 2022 0.7341 A$965.7m €705.0m
£ 2017 / 2018 0.6084 A$214.1m £130.0m
US$ 2020 / 2022 0.6261 US$160.0m £100.2m
US$ 2020 / 2021 / 2022 0.7207 US$420.0m €302.7m
US$ 2019 / 2021 0.8345 €179.6m US$215.0m
US$ 2017 0.8109 £129.7m US$160.0m
A$ 2017 0.5059 £65.0m A$129.2m
CNY² 2018/2019/2020 7.1759 US$225.0m CNY1,614.6m
1. Floating rates apply for the payable and receivable legs for the cross currency swaps except for the USDEUR and USDGBP cross currency where the receivable for US$410 million is fixed at
6.375% and US$170 million is fixed at 6.0%
2. Forward exchange contract, net settled in USD 55+ Statement of Financial Position – exchange rates as at 30 June 2017
– AUDGBP – 0.5902 (30 June 2016 : 0.5613)
– AUDEUR – 0.6727 (30 June 2016 : 0.6725)
– AUDHKD – 5.9935 (30 June 2016 : 5.7786)
– AUDBRL – 2.5385 (30 June 2016 : 2.3718)
– AUDNZD – 1.0482 (30 June 2016 : 1.0456)
– AUDUSD – 0.7678 (30 June 2016 : 0.7447)
– AUDJPY – 86.2610 (30 June 2016 : 76.8420)
– AUDCNY – 5.1939 (30 June 2016 : 4.9564)
+ Statement of Financial Performance – average exchange rates for the 12 months to 30 June 2017
– AUDGBP – 0.5948 (30 June 2016 : 0.4919)
– AUDEUR – 0.6920 (30 June 2016 : 0.6565)
– AUDHKD – 5.8554 (30 June 2016 : 5.6530)
– AUDBRL – 2.4316 (30 June 2016 : 2.6922)
– AUDNZD – 1.0585 (30 June 2016 : 1.0903)
– AUDUSD – 0.7540 (30 June 2016 : 0.7285)
– AUDJPY – 82.2666 (30 June 2016 : 84.9874)
– AUDCNY – 5.1339 (30 June 2016 : 4.6927)
56thank+you
You can also read