China Commercial Real Estate Investment Market - Most international institutional investors we surveyed still remain positive and will continue ...
←
→
Page content transcription
If your browser does not render page correctly, please read the page content below

Most international institutional investors we surveyed
still remain positive and will continue investing in offices,
logistics and data centres

China Commercial

                                                                knightfrank.com.cn
Real Estate Investment
Market
June 2020
China Commercial Real Estate Investment Market (June 2020)          China Commercial Real Estate Investment Market (June 2020)

 TABLE
   OF
                                                             01   Impact of COVID-19 to Real Estate Market in China              04
                                                             02   Chinese Mainland Investment Market                             09
                                                             03   Beijing Investment Market                                      17
                                                             04   Shanghai Investment Market                                     23
                                                             05   Guangzhou Investment Market                                    29
                                                             06   Shenzhen Investment Market                                     35

CONTENT
                                                             07   Summary & The Future Outlook                                   41

                            2                                                                      3
China Commercial Real Estate Investment Market (June 2020) China Commercial Real Estate Investment Market (June 2020)
GLOBAL ECONOMIC GROWTH
PROJECTION
According to IMF’s report, the COVID-19 Table 1. Real GDP, annual percent change
pandemic will severely impact growth
across all regions. Countries / Regions 2201919 2020 2021
World Output 2.9 -3.0 5.8
The global economy is projected
to contract sharply by 3 % in 2020,
Advanced Economies 1.7 -6.1 4.5
much worse than during the 2008-09
financial crisis. United States 2.3 -5.9 4.7
Euro Area 1.2 -7.5 4.7
However, output of China is expected
to have better performance than that of Germany 0.6 -7.0 5.2
advanced economies.
France 1.3 -7.2 4.5
China’s GDP growth 2020 has been Italy 0.3 -9.1 4.8
cloudy, however a sharp rebound in H2
Spain 2.0 -8.0 4.3
01.
2020 is possible.
Japan 0.7 -5.2 3.0
United Kingdom 1.4 -6.5 4.0
Canada 1.6 -6.2 4.2
IMPACT OF COVID-19 The global
economy is projected
Other Advanced Economies
Emerging Markets and Developing Economies
1.7
3.7
-4.6
-1.0
4.5
6.6
to contract sharply by
TO REAL ESTATE 3% Emerging and Developing Asia 5.5 1.0 8.5
China 6.1 1.2 9.2
MARKET IN CHINA
in 2020
India 4.2 1.9 7.4
ASEAN-5 4.8 -0.6 7.8
Emerging and Developing Europe 2.1 -5.2 4.2
Russia 1.3 -5.5 3.5
Latin America and the Caribbean 0.1 -5.2 3.4
Brazil 1.1 -5.3 2.9
Mexico -0.1 -6.6 3.0
Middle East and Central Asia 1.2 -2.8 4.0
Saudi Arabia 0.3 -2.3 2.9
Sub-Saharan Africa 3.1 -1.6 4.1
Nigeria 2.2 -3.4 2.4
South Africa 0.2 -5.8 4.0
Low-Income Developing Countries 5.1 0.4 5.6
Source: IMF
4 5
China Commercial Real Estate Investment Market (June 2020) China Commercial Real Estate Investment Market (June 2020)
CHINA’S ECONOMIC INDICATORS The surveyed enterprises indicated the Do surveyed enterprises enjoy the following
negative impact of this epidemic on their preferential policies on financing provided by
business the government and financial institutions?
According to the data from National Table 2. Break Down of GDP in China for Q1 2020
Bureau of Statistics of China (NBS), in 1% 3% 1%
Q1 2020, due to the COVID-19 outbreak, Absolute Amount Y-O-Y Growth 12% 4% 1%
(Hundred million RMB) (%) 1%
China’s GDP was down 6.8% YoY.
Q1 Q1
11%
The added value of the secondary
GDP 206,504 -6.8
industry was down by 9.6%, which was 37%
the largest decline of three industries. Primary Industry 10,186 -3.2
Secondary Industry 73,638 -9.6 24%
At the same time, in tertiary industry,
hospitality, F&B and retail were heavily Tertiary Industry 122,680 -5.2
impacted. However, telecom, software,
Agriculture, Forestry, Fishing 10,708 -2.8
IT have maintained double-digit 79%
growth. #Industry 64,642 -8.5
Manufacturing 53,852 -10.2 26%
Construction 9,378 -17.5 None Slight Moderate Significant No Other Appropriate Reduction of the Interest Rate
on Loans and the Cost of Financing Corporate
Wholesale & Retail 18,750 -17.8 Severe Loans
Financing subsidies and Financial Increasement of the
Transportation, Warehousing, Post 7,865 -14.0
Discount Interest for Loans quantities of Credit Loan,
Medium andLong-term Loans
Hospitality, F&B 2,821 -35.3
Reduction of Financing Premium Roll Over or Renew the Loan
Finance 21,347 6.0
Source: Knight Frank Research Source: Knight Frank Research
Real Estate 15,268 -6.1
Telecom, Software, IT 8,928 13.2
Leasing & Commercial Service 7,138 -9.4
Other Service 39,660 -1.8 Do surveyed enterprises find the preferential Do surveyed enterprises have the confidence to
policies helpful to them? tide over difficulties with the help of government
Source: National Bureau of Satatics, Yearbook policies?
6%
7% 17%
29%
16%
GOVERNMENT’S STIMULUS TO 43%
CHINA ECONOMY 26%
28%
Some monetary and fiscal policies have and financing incentive have been are helpful to enterprises and they can 28%
been accessed by the government to implemented to help heavily impacted tide over difficulties with the help of
support and stimulate the economy. sectors to recover from the epidemic. government preferential policies.
Central bank of China has reduced Very Helpful Helpful Moderate Very Confident More Confident Neutral
interest rate or deposit-reserve ratio. According to Knight Frank’s survey with Lack of Confidence
Not that Much Helpless
some landlords and tenants, majority of
Some supportive policies including respondents think that the preferential Source: Knight Frank Research Source: Knight Frank Research
tax relief, rent reduction, subsidies policies enjoyed by their enterprises
6 7
China Commercial Real Estate Investment Market (June 2020)                                           China Commercial Real Estate Investment Market (June 2020)

IMPACT TO REAL ESTATE MARKET

Some companies’ expansion and                     China is looking to “new infrastructure”    Hotels are among the worst performing
relocation plans have been suspended              projects to weather the COVID-19-           sectors. We have seen hotel business
in CBD office market due to COVID-19.             plagued financial storm and boost the       dropping significantly in revenue, all
However, office leasing activity started          country’s economy in the long term.         indicative data were at historic lows
to pick up in Beijing and Shanghai, but           Investment in new infrastructure            and recovery has not being seen so far.
large-size deals were absent. New leases          including 5G, artificial intelligence,      Nevertheless, although hotels are going
recorded a 3-5% drop in effective rent            industrial internet, IoT and big data are   through a downturn, opportunities
in first tier cities in China and many            pushing the development of business         for conversion to rental apartment are
tenants have received 1-2 month rent              park / science park and data center         emerging.
relief and incentives from landlords and          sector.
local governments.                                                                            COVID-19 has boosted online shopping.
                                                  The COVID-19 pandemic has driven            As a result, demand for logistics
In contrast to the offices in CBD areas,          sales of e-commerce. Nevertheless, so       warehouse space, as well as data
performance of business park was                  far nearly all the shopping centers have    centers are surging. Most international
relatively stable due to the stable               resumed business. The consumption           institutional investors which we
business growth of TMT occupiers.                 has almost recovered to the pre-            surveyed still remain positive to
                                                  pandemic level.                             continue investing in offices, logistics
                                                                                              and data centres.

                                                                                                                                                                 02.
                                                                                                                                          CHINESE MAINLAND
                                                                                                                                         INVESTMENT MARKET

                                                                      8                                                                                                9
China Commercial Real Estate Investment Market (June 2020) China Commercial Real Estate Investment Market (June 2020)
CHINESE MAINLAND ECONOMIC CHINESE MAINLAND
OVERVIEW TRANSACTIONS – NUMBER
1.4bn 104 RMB20,650.4bn RMB7,858bn In the past decade, the annual number
4.0% yoy 6.8% yoy 19.0% yoy of major property transactions Fig 2. Major property transactions in Chinese Mainland by number
in Chinese Mainland real estate Transaction Number
investment market has reached an 1,500
average number of 877 a year, and in the 1,387 1,413
1,182
Permanent Population Consumer Price Index Gross Domestic Product Total Retail Sales 4 years of 2011, 2014, 2015 and 2016 they
1,022
(end 2019) (Q1 2020) (Q1 2020) 1,000
Consumer Goods had averaged more than 1,000. 902
769 823
(Q1 2020) 726
655 571
In 2019, there were 726 transactions 500
RMB12,268bn 59.4% recorded, down 11.8% YoY while the
RMB11,691 16.1% yoy 193
3.9% yoy 5.2% yoy average transaction value sharply
0
rose 41.2% YoY to RMB 0.38 billion per 2010 2011 2012 2013 2014 2015 2016 2017 2018 2019 Q1 2020
transaction. In Q1 2020, there were 193
major property transactions recorded, Note: Data for transactions of USD 2.5 million or more from 2010 to Q1 2020
Source:RCA, Knight Frank Research
Per Capita Disposable Added-value of Added-value of Tertiary Cumulative Growth in with average transaction volume RMB
Income (Urban) Tertiary Industry Industry as % GDP Fixed Asset Investment 0.37 billion per deal.
(Q1 2020) (Q1 2020) (Q1 2020) (Q1 2020)
RMB2,196bn
7.7% yoy
RMB1.9bn
42.5% yoy
RMB3,238bn
0.7% yoy
RMB3,336.3bn
11.4% yoy CHINESE MAINLAND
TR ANSACTIONS – SECTOR BY VALUE
Real Estate Investment Foreign Direct Investment Value of Import Value of Export
(Q1 2020) (Q1 2020) (Q1 2020) (Q1 2020)
Office transactions have been leading,
Source: China National Bureau of Statistics with annual transactions averaging Fig 3. Breakdown of major property transactions in Chinese Mainland
more than RMB 105 billion or 47.5% of by value
CHINESE MAINLAND
the total value over the past decade, Office Industrial Retail Hotel Apartment
followed by retail properties averaging
RMB(Billion)
RMB 68 billion which had taken up
TR ANSACTIONS – TOTAL VALUE
300
31.7% of total value.
250
In the past decade, the annual major Transaction value of industrial
200
property transactions in Chinese Fig 1. Major property transactions in Chinese Mainland by value properties have reached another level
Mainland real estate investment market in the last 3 years, rising sharply from 150
Transaction Value
have reached an average value of RMB about RMB 10 billion to over RMB 36
RMB(Billion) 100
206 billion, with annual transaction billion per year and accounting for 15%
300
value exceeding RMB 250 billion in each 278 of total value from 6.1%. 50
268
260
of 3 years in 2015, 2016 and 2019. 250 245
223 In 2019, office transactions accounted 0
205 208
200 2010 2011 2012 2013 2014 2015 2016 2017 2018 2019 Q1 2020
In 2019, the total transaction value 186 for 50.9% of annual major property
158 160 transaction value in Chinese Mainland,
achieved about RMB 278 billion, up 150 Note: Data for transactions of USD 2.5 million or more from 2010 to Q1 2020
Source:RCA, Knight Frank Research
24.5% YoY and it was also the biggest retail property transactions accounted
transaction amount in the past decade. 100 for 31.6%, industrial properties for 11%,
In Q1 2020, the total transaction volume 71 and hotels for 6.5%. In Q1 2020, the
50
stood at around RMB 71 billion. mainland real estate investment market
0 recorded 57.9%, 27.1%, 10.9% and 4% of
2010 2011 2012 2013 2014 2015 2016 2017 2018 2019 Q1 2020 the transaction value of office, retail
property, industrial property and hotel
Note: Data for transactions of USD 2.5 million or more from 2010 to Q1 2020
Source:RCA, Knight Frank Research transactions respectively.
10 11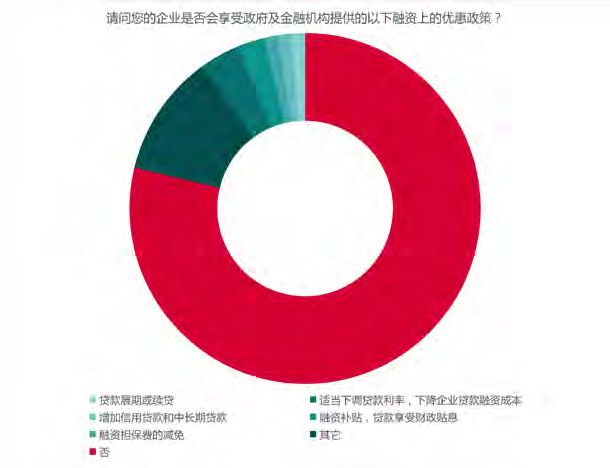
China Commercial Real Estate Investment Market (June 2020) China Commercial Real Estate Investment Market (June 2020)
CHINESE MAINLAND CHINESE MAINLAND KEY
TRANSACTIONS – SECTOR BY NUMBER TRANSACTIONS
Retail property transactions accounted Table 3. Chinese Mainland Key Transactions
for the largest share by number, on Fig 4. Breakdown of major property transactions in Chinese Mainland
by number Deal Amount
average of about 42% of major property Date 2Project City Property type Buyer Seller
transactions in the mainland market
RMB (Billion)
Office Industrial Retail Hotel Apartment
over the past decade. Offices accounted Shanghai Port City
1,500 Dec 2018 Shanghai Office, Retail CapitaLand, GIC SIPG 12.80
for about 33.3% and industrial Mixed-Use Project
properties for about 16.24%.
Shenzhen OCT Tower Shenzhen Overseas
1,000 Apr 2019 Shenzhen Office China Life 12.00
(60% of equity) Chinese Town Co., Ltd.
In 2019, the share of retail property
and office transactions was 41.8% and Greenland Huangpu
Jul 2019 Shanghai Retail Brookfield AM Greenland 10.56
34% respectively, up 17.7 percentage
500 Riverside
points and 14.1 percentage points Mar 2019 Changtai Plaza Shanghai Office, Retail Blackstone CJ Group 10.02
YoY. The increasing share of retail 0
2010 2011 2012 2013 2014 2015 2016 2017 2018 2019 Q1 2020 Office, Retail, Partners Group, Gaw
and office assets were not only related Dec 2018 Sanlitun Yingke Centre Beijing China Visonary 10.50
Apartment Capital
to the increase of their transaction
Note: Data for transactions of USD 2.5 million or more from 2010 to Q1 2020
number, but also resulted from the Source:RCA, Knight Frank Research Kun Square,
Feb 2019 Beijing Retail ByteDance ZK Investment 9.00
declining proportion of industrial Great Bell Temple
property transaction number. The
Shanghai Mapletree
number of major property transaction In 2019, industrial properties accounted 34.2%, 41.8%, 17.2% and 6.3% of the Nov 2019 Shanghai Office, Retail Blackstone Mapletree Investment 8.25
Business City & Vivo City
has fallen sharply in recent years as for about 17.3% of total transaction transaction number of office, retail
more investors or original owners number, down about 24.5 percentage property, industrial property and hotel Singapore RECO
have transferred assets in the form of points YoY. In Q1 2020, the mainland transaction respectively. Feb 2020 LG Twin Tower Beijing Office Changan Private LG Holdings 8.04
portfolios. real estate investment market recorded Ltd
T2 Building, China CITIC Prudential China Resources Land
Dec 2019 Shenzhen Office 8.00
Resources Qianhai Plaza Life Qianhai Co., Ltd
Tianjin Urban
China Resources Infrastructure
Jan 2019 Tianjin Galaxy Tianjin Retail 7.93
CHINESE MAINLAND BREAKDOWN Land Construction
Investment Group
BY FIRST-TIER CITIES Note: The major property transaction amount is for the past 24 months and calculated in terms of the actual transaction value
The order of the transaction list is sorted by transaction value
Source: RCA, Knight Frank Research
From 2016 to 2019, excluding land
transactions, the share of major Fig 5. The share of major property transaction value in first-tire
property transaction value in Beijing cities in 2016 and 2019
and Guangzhou had grown, while Beijing Shanghai Guangzhou Shenzhen
those in Shanghai and Shenzhen had
dropped. Beijing, in particular, had seen 2.3% 4.5%
9.6% 8.4%
its share rising sharply, reversing the
previous situation in which Shanghai
accounted for more than half of the total 44.6%
2016 2019
transaction value.
31.7% 56.4%
42.6%
Note: Data for transactions of USD 2.5 million or more in 2016 and 2019
Source:RCA, Knight Frank Research
12 13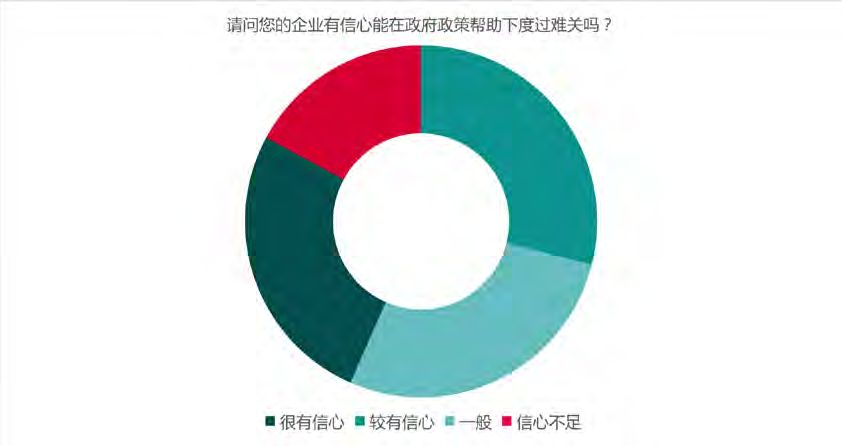
China Commercial Real Estate Investment Market (June 2020) China Commercial Real Estate Investment Market (June 2020)
CHINESE MAINLAND BUYER PROFILE CHINESE MAINLAND MAJOR SELLERS
By transaction value, private Table 4. Chinese Mainland Major Sellers
investors were the key buyers in the Fig 6. Buyer composition of major property transaction market in
Chinese Mainland market, but their Chinese Mainland Selling amount Average Price
Ranking 2Seller Number of Projects
share has been decreasing since Private Buyer REITS/Listed Company Institutional Buyer Foreign Buyer RMB(Billion) RMB(Billion)
2013.
10.0% 11.0% 9.8%
1 HNA Group 32 15 2
12.8% 11.8% 11.7% 14.2% 11.7% 14.0%
15.8%
2.7%
2 SOHO China 22 14 2
2.8% 6.6%
In 2019, private investors accounted
3.3% 3.9% 4.9%
7.5% 6.1% 5.2% 29.2%
4.0%
20.2%
for 39.4% of total major property 19.1%
26.0% 25.9%
26.7%
5.8%
3 YMCI (China) 22 27 1
transaction value, showing the 35.1%
45.0%
33.9%
40.8%
decrease from 2018.
41.9%
4 Greenland Group 21 36 1
33.9%
5 Guangzhou Metro 19 3 6
The share of REITS/listed companies 65.2%
67.1%
58.0%
in the past decade has been on the
60.2%
56.9% 6 China Oceanwide Holdings 15 2 8
45.7% 46.9%
39.4%
38.4%
rise. In 2019, they accounted for 37.8%
31.0%
7 Thaihot Group 13 23 1
40.8% of the total transaction value.
8 Shanghai Int’l Port Group 13 2 6
2010 2011 2012 2013 2014 2015 2016 2017 2018 2019 Q1 2020
In addition, the share of foreign 9 CMIG 12 1 12
Note: Data for transactions of USD 2.5 million or more from 2010 to Q1 2020, excluding 'Other Buyer' in RCA
buyers has remained stable in the Source:RCA, Knight Frank Research
past decade but peaked in 2019, 10 Partners Group 10 3 3
reached around 15.8%, due to the foreign buyers, private buyers and market, while the institutional
Note: The transaction amount is the total for the past 24 months, sorted by transaction amount from high to low
weakening RMB exchange rate. REITS/listed companies accounted buyers took up the least share. Source: RCA, Knight Frank Research
for a similar share of the Chinese
In Q1 2020, the transaction value of Mainland major property transaction
CHINESE MAINL AND RELEVANT
CHINESE MAINLAND SELLER PROFILE POLICIES
Table 5. Recent Relevant Policies on Real Estate Investment in Chinese Mainland first-tire cities
By tra nsaction va lue, private a nd City 2Recent Relevant Policies on Real Estate Investment
foreign sellers dominated t he Fig 7. Seller composition of major property transaction market in
Chinese Ma inla nd ma rket during Chinese Mainland The Foreign Investment Law (March, 2019) provides better market conditions for foreign investors to invest in China.
It is expected that foreign investors will maintain an advantageous position in major property investment and play an
t he 9 yea rs from 201 1 to 2018. Private Seller REITS/Listed Company Institutional Seller Foreign Seller active role in the Beijing market.
Beijing
However, in 2019, t he tra nsaction On 2 August 2019, the Beijing Municipal Housing and Construction Commission issued a White Paper on Housing
and Urban-Rural Construction Development in Beijing (2019), which aims to stabilise prices of land and housing and
15.4%
va lue of foreign sellers accounted 33.3% 34.4% 35.0%
40.4%
41.4% firmly curb the demand for speculative housing investment.
for t he lowest sha re in t he decade, 50.0%
37.1% 13.2%
48.2%
48.8% 52.4%
for about 15.4%, a signif ica nt 1.7%
Several changes coming into effect on 1 September 2019 optimise the criteria for regional headquarters
identification, which enables more enterprises such as the Internet, digital and other emerging areas of light assets
10.5%
drop of 26 percentage points YoY. 10.1%
enterprises comply with the regional headquarters recognition, enjoy financial subsidies and tax relief and other
13.5% 11.4% 33.0%
1.2% 10.5%
This cha nge wa s related to t he 27.9% 8.3% 31.7%
11.6%
10.1%
11.4%
25.9% policy preferences.
wea kening R M B excha nge rate. 10.4%
24.7% 14.3%
15.2% On 6 August 2019, the State Council approved the establishment of a new area of China (Shanghai) Free Trade Pilot
Shanghai Zone, and launched a number of active policies aimed at forming international business, cross-border financial
45.7%
In 2019, private sellers accounted 38.4%
37.7%
31.7% 32.9% 38.5%
services, cutting-edge technology research and development, cross-border service trade and other functions,
31.3% 36.0%
28.1% 25.9%
for about 38. 5% of t he tota l 21%
including the advance industry intelligent network link and new energy vehicles.
tra nsaction va lue, a nd R EITS/listed
2010 2011 2012 2013 2014 2015 2016 2017 2018 2019 Q1 2020
compa nies accounted for 33%, t he On Sep 12,2019, the municipal government put forward 26 concrete measures to propel foreign investment, aiming
la rgest sha re in t he pa st decade.
Note: Data for transactions of USD 2.5 million or more from 2010 to Q1 2020, excluding 'Other Seller' in RCA
Source:RCA, Knight Frank Research
to broaden and deepen the scope of foreign investment. Notably, the stock, funds and Insurance markets have
been opened up due to the widening or canceling of restrictions on the ratio of foreign equity.
Institutiona l sellers accounted for In Q1 2020, foreign sellers sellers each accounted for 25.9% At the beginning of 2019, “The plan for key construction projects of 2019 in Guangzhou” was released. In terms of Ur-
about 8% of t he a nnua l tra nsaction accounted for t he la rgest sha re of respectively. ban Renewal and Land Readiness, Guangzhou plans to invest RMB31.1billion to propel 52 projects across 11 districts.
va lue in t he pa st decade, a nd 13.2% tra nsactions, at 48.2%, a nd R EITS/ Guangzhou Financial policy is generally loose, but residential mortgages and corporate financing restrictions have not
for 2019. listed compa nies a nd private
been significantly relaxed. Since May 2019 housing enterprises continued to operate in the tightening financing
environment, focusing on trust, foreign debt, development, loans and other areas.
14 15
China Commercial Real Estate Investment Market (June 2020) China Commercial Real Estate Investment Market (June 2020)
City Recent Relevant Policies on Real Estate Investment
On August 18, 2019, the Central Committee of the Communist Party of China and the State Council issued the
Opinions on Supporting the Construction of the First Demonstration Zone of Socialism with Chinese Characteris-
tics in Shenzhen. According to the Opinion, Shenzhen will be strategically positioned as a global benchmark city
with competitiveness, innovation and influence.
The Opinions support Shenzhen’s implementation of a more open and convenient management system for
the introduction and entry and exit of foreign talents, the promotion of interconnection with Hong Kong and
Shenzhen Macau financial markets and mutual recognition of financial (fund) products, the first test in promoting the
internationalization of the RMB, and the exploration of innovative cross-border financial supervision. The policy
aims to support Shenzhen to pilot the deepening of foreign exchange management reform, build free trade pilot
zones with high standards and quality, and promote more international organizations and institutions to settle in
Shenzhen.
In February 2020, the “Shenzhen 2020 Major Project Plan” was issued. In the plan, there are 122 projects for
industrial parks, production lines, and R & D center. Also, there are 48 urban renewal projects and 37 headquarters
projects.
03.
BEIJING
INVESTMENT MARKET
16 17
China Commercial Real Estate Investment Market (June 2020) China Commercial Real Estate Investment Market (June 2020)
BEIJING ECONOMIC OVERVIEW BEIJING TRANSACTIONS – BY
21.54million 103.8 RMB746.2bn RMB271.6bn NUMBER OF DEALS
3.8% yoy 6.6% yoy 21.5% yoy
In the past ten years, the average
number of major property transactions Fig 9. Major property transactions in Beijing by number
Permanent Population Consumer Price Index Gross Domestic Product Total Retail Sales in Beijing real estate investment market Transaction Number
(end 2019) (Q1 2020) (Q1 2020) Consumer Goods has achieved 212 deals per year, with 600
(Q1 2020) annual transaction number exceeding
350 in each of the 2 years in 2010 and
400 396
RMB653.9bn 87.6% 2016. 355
RMB19,349 7.1% yoy 347
323
4.8% yoy 4.8% yoy 257
There were 116 deals in 2019, which 200 185
142
was lower than the average annual 111 116
75
number in the past decade. However, 33
0
Per Capita Disposable Added-value of Added-value of Tertiary Cumulative Growth in The average transaction value per deal 2010 2011 2012 2013 2014 2015 2016 2017 2018 2019 Q1 2020
Income (Urban) Tertiary Industry Industry as % GDP Fixed Asset Investment increased sharply by 105.6% YoY to RMB
(Q1 2020) (Q1 2020) (Q1 2020) (Q1 2020) 0.74 billion. Note: Data for transactions of USD 2.5 million or more from 2010 to Q1 2020
Source:RCA, Knight Frank Research
In Q1 2020, there were 33 major property
6.4% yoy 4.3% yoy RMB502.9bn RMB122.4bn transactions recorded in Beijing market,
8.4% yoy 4.4% yoy
with average transaction volume RMB
0.8 billion per deal.
Real Estate Investment Foreign Direct Investment Value of Import Value of Export
(Q1 2020) (2019) (Q1 2020) (Q1 2020) BEIJING TRANSACTIONS – SECTOR
Source: Official Data
BY VALUE
BEIJING TR ANSACTIONS – TOTAL Office transactions took the lead, with
Fig 10. Breakdown of major property transactions in Beijing by value
VALUE
the average annual transaction value
accounting for more than half of the major
property transactions in Beijing over the Office Industrial Retail Hotel Apartment
past decade, or about 50.3% on average.
RMB(Billion)
Retail properties came the second, which
In the past decade, the annual major 100
had an average of about 35.4% of Beijing
property transactions in Beijing real Fig 8. Major property transactions in Beijing by value major property transaction value in the
estate investment market have reached 80
Transaction Value past decade. Hotels ranked third, but the
an average value of about RMB 48.6
RMB(Billion) average share was less than 10%. Lastly, the 60
billion, with annual transaction value
100 average share of industrial properties and
achieved highest point at RMB 86
86
apartments was less than 5%. 40
billion in 2019. 80
70
61 In 2019, office transactions accounted for 20
In Q1 2020, the transaction value for 60 57
49 about 56.7% of the total major property
major property was RMB 26 billion. 41 43 40 0
40 transaction value, retail properties
31
29 2010 2011 2012 2013 2014 2015 2016 2017 2018 2019 Q1 2020
26 accounted for about 32.2%, and the
20
remaining types of property assets
Note: Data for transactions of USD 2.5 million or more from 2010 to Q1 2020
0 accounted for about 11%. In Q1 2020, only Source:RCA, Knight Frank Research
2010 2011 2012 2013 2014 2015 2016 2017 2018 2019 Q1 2020 office and retail property transactions
were recorded, with the transaction value
Note: Data for transactions of USD 2.5 million or more from 2010 to Q1 2020 accounting for about 87.7% and 12.3%,
Source:RCA, Knight Frank Research
respectively.
18 19China Commercial Real Estate Investment Market (June 2020) China Commercial Real Estate Investment Market (June 2020)
BEIJING TRANSACTIONS - SECTOR Date 2Project Property type Buyer Seller
Deal Amount
RMB (Billion)
BY NUMBER Jun 2018 New EBA Investments Office Postal Savings Bank of China EBA Investments 4.00
ICBC International
Mar 2019 Glory Star Financial Tower Office Mapletree Investment 3.40
After 2016, more investors or original Holding Co., Ltd
property owners transacted Beijing real Fig 11. Breakdown of major property transactions in Beijing by
estate assets in the form of investment number Note: The major property transaction amount is for the past 24 months and calculated in terms of the actual transaction value
The order of the transaction list is sorted by transaction value
portfolio. The number of major Office Industrial Retail Hotel Apartment
Source: RCA, Knight Frank Research
property transactions of five types of 500
property assets, including office, retail
property, industrial property, hotel and 400
apartment, declined significantly, but
the transaction share of all types of
BEIJING BUYER PROFILE
300
assets did not fluctuate significantly.
200
By transaction value, real estate
In 2019, office transactions accounted
investment market in Beijing used to be Fig 12. Buyer composition of major property transaction market
for 47.4% of the total number of major 100
dominated by REITS/ listed companies in Beijing
property transactions in Beijing,
and private investors. But since 2012, Private Buyer REITS/Listed Company Institutional Buyer Foreign Buyer
retail properties for 43.1%, hotels and 0
2010 2011 2012 2013 2014 2015 2016 2017 2018 2019 Q1 2020 the share of REITS/ listed companies
apartments for less than 10% each. In Q1 6.0%
gradually increased. In 2019, REITS/
7.7%
10.7%
15.6% 14.6%
2020, office transactions accounted for Note: Data for transactions of USD 2.5 million or more from 2010 to Q1 2020
6.0%
3.9%
15.4%
20.8%
16.5%
24.1%
Source:RCA, Knight Frank Research listed companies accounted for 32.6% 3.6%
66.7% of the total transaction number,
17.9% 34.3%
13.5%
14.6% 11.7%
of total investment value, while private 8.5%
while retail properties for 33.3%. 9.1%
55.2%
buyers accounted for only 19.6%. 30.0%
47.3%
26.9% 13.5%
51.3%
35.4%
Foreign buyers accounted for the biggest 52.6%
50.3%
56.6%
44.3%
3.7%
share of buyers in Beijing market in 32.6%
BEIJING KEY TRANSACTIONS 2019 over the past decade, Knight Frank
speculated that the shift was driven by
47.5% 51.8%
40.7%
34.1%
29.0%
34.4%
20.4% 22.6%
18.5% 19.6%
the weakening RMB exchange rate. 15.2%
12.0%
2010 2011 2012 2013 2014 2015 2016 2017 2018 2019 Q1 2020
Table 6. Key Transactions By the transaction value, in Q1, foreign
Note: Data for transactions of USD 2.5 million or more from 2010 to Q1 2020, excluding 'Other Buyer' in RCA
buyers were the major buyers in the Source:RCA, Knight Frank Research
Deal Amount
Date 2Project Property type Buyer Seller market, accounting for 55.2% of the
RMB (Billion)
transaction value, while REITS/
Office, Retail, Partners Group, Gaw listed companies, private buyers and
Dec 2018 Sanlitun Yingke Centre China Visionary 10.50
Apartment Capital institutional buyers accounted for 29%,
12% and 3.7% respectively.
Kun Square, Great Bell
Feb 2019 Retail ByteDance ZK Investment 9.00
Temple
Singapore RECO Changan
Feb 2020 LG Twin Tower Office LG Holdings 8.04
Private Ltd
Partners Group, SDP Invest-
Mar 2019 Dinghao Electronic Building Office ment, Carlyle Group, Middle Sino Horizon 7.50
East Family Wealth Fund
Zhongguancun Times
Oct 2019 Retail EBA Investments Glorious Oriental 6.80
Shopping Plaza
Ronsin Technology Center
Oct 2019 Office, Retail Allianz Real Estate, Alpha Asia D&J China 6.60
(85% of equity)
Beijing Pangushi
Aug 2019 Pangu Plaza Office BBMG 5.18
Investment Co., Ltd
North Building of Oriental
Dec 2018 Office AEW, HONY Capital HOPSON 4.05
Culture and Art Center
20 21China Commercial Real Estate Investment Market (June 2020) China Commercial Real Estate Investment Market (June 2020)
BEIJING SELLER POFILE
By transaction value, in the four
years from 2010 to 2013, Beijing real Fig 13. Seller composition of major property transaction market
estate investment market was mainly in Beijing
dominated by private sellers. From 2014 Private Seller REITS/Listed Company Institutional Seller Foreign Seller
to 2016, foreign sellers were the main
ones while between 2017 and 2019, seller 12.9% 15.2%
18.1%
18.5% 22.2%
segmentation proportion continued to 31.9%
49.0%
12.1%
change. 50.0% 56.7% 13.4% 51.6% 5.2% 49.3%
28.2%
31.8%
2.7%
3.7% 17.2%
In 2019, the share of REITS/ listed 33.5%
6.6% 3.5%
companies was 33.5%, a significant
6.7% 56.7%
increase of 29.8 percentage points YoY. 23.6%
22.7% 21.7%
10.8%
Private sellers accounted for about 39.1% 46.7%
55.4% 55.6%
3.7% 50.0%
61.7% 39.1%
of the total transaction value, a increase 25.8% 24.8%
26.4%
of 16.1 percentage points YoY.
23.0%
11.8%
0.7%
2010 2011 2012 2013 2014 2015 2016 2017 2018 2019 Q1 2020
Foreign sellers accounted for 22.2% of
Note: Data for transactions of USD 2.5 million or more from 2010 to Q1 2020, excluding 'Other Seller' in RCA
the total transaction value in 2019, a Source:RCA, Knight Frank Research
04.
significant decrease of 29.4 percentage
points YoY while institutional sellers
accounted for approximately 5.2%, a
decrease of 16.5 percentage points YoY.
In Q1 2020, REITS/ listed companies
accounted for 50% of the total sales SHANGHAI
INVESTMENT MARKET
transaction value, and the remaining
sales transactions came from foreign and
private sellers, accounting for 49.3% and
0.7% respectively.
22 23China Commercial Real Estate Investment Market (June 2020) China Commercial Real Estate Investment Market (June 2020)
SHANGHAI ECONOMIC OVERVIEW SHANGHAI TRANSACTIONS –
24.28million 103.4 RMB785.6bn RMB306bn NUMBER
3.4% yoy 6.7% yoy 20.4% yoy
In the past ten years, the average
number of major property transactions Fig 15. Major property transactions in Shanghai by number
Permanent Population Consumer Price Index Gross Domestic Product Total Retail Sales in Shanghai real estate investment Transaction Number
(end 2019) (Q1 2020) (Q1 2020) Consumer Goods market has reached 172 per year while 400
(Q1 2020) in 2019 it was 138, down by 9.2% YoY.
310
The average transaction value per deal 300
279
RMB609.6bn increased by 30.6% YoY to RMB 0.65
RMB20,646 77.5% 9.3% yoy 206 207
billion. 200 184
4.9% yoy 2.7% yoy 162
147 152 138
100
In Q1 2020, there were 44 major 72
44
property transactions recorded, with
0
Per Capita Disposable Added-value of Added-value of Tertiary Cumulative Growth in and average value of RMB 0.55 billion 2010 2011 2012 2013 2014 2015 2016 2017 2018 2019 Q1 2020
Income (Urban) Tertiary Industry Industry as % GDP Fixed Asset Investment per transaction.
(Q1 2020) (Q1 2020) (Q1 2020) (Q1 2020) Note: Data for transactions of USD 2.5 million or more from 2010 to Q1 2020
Source:RCA, Knight Frank Research
8.2% yoy 4.5% yoy RMB463.7bn RMB292.3bn
1.7% yoy 7.3% yoy
SHANGHAI TRANSACTIONS –
Real Estate Investment Foreign Direct Investment Value of Import
SECTOR BY VALUE
Value of Export
(Q1 2020) (Q1 2020) (Q1 2020) (Q1 2020)
Source: Official Data
Office transactions took the lead, with the
average annual transaction value over the Fig 16. Breakdown of major property transactions in Shanghai
SHANGHAI TR ANSACTIONS – TOTAL past decade accounting for about 65% of the by value
major property transactions in Shanghai. Office Industrial Retail Hotel Apartment
VALUE The second was retail properties, which
had averaged only about 18.1% share while
RMB(Billion)
150
the other types of property assets were less
than 10%.
100
In the past decade, the annual major
property transactions in Shanghai real Fig 14. Major property transactions in Shanghai by value In 2019, the segmentation share of major
property transactions in Shanghai real 50
estate investment market have reached Transaction Value
an average value of RMB 73 billion, estate investment market was also in
RMB(Billion) line with the market pattern. Office 0
ranking first among the four first-tier
150 transactions accounted for about 68.6% of 2010 2011 2012 2013 2014 2015 2016 2017 2018 2019 Q1 2020
cities in China. In addition, the annual
transaction value exceeded RMB 100 the total major property transaction value,
Note: Data for transactions of USD 2.5 million or more from 2010 to Q1 2020
109 retail properties accounted for about 23.3%,
billion in each of the three years from 100 101 102 Source:RCA, Knight Frank Research
90 and the remaining types of property assets
2015 to 2017.
72 76
74 65 accounted for 8.1% in total.
In 2019, the total transaction value of 50 45 46
major property in Shanghai real estate 24 In Q1 2020, there were transactions in
market reached RMB 90 billion, up office, industrial property, retail property
0 and hotel in Shanghai market, with the
18.6% YoY. In Q1 2020, the transaction
2010 2011 2012 2013 2014 2015 2016 2017 2018 2019 Q1 2020
value for major property stood at RMB transaction value accounting for 65%,
24 billion. 19.8%, 6.8% and 8.4% respectively .
Note: Data for transactions of USD 2.5 million or more from 2010 to Q1 2020
Source:RCA, Knight Frank Research
24 25China Commercial Real Estate Investment Market (June 2020) China Commercial Real Estate Investment Market (June 2020)
SHANGHAI TRANSACTIONS - Date 2Project Property type Buyer Seller
Deal Amount
RMB (Billion)
SECTOR BY NUMBER Dec 2018
Building 1, Fuyuan Land
Plaza
Office China Reinsurance Group
China Enterprise Com-
pany Limited, SUNAC
3.08
QuadReal Property, GAW ARA Asset
Nov 2018 Shanghai Ocean Tower Office 2.97
Since 2011, the segmentation of major Capital Management
proprety transactions in Shanghai Fig 17. Breakdown of major property transactions in Shanghai
by number Building A-D, Shanghai
real estate market remained stable, Jan 2019 Office GAW Capital China Resources Land 2.80
Mixc Mall
with office transactions accounting for Office Industrial Retail Hotel Apartment
49.3% of the total transaction number, 400
Note: The major property transaction amount is for the past 24 months and calculated in terms of the actual transaction value.
retail properties accounting for 33.8%, The order of the transaction list is sorted by transaction value
and other property asset transactions Source: RCA, Knight Frank Research
300
accounting for less than 10% in the past
decade. 200
In 2019, the segmentation of major 100 SHANGHAI BUYER PROFILE
property transaction value in Shanghai
real estate market also followed the 0
2010 2011 2012 2013 2014 2015 2016 2017 2018 2019 Q1 2020
previous trend. Offices accounted for By transaction value, in the past
50% of the total number of Shanghai Note: Data for transactions of USD 2.5 million or more from 2010 to Q1 2020 decade, real estate investment market Fig 18. Buyer composition of major property transaction market
major property transactions, retail
Source: RCA, Knight Frank Research
in Shanghai has been dominated by in Shanghai
properties for 37.7%, industrial REITS/ listed companies, accounting Private Buyer REITS/Listed Company Institutional Buyer Foreign Buyer
properties and hotels for less than 10% In Q1 2020, offices and retail properties for about 34.2%, but the share of private
each. There was no major transaction accounted for 40.9% of the total hotels for 6.8%. investors accounted for about 28.4%. 14.6%
8.4%
19.1% 18.1%
record for apartments.
25.0%
transaction number respectively, 31.6%
8.7% 29.7% 22.3%
31.4%
32.5% 30.6%
industrial properties for 11.4% and In 2019, REITS/ listed companies 13.4%
19.9%
0.8%
9.8%
accounted for an average of about 37.5%
18.3% 64.1%
9.2%
16.6% 13.3%
of total transaction value, while private 40.5% 34.7%
29.7% 33.2%
31.2%
buyers accounted for about 22.7%. 29.5%
43.5% 37.5%
SHANGHAI KEY TRANSACTIONS
29.9% 32.6%
8.5%
Foreign buyers accounted for an average
12.0%
37.8% 34.2% 36.1%
of 24.1% of total transaction value in the 29.3% 34.7% 27.3%
18.5%
21.6%
22.7%
22.1%
15.5%
past decade, compared with about 31.5%
Table 7. Key Transactions in the past three years. 2010 2011 2012 2013 2014 2015 2016 2017 2018 2019 Q1 2020
Note: Data for transactions of USD 2.5 million or more from 2010 to Q1 2020, excluding 'Other Buyer' in RCA
Deal Amount Institutional buyers have averaged Source:RCA, Knight Frank Research
Date 2Project Property type Buyer Seller
RMB (Billion) about 13.3% of the transaction value
Shanghai Port City share over the past decade, and about
Dec 2018 Office, Retail CapitaLand, GIC SIPG 12.80 9.2% in 2019.
Mixed-use Project
Greenland Huangpu
Jul 2019 Retail Brookfield AM Greenland 10.56 In Q1 2020, foreign buyers, private
Riverside
buyers, REITS/listed companies and
institutional buyers all had transaction
Mar 2019 Changtai Plaza Office, Retail Blackstone CJ Group 10.02
records in the Shanghai major
property transaction market, and the
Shanghai Mapletree
Nov 2019 Office, Retail Blackstone Mapletree Investment 8.25 transaction value of these 4 types of
Business City & Vivo City
buyers accounted for 64.1%, 15.5%, 12%
Shui On Land, Hongli Invest-
and 8.5% of the total transaction value
Jun 2019 Shanghai Enterprise NO. 5 Office ment, China Life Trustees China Life Trustees 5.69
respectively.
Limited
Keppel Land, Universal-Invest- Yifang Jingyi Enter-
Mar 2019 Shanghai Yifang Building Office ment, Bayerische Versorgung- prise Management 4.60
skammer (BVK) Company
Longyu International GIC, Hong Kong-Shanghai
Jun 2018 Office Baoshang Bank 3.23
Business Plaza Alliance
26 27China Commercial Real Estate Investment Market (June 2020) China Commercial Real Estate Investment Market (June 2020)
SHANGHAI SELLER PROFILE
By transaction value, as Shanghai
market continues to diversify, the Fig 19. Seller composition of major property transaction market
segmentation of sellers in Shanghai real in Shanghai
estate investment market continued to Private Seller REITS/Listed Company Institutional Seller Foreign Seller
change, with no specific leading seller.
7.0% 9.2%
2.5%
21.7%
In the past decade, REITS/ listed 25.2%
35.3%
28.2%
24.9%
40.1%
companies accounted for an average 2.8%
43.3%
of about 22.5% of the total transaction 35.8%
72.9%
58.0%
22.4%
72.6%
value and 25% of private sellers. In 2019, 10.2%
40.4%
19.6%
30.3%
65.0%
the share of REITS/ listed companies 11.6%
28.7%
11.7%
7.8%
and private sellers was about 30.3% and 27.5%
37.8% respectively. Both categories of 4.2%
23.7%
15.7% 38.1% 42.5%
18.1% 37.8%
sellers accounted for more of the year
10.2% 33.4%
31.6%
22.0% 23.2%
than in 2018. 11.7% 12.7% 10.5% 9.9%
2010 2011 2012 2013 2014 2015 2016 2017 2018 2019 Q1 2020
The share of foreign sellers in all
Note: Data for transactions of USD 2.5 million or more from 2010 to Q1 2020, excluding 'Other Seller' in RCA
categories changed the most. Foreign Source:RCA, Knight Frank Research
05.
sellers accounted for 43.3% of the total
transaction value in 2018, but only 7% in
2019. Same in other markets, the RMB
exchange rate is one of the important
factors affecting the sale of projects by
foreign sellers, and it also reflected the
strong sensitivity of investors to the
GUANGZHOU
INVESTMENT MARKET
major property investment market.
In the past decade, the average
transaction value of institutional sellers
was about 12.1%, but from 2017 to 2019,
the average value of institutional sellers
reached about 25.3%.
In Q1 2020, foreign sellers, REITS/
listed companies, private, foreign and
institutional sellers accounted for
65%, 23.3%, 9.2% and 2.5% of the total
transaction value respectively.
28 29China Commercial Real Estate Investment Market (June 2020) China Commercial Real Estate Investment Market (June 2020)
GUANGZHOU ECONOMIC OVERVIEW GUANGZHOU TRANSACTIONS –
15.30million 104.1 RMB522.8bn RMB199.5bn NUMBER
4.1% yoy 6.8% yoy 15.0% yoy
In the past ten years, the average
number of major property transactions Fig 21. Major property transactions in Guangzhou by number
Permanent Population Consumer Price Index Gross Domestic Product Total Retail Sales
in Guangzhou real estate investment Transaction Number
(end 2019) (Q1 2020) (Q1 2020) Consumer Goods
market has reached 32 deals per year.
(Q1 2020) 60
In 2012, 2014 and 2017, the number of
major property transactions exceeded 50 48
46 46
RMB 65,052 RMB396.8bn 75.8% 7.4% yoy 45 deals. In 2019, the transaction
8.5% yoy 2.2% yoy 40 39 38 40
number was 26, dropped significantly
by 35% YoY and the average value per 30
30
transaction decreased by 18.2% YoY to 26
RMB 0.34 billion. 20 21
Per Capita Disposable Added-value of Added-value of Tertiary Cumulative Growth in
Income (Urban) Tertiary Industry Industry as % GDP Fixed Asset Investment 11
10 10
In Q1 2020, there were 11 major property
(2019) (Q1 2020) (Q1 2020) (Q1 2020)
transactions recorded with average
0
value RMB 0.45 billion per transaction.
2010 2011 2012 2013 2014 2015 2016 2017 2018 2019 Q1 2020
8.4% yoy 2.6% yoy RMB91.6bn RMB110.8bn
Note: Data for transactions of USD 2.5 million or more from 2010 to Q1 2020
13.0% yoy 2.7% yoy Source:RCA, Knight Frank Research
Real Estate Investment
(Q1 2020)
Foreign Direct Investment
(Q1 2020)
Value of Import
(Q1 2020)
Value of Export
(Q1 2020)
GUANGZHOU TRANSACTIONS –
SECTOR BY VALUE
Source: Official Data
GUANGZHOU TRANSACTIONS –
Office accounted for the largest share
TOTAL VALUE of major property transaction market
in Guangzhou over the past decade,
Fig 22. Breakdown of major property transactions in Guangzhou
by value
followed by retail properties. But between Office Industrial Retail Hotel Apartment
In the past decade, there were strong 2013 and 2018, the transaction value of
RMB(Billion)
fluctuations in the major property Fig 20. Major property transactions in Guangzhou by value retail properties exceeded that of offices
20
transaction value in Guangzhou real Transaction Value for four years.
estate investment market. The total
RMB(Billion) 15
transaction value could reach over RMB In 2019, offices regained their leading
25
15 billion in 2012, 2014, and 2018, while position in the market, with transaction
10
it could also reach below RMB 8 billion value accounting for 84.3% of the total
20 19
in some years. value in Guangzhou market. The rest of
5
16 16 that were almost from retail properties.
15
In 2019, the total transaction value 14 In Q1 2020, transaction values of offices
0
of major property in Guangzhou real and retail properties accounted for 4.5% 2010 2011 2012 2013 2014 2015 2016 2017 2018 2019 Q1 2020
10 9
estate market reached RMB 9 billion, 9 and 95.5% respectively in Guangzhou
7 Note: Data for transactions of USD 2.5 million or more from 2010 to Q1 2020
down sharply by 46.8% YoY. In Q1 2020, 7 7 market . The retail transaction value was Source:RCA, Knight Frank Research
5 5
the transaction value for major property 4 mainly contributed by the Pearl River Sun
was RMB 5 billion, with an average City Plaza project, with total transaction
transaction value of RMB 0.45 billion 0
value around RMB 4.6 billion, according
per deal. 2010 2011 2012 2013 2014 2015 2016 2017 2018 2019 Q1 2020
to RCA.
Note: Data for transactions of USD 2.5 million or more from 2010 to Q1 2020
Source:RCA, Knight Frank Research
30 31China Commercial Real Estate Investment Market (June 2020) China Commercial Real Estate Investment Market (June 2020)
GUANGZHOU TRANSACTIONS - Date 2Project Property type Buyer Seller
Deal Amount
RMB (Billion)
SECTOR BY NUMBER May 2018
Guangzhou No.3 Data
Industrial GDS
Guangzhou Weiteng
Data Technology Co.,
0.26
Center
Ltd
Since 2010, the major property
Fig 23. Breakdown of major property transactions in Guangzhou Jan 2018 Lliberation Building Apartment Landsea Hon Kwok Land 0.26
transaction number in Guangzhou
has led by retail property, accounting by number
Swire Cold Chain Logistics
for about 48.4% in the past decade, Office Industrial Retail Hotel Apartment Jul 2018 Industrial Vanke Logistic Swire Property 0.19
Asset Portfolio
followed by offices, accounting for 41%. 50
Note: The major property transaction amount is for the past 24 months and calculated in terms of the actual transaction value.
Between 2017 and 2019, the number of 40 The order of the transaction list is sorted by transaction value
Source: RCA, Knight Frank Research
major property transaction in industrial
properties rose from the previous 30
year, accounting for 11.7% of the total
20
GUANGZHOU BUYER PROFILE
transaction value for that 3 years.
In 2019, office and retail property 10
transactions accounted for 46% and
0
50% respectively of the total transaction By transaction value, real estate
2010 2011 2012 2013 2014 2015 2016 2017 2018 2019 Q1 2020
number, with 4% for industrial investment market in Guangzhou was Fig 24. Buyer composition of major property transaction market
properties. In Q1 2020, the transaction Note: Data for transactions of USD 2.5 million or more from 2010 to Q1 2020
dominated by REITS/ listed companies in Guangzhou
Source: RCA, Knight Frank Research
number of retail properties accounted in the past decade. The share of private Private Buyer REITS/Listed Company Institutional Buyer Foreign Buyer
for 91% of the total transaction number buyers in the total transaction value
while offices for 9%. were relatively stable from 2013 to 2019 11.6% 12.8%
6.6% 10.8%
18.0% 6.2% 18.6%
22.3% 2.1% 25.4%
after a sharp decrease in 2012. 6.4%
29.6% 27.5%
48.8% 6.0%
28.0% 7.9% 4.5%
9.2%
In 2019, REITS/ listed companies 34.7% 7.9%
GUANGZHOU KEY TRANSACTIONS
47.8%
41.8% 65.2%
accounted for 45.8% of the total
57.5%
36.0% 45.8%
35.1%
investment in major property 30.6%
transaction market in Guangzhou,
28.2%
59.2%
8.2%
while private buyers accounted for 47.3%
Table 8. Guangzhou Key Transactions about 24.2%. 34.2%
31.9% 33.9%
29.6%
25.3%
28.2% 24.2%
23.0% 21.9%
Deal Amount
Date 2Project Property type Buyer Seller In 2018-2019, the share of foreign 2010 2011 2012 2013 2014 2015 2016 2017 2018 2019 Q1 2020
RMB (Billion)
buyers’ investment value in Guangzhou
Note: Data for transactions of USD 2.5 million or more from 2010 to Q1 2020, excluding 'Other Buyer' in RCA
Baodexin Real Estate real estate investment market exceeded Source:RCA, Knight Frank Research
Jan 2018 Lok Feng Plaza Retail CapitaLand 3.34
Fund that of the 2015-2017 period. In 2019,
the investment value of foreign buyers
Guangzhou Yuetai
Aug 2019 Swan Bay Phase II Apartment Shimao Group 2.78 accounted for 25.4% of total investment
Group Co.,Ltd
value in the market.
Guangzhou Yuetai
Aug 2019 Jiasheng Project Apartment Shimao Group 2.49
Group Co.,Ltd Institutional buyers accounted for the
lowest share of investment value in
Yuexiu New Metropolis KaiLongRei Investment,
Dec 2018 Office Yuexiu REIT 1.17 Guangzhou major property investment
Building Guangzhou Metro
market in the past decade, at about 5%,
Headquarters Building, Guangzhou Jiankang Sports Modern Avenue and they had the 4.5% share in 2019.
Oct 2019 Office, Retail 0.97
Modern Avenue Culture Development Co., Ltd Group
Prosperity Interna- In Q1 2020, the transaction value of
Sep 2019 Oriental Wende Building Office, Retail Forchn Investment tional Holdings (H.K.) 0.54 institutional buyers, private buyers,
Limited foreign buyers and REITS/ listed in
Guangzhou major property transaction
Dalian Wanda Hotel and market accounted for 47.8%, 25.3%,
Jan 2018 Hotel, Office R&F Group Dalian Wanda 0.22
Office Asset Portfolio 18.6% and 8.2% respectively of the total
transaction value.
32 33China Commercial Real Estate Investment Market (June 2020) China Commercial Real Estate Investment Market (June 2020)
GUANGZHOU SELLER PROFILE
By transaction value, the segmentation
of sellers in Guangzhou real estate Fig 25. Seller composition of major property transaction market
investment market varies, with REITS/ in Guangzhou
listed companies and private sellers Private Seller REITS/Listed Company Institutional Seller Foreign Seller
accounting for 47.3% of the transaction
2.8%
6.9%
value of the investment market on 19.3%
average in the past decade. In 2019,
44.1% 44.6%
these 2 types of sellers accounted for 55.9%
36.9%
52.5% 56.8%
93.1% of the total. 69.1%
81.9%
88.6%
84.5%
6.3%
70.3%
4.5%
The share of foreign sellers varied 7.1%
8.4%
greatly, accounting for more than 80% 53.8% 56.2%
2.9%
of the sellers in 2012 and 2016, but also 44.6%
44.7%
37.1% 1.1%
accounting for only 2.8% of the sellers 9.1%
27.9%
34.7%
in 2010. Affected by the RMB exchange
17.0%
10.3% 11.4%
6.4%
2.2%
rate, foreign sellers only account for 2010 2011 2012 2013 2014 2015 2016 2017 2018 2019 Q1 2020
6.9% in 2019, down 37.7 percentage
Note: Data for transactions of USD 2.5 million or more from 2010 to Q1 2020, excluding 'Other Seller' in RCA
points YoY. Source:RCA, Knight Frank Research
In the past decade, institutional sellers
only sold the local projects in 2015,
2016 and 2018, accounting for 53.8%,
06.
1.1% and 6.3% of the total transaction
value of the sold projects in that year
respectively.
SHENZHEN
In Q1 2020, REITS/ listed companies INVESTMENT MARKET
and private sellers were active in the
major property transaction market,
their transaction value accounted for
88.6% and 11.4% respectively.
34 35China Commercial Real Estate Investment Market (June 2020) China Commercial Real Estate Investment Market (June 2020)
SHENZHEN ECONOMIC OVERVIEW SHENZHEN TRANSACTIONS –
13.43million 104.5 RMB578.5bn RMB153.3bn NUMBER
4.5% yoy 6.6% yoy 22.9% yoy
In the past ten years, the average
number of major property transactions Fig 27. Major property transactions in Shenzhen by number
Permanent Population Consumer Price Index Gross Domestic Product Total Retail Sales in Shenzhen real estate investment Transaction Number
(end 2019) (Q1 2020) (Q1 2020) Consumer Goods
market has reached 40 deals per year. In
(Q1 2020) 80
2011, 2015 and 2016 the number of major 72 72 75
property transactions exceeded 70. 60 58
RMB 17,129 RMB385.0bn 66.5% 16.1% yoy 44
3.9% yoy 1.8% yoy 40 39
In 2019, there were only 27 transactions
23 27
recorded, but still up by 22.7% YoY. 22
20
However, the average transaction value
8 3
per deal increased sharply by 44.5% YoY 0
Per Capita Disposable Added-value of Added-value of Tertiary Cumulative Growth in to RMB 0.64 billion. In Q1 2020, there 2010 2011 2012 2013 2014 2015 2016 2017 2018 2019 Q1 2020
Income (Urban) Tertiary Industry Industry as % GDP Fixed Asset Investment were three major property transactions
(Q1 2020) (Q1 2020) (Q1 2020) (Q1 2020) Note: Data for transactions of USD 2.5 million or more from 2010 to Q1 2020
recorded, with average transaction Source:RCA, Knight Frank Research
value RMB 0.17 billion per deal.
2.1% yoy 1.6% yoy RMB169.6bn RMB291.5bn
0.7% yoy 21.1% yoy
SHENZHEN TRANSACTIONS –
SECTOR BY VALUE
Real Estate Investment Foreign Direct Investment Value of Import Value of Export
(Q1 2020) (2019) (Q1 2020) (Q1 2020)
Source: Official Data
SHENZHEN TR ANSACTIONS – TOTAL
Office transactions accounted for more
than half of the total transaction value of Fig 28. Breakdown of major property transactions in Shenzhen
the major property investment market in by value
VALUE Shenzhen. However, since 2016, the share Office Industrial Retail Hotel Apartment
of office transactions had declined to about
RMB(Billion)
31.4%, which resulted in an increase in the
25
In the past decade, the transaction transaction value of retail and industrial
value in Shenzhen major property Fig 26. Major property transactions in Shenzhen by value property. From 2016 to 2018, retail and
20
transaction market continued to grow. Transaction Value industrial property accounted for about
In 2017, the total transaction value 41.1% of the total transaction value in the
RMB(Billion) 15
exceeded RMB 20 billion, stood at market.
25
around RMB 22 billion.
22 10
In 2019, retail property transactions
20
In 2019, the transaction value was about accounted for 45.1% of the total value of
17 17 5
RMB 17 billion, rose sharply 77.3% major property transactions, offices for
15
YoY, as the second highest transaction 39.7% and industrial properties for 14.9%. In 0
value in the past decade. In Q1 2020, 11 11
10 2019, the total value of retail and industrial 2010 2011 2012 2013 2014 2015 2016 2017 2018 2019 Q1 2020
the transaction value was about RMB 1 10
property transactions accounted for 60%
billion. Note: Data for transactions of USD 2.5 million or more from 2010 to Q1 2020
6 of the transaction value in Shenzhen major Source:RCA, Knight Frank Research
5 4
3 property market. In Q1 2020, only industrial
1 property was recorded for transaction, with
1
0 transaction value of about RMB 1 billion.
2010 2011 2012 2013 2014 2015 2016 2017 2018 2019 Q1 2020
Note: Data for transactions of USD 2.5 million or more from 2010 to Q1 2020
Source:RCA, Knight Frank Research
36 37China Commercial Real Estate Investment Market (June 2020) China Commercial Real Estate Investment Market (June 2020)
SHENZHEN TRANSACTIONS - Date 2Project Property type Buyer Seller
Deal Amount
RMB (Billion)
SECTOR BY NUMBER Jul 2019
Asset Portfolio of Private Industrial, Office, China City Infrastructure Group
Investor Retail Limited
Private Seller 0.70
Temei Toy Industrial
Dec 2018 Industrial Eduardo Asset Management Temei Toy 0.68
Since 2016, owing to the decline in Mixed-use Project
the number of office transactions, Fig 29. Breakdown of major property transactions in Shenzhen
by number Building B, Yitian Yike
the number of major property Dec 2019 Office A-share Listed Company Yitian Group 0.60
Building
transactions in Shenzhen has decreased Office Industrial Retail Hotel Apartment
significantly. The average transaction 80 Xicheng Construction
Haowei Toy Industrial
number of industrial properties in Sep 2019 Industrial EEKA Fashion Investment Holding 0.59
Mixed-use Project
from 2017 to 2019 was about 28, which 70 Group
was almost consistent with the average
transaction number of offices in the 60 Note: The major property transaction amount is for the past 24 months and calculated in terms of the actual transaction value.
The order of the transaction list is sorted by transaction value
three years.
Source: RCA, Knight Frank Research
50
In 2019, retail properties accounted for
40
37% of the transaction number of major
property market in Shenzhen, as well as
SHENZHEN BUYER PROFILE
30
offices for 37% and industrial properties
for 22.2%. In Q1 2020, only three 20
industrial properties were sold.
10
By transaction value, private buyers in
the major property investment market Fig 30. Buyer composition of major property transaction market
0
in Shenzhen accounted for about 30.2% in Shenzhen
2010 2011 2012 2013 2014 2015 2016 2017 2018 2019 Q1 2020 of the total investment value in the past Private Buyer REITS/Listed Company Institutional Buyer Foreign Buyer
Note: Data for transactions of USD 2.5 million or more from 2010 to Q1 2020
decade, while REITS/ listed companies
Source: RCA, Knight Frank Research
accounted for about 26.8%. 10.6%
17.4%
17.9%
25.1%
11.3% 35.1%
3.0% 33.8% 34.9%
35.9%
In 2019, REITS/ listed companis 15.2%
49.8%
12.9%
accounted for 12% of the total 7.3% 9.3% 8.3% 69.5%
SHENZHEN KEY TRANSACTIONS
17.7% 80.0%
investment value in major property 43.6%
25.7%
20.4%
60.0% 2.1%
transactions market in Shenzhen, while 29.5%
16.7%
33.3%
private buyers only accounted for about 9.6%
25.5%
49.6% 4.7%
13.8%. 41.6%
12.0%
34.5%
Table 9. Shenzhen Key Transactions
30.9%
27.3% 38.9% 22.6% 23.5%
19.0% 20.0%
The investment value of foreign buyers 13.8%
Deal Amount accounted for an average of 33% in the 2010 2011 2012 2013 2014 2015 2016 2017 2018 2019 Q1 2020
Date 2Project Property type Buyer Seller
RMB (Billion) market over the past decade, but that
Note: Data for transactions of USD 2.5 million or more from 2010 to Q1 2020, excluding 'Other Buyer' in RCA
rose to about 69.5% in 2019 Source:RCA, Knight Frank Research
Shenzhen Overseas
Shenzhen OCT Tower
Apr 2019 Office China Life Chinese Town Co., 12.00
(60% of equity) Institutional buyers accounted for an
Ltd.
average of about 10% of total transaction
T2 Building, China China Resources value in Shenzhen market over the past
Dec 2019 Office CITIC Prudential Life 8.00
Resources Qianhai Plaza Land Qianhai Co., Ltd decade, falling to about 4.7% in 2019.
Link Real Estate Investment Prudential Financial,
Mar 2019 Yijing Central Walk Retail 6.60 In Q1 2020, only foreign and private
Trust Yijing Group
buyers were active in the major property
Shenzhen Yilian Technology transaction market in Shenzhen.
Dec 2018 Olympus Shenzhen Factory Industrial Olympus 1.84
Co., Ltd Their investment value accounted for
80% and 20% of the total transactions
Building 4&5, Taiziwan China Merchants
Jul 2019 Office Local Organization 1.50 respectively.
Business Building Group
Dec 2019 Building B, Haifu NO.1 Office Juncheng Holding Group OCT Binhai Company 1.00
38 39You can also read


