The impact of world crude oil price on the liberalisation of Malaysia's paddy industry
←
→
Page content transcription
If your browser does not render page correctly, please read the page content below
GEOGRAFIA OnlineTM Malaysian Journal of Society and Space 14 issue 4 (308-321)
© 2018, e-ISSN 2680-2491 https://doi.org/10.17576/geo-2018-1404-25                          308

    The impact of world crude oil price on the liberalisation of Malaysia’s
                              paddy industry
                                           Siti ‘Aisyah Baharudin

                           School of Social Sciences, Universiti Sains Malaysia

                    Correspondence: Siti ‘Aisyah Baharudin (email: sab16@usm.my)

Abstract

Malaysia has adopted an open economy policy to boost its economic growth and per capita
income. As a small and open economy, the country is susceptible to external shocks such as
the 2008 financial crisis. Moreover, the increase in the international food price and the
shortage of food in early 2008 imposed a new challenge to the national paddy sector. Besides,
the increase in average world crude oil prices from USD 69.08 per barrel in 2007 to USD
101.56 per barrel in 2009 saw accompanied escalation in world food commodity prices,
resulting in increases in input costs and hence the cost for food production. This paper
examines the impact of the world crude oil price on the liberalisation of Malaysia’s paddy
industry using system dynamics analysis. The two types of inputs impacted by crude oil price
are fuel and fertiliser price. The results showed that 120 litre per hectare of diesel and petrol
is the rate of fuel used in paddy production. The fertiliser consumption is 388.53 kilogram per
hectare. The removal of fuel subsidies accompanied by the increase in the world crude oil
prices significantly impacts farmers’ income and productivity levels as it triggers higher
production expenses. The simulation results of the policy suggest that the subsidy
rationalisation programme will free up more funds for product development such as precision
farming technology as well as increased farm practices by farmers.

Keywords: crude oil price, farmers’ income, machinery cost, paddy industry, productivity,
system dynamics

Introduction

Farmers’ income and paddy productivity play a vital role in the paddy and rice industry, as
both determine the performance of the industry and the welfare of farmers. The national
average productivity in 2016 was 4.1 tonnes per hectare, which was lower than Malaysia’s
most productive plots that typically gave more than 7 tonnes per hectare (FAO, 2018). There
are 296,000 paddy farmers in Malaysia of whom 40% are full-time farmers who rely on
paddy activity as their primary source of income (Man & Sadiya, 2009). Since 2005, the total
income from paddy production has increased by 39.8%. Meanwhile, the total income of
paddy farmers equals MYR 1,990. MYR 1,340 of it is the average monthly income from
paddy production, and the balance of MYR 550 is obtained from other income-generating
activities. Although the total income of paddy farmers is higher than the national poverty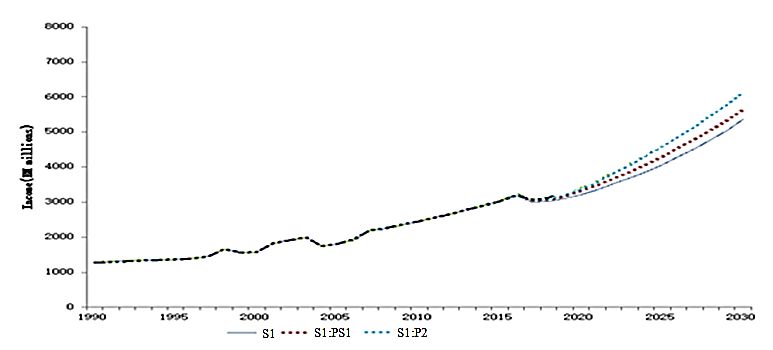
GEOGRAFIA OnlineTM Malaysian Journal of Society and Space 14 issue 4 (308-321)
© 2018, e-ISSN 2680-2491 https://doi.org/10.17576/geo-2018-1404-25                         309

level of MYR 750 per month, paddy farmers still have high poverty levels compared to
farmers in other agricultural sectors (Rabu & Shah, 2013). A recent study conducted by Idris
and Siwar (2017) showed that 40% of the farmer population is within the lowest level of
income with an average salary of MYR 1,440 per month.
         Effective use of inputs increases paddy productivity, and optimum production costs
increase farmers’ income. These two factors reflect the essential role of the efficient
utilisation of fuel and fertiliser in paddy production. In agriculture, fuel and fertiliser are
referred to as energy. Fuel is used to run machinery and transportation, while fertiliser is for
improving soil fertility. Agriculture scholars distinguish two kinds of energy as direct and
indirect energy. Direct energy is used in the form of fuel, electricity and human labour.
Meanwhile, indirect energy is required mainly in the production and application of mineral
and chemicals fertilisers to improve crop yields (Bundschuh & Guangnan, 2014).

Fuel allocation

Although farmers in Malaysia are not entitled to fuel subsidies compared to what the
fishermen are granted, they enjoy the benefits of RON95 petrol and diesel subsidies allocated
to all Malaysian citizens. Malaysia introduced the diesel subsidies in October 1999 and
RON95 subsidy in June 2005. The total government expenditure for providing fuel subsidy
has increased from MYR 28 million in 1993 to MYR 7,337 million in 2010 as shown in
Figure 1. In 2009, Malaysia’s fossil fuel subsidies per capita were the world’s third highest
by spending USD 199.6 per person behind Brunei at USD 804.1 and Russia at USD 274.3.

                  Source: ECM, 2011

                        Figure 1. Total expenditure (MYR) in fuel subsidy (1993-2010)

      In 2012, Malaysia’s fuel price took the eighth lowest place in the world with a fuel
subsidy of MYR 23.7 billion. In 2013, the government subsidised RON95 petrol by MYR
0.83 per litre and diesel by MYR1.00 per litre, which cost MYR 24.8 billion. In September of
the same year, the government implemented a fuel subsidy rationalisation policy to reduce
bulk subsidies in stages and fuel price fixation through market forces. Recently, the
government incurred a subsidy of MYR 0.33 per litre for RON95 petrol and diesel based on
crude oil prices at MYR 3.97 per litre (Bernama, 2018).

Fertiliser allocation

Farmers in Malaysia receive fertiliser subsidy in the form of a compound, urea and additional
fertiliser NPK (Nitrogen, Phosphorous and Potassium). The recommended time for each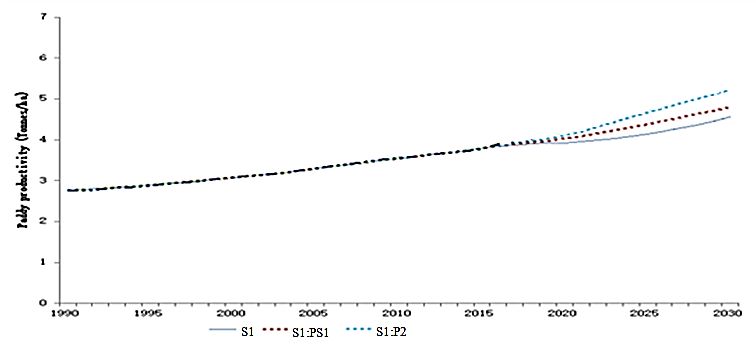
GEOGRAFIA OnlineTM Malaysian Journal of Society and Space 14 issue 4 (308-321)
© 2018, e-ISSN 2680-2491 https://doi.org/10.17576/geo-2018-1404-25                                           310

fertiliser is explained in Table 1. Paddy Statistics of Malaysia showed that 28% of farmers
had applied organic fertiliser. While, besides the subsidised fertilisers, 14% of farmers had
used additionally purchased fertilisers at the rate of 173 kilograms per hectare for an average
of 67 days after seeding (DAS).

                    Table 1. The average fertiliser rates (kilogram/hectare) of paddy in Malaysia

 Fertiliser               1st application                            2nd application                       Total
               Average day          Average rate             Average day       Average rate            Average rate
               (DAS)            (kilogram/hectare)             (DAS)       (kilogram/hectare)       (kilogram/hectare)
 Compound          19                   232                      50                118
 Urea              35                   98.8                     60                77.3
 NPK               57                  137.1                     65                75.4
 Total                                 467.9                                      270.7                   738.6
Source: MoA, 2013

                        Source: FAO, 2018 and MoA, 2013

              Figure 2. Domestic fertiliser subsidy (MYR) and World fertiliser (USD/MT) (1980-2012)

The government played a role in providing fertiliser subsidies so that farmers were not
adversely affected by an uncertain increase in world oil prices. Total expenses for fertiliser
subsidy given by the government showed volatile trends from 1980 to 2012. Fertiliser
subsidy expenditure in 1980 was MYR 150 million and dropped to MYR 132 million in
1984. However, the fertiliser subsidy expenditure began to increase in 1985 from MYR 139
million to MYR 146 million in 2000. In 2008, the fertiliser subsidy expenditure decreased to
MYR 137 million due to the global economic crisis, which had adversely affected the
economic growth of Malaysia. Currently, the government continues to subsidise fertiliser in
the form of a kilogram per type of fertiliser to farmers.

World crude oil price

Like prices of other commodities, crude oil prices experience wide price swings during
supply shortage or oversupply. The crude oil price cycle may extend over several years
responding to changes in demand as well as Organisation of the Petroleum Exporting
Countries (OPEC) and non-OPEC supply. OPEC was established in 1960 with five founding
members; Iran, Iraq, Kuwait, Saudi Arabia and Venezuela. One of the most critical factors
determining the price level was petroleum inventories in the United States of America (USA)
and other consuming countries.
       Figure 3 shows that there is a long-run relationship between crude oil prices and
GEOGRAFIA OnlineTM Malaysian Journal of Society and Space 14 issue 4 (308-321)
© 2018, e-ISSN 2680-2491 https://doi.org/10.17576/geo-2018-1404-25 311
fertiliser prices. World fertiliser prices had increased in tandem with rising crude oil prices.
Sanyal and Kaplan (2015) suggested that the increase in crude oil prices will increase
fertiliser prices as well as farming cost. Abdul Rahim and Zariyawati (2011) founded that
there is a relationship between crude oil prices and long-term rice prices through the
increased production costs. Farmers’ production costs are directly influenced by the price
variation, agriculture equipment (machinery) and input usage. On average, paddy production
cost takes up about 85% of the paddy price. The share of fuel cost is 12.5% of the total paddy
production cost, but the fertiliser cost is about 40% (currently subsidised by the government)
will be affected by the fuel increase indirectly (MADA, 2013).
Production costs have a negative relationship with government subsidies. For
example, increase in crude oil at USD 60 per barrel in 2003, the government required to
subsidise about MYR 8.27 of the petrol retail price to maintain the then-price level (Saari et
al., 2008). Meanwhile, the allocation for fertilisers in paddy production is the highest at 76%
(MYR 949 per hectare) of the total subsidy (MYR 1,249 per hectare). The direct costs
incurred by farmers were 73%, while the government accommodated 37% for owner
category and 20% for tenant category from total production costs (MADA, 2013).
Source: Gusev, 2018
Figure 3. World crude oil price, fertiliser price and rice price (2017-2030)
Based on the aforementioned discussion, we found that fuel prices are directly
impacted by the world crude oil prices, and fertiliser prices are indirectly impacted by the
world crude oil prices. Although the 2008 global food crisis had no direct impact on
Malaysia, the government should take the initiative to overcome the shortcomings of the
country's rice sector as rising production costs, inadequate use of inputs, competition for
resources and climate change (Mat & Othman, 2014). This brings the question of what are
the impacts of the removal of fuel subsidy with the increase in world crude oil price on both
paddy productivity and farmers' income?
Methods
System dynamics (SD) is a decision-making process that involves the dynamics phenomena
resulted from the interaction of the physical structures and decision-making structures. The
physical structure is formed by the accumulation and flow network of people, goods, energy
and materials. The decision-making structure is formed through the accumulation and
information flow network used by actors in the system that describes the rules of theirGEOGRAFIA OnlineTM Malaysian Journal of Society and Space 14 issue 4 (308-321)
© 2018, e-ISSN 2680-2491 https://doi.org/10.17576/geo-2018-1404-25 312
decision-making processes. Input-output analysis, social accounting matrix and econometrics
are among the methods included in SD. This method is capable of identifying the problem,
formulating and assessing policy, as well as participating complementarily or inclusively
(Forrester, 1992).
This study utilised both primary and secondary data. Secondary data include
published materials and reports in Malaysia from 1990 until 2016. The reports include
Malaysia Economics Statistics, Paddy Statistics, Statistics of MADA and Malaysia Plan.
Primary data were collected through the distribution of purposely-structured questionnaires
and in-depth interviews with machine suppliers and farmers. The purpose of the interview
with machine suppliers is to acquire the machinery data. The interview with the farmers was
aimed to obtain fertiliser consumption data. The variables used include fuel and fertiliser
consumption per hectare and cost (MYR per hectare). The survey was carried out in selected
granary area Muda Agriculture Development Authority (MADA) in Kedah for the paddy
production season in 2018.
The research hypothesis suggested that the production cost will increase as a result of an
increase in the world crude oil and fertiliser prices. The increase in production cost will
reduce the use of allocated inputs and paddy productivity. Lower productivity and inefficient
use of input will decrease farmers’ income. Besides, if global crude oil price continues to rise
without fuel and diesel subsidies provided by the government, farmers will not be able to
improve their productivity due to the increase in input material expenses. Government
decisions are treated as exogenous policy and government is not permitted to engage in any
deficit spending except as an explicit policy.
Productivity model
From the production side, paddy production is a function of productivity. The production
sector in the model represents paddy as an output produced by the farm. Determining the
output is the core of the production section in every industry, and the characteristics of the
production function are critical in determining the behaviour of the model. The calculation of
production is explained in equation (1).
Paddy production=(Paddy area * Actual productivity) * (1-Paddy loss) (1)
Actual productivity per hectare is defined by the average of paddy production (tonnes)
and paddy area (hectare). Actual productivity is a function of four effects, which consist of
land fertility, allocated input, farm practices and technology on paddy production. Paddy loss
during harvesting activity occurs consistently in paddy production. Paddy losses are due to
the poor condition of machines, poorly trained combine operators, crop conditions – lodging,
too easy-shattering varieties and poor field conditions due to late water removal and field
with no hard-pan. Paddy loss is estimated to be at 285.4 kilograms per hectare or 7.2% of
productivity (Jafni et al., 2010).
Meanwhile, allocated input refers to fertiliser usage in paddy production. The
resources of fertiliser are based on subsidy and allocation by the farmers. The rate of fertiliser
usage by the farmers is at 0.38 tonnes per hectare (Ramli et al., 2012). Farmers also used
additional fertilisers purchased at the rate of 0.17 tonnes per hectare. The rate shows that the
maximum allocated input by the farmers is 33% compared to allocated input from subsidy at
70% of the optimum input required (MoA, 2013). Allocation for input by the farmers is based
on desired input in the paddy field. Allocation for input will affect the land fertility. If land
fertility is equal to one, paddy productivity can be achieved. However, if land fertility is less
than 1, productivity will be reduced.GEOGRAFIA OnlineTM Malaysian Journal of Society and Space 14 issue 4 (308-321)
© 2018, e-ISSN 2680-2491 https://doi.org/10.17576/geo-2018-1404-25 313
Income model
Generally, there were three sources of income for farmers – from revenue of paddy
production and non-paddy production. Figure 4 shows farmers’ income behaviour in
Malaysia. Farmers’ income is a function of paddy production, expenditure (production cost)
and paddy price. However, due to the fixed paddy price by the government, income consists
of output and cost (Amin, 1989). Farmers’ income is one of the objectives of government
policy. Guaranteed Minimum Price (GMP) and paddy price subsidy are also included in the
sub model of farmers’ income. The GMP represents paddy farmers prices and maintains the
price level above the world standard price. Effective price refers to if domestic paddy price
below than GMP, the farmers will receive GMP. Government support price and input are
policy tools to achieve SSL targets. Currently, farmers receive a paddy price subsidy of MYR
248.10 per every tonne of paddy sold as the GMP is at MYR 750 per tonne (MADA, 2013).
Hence, income consists of revenue from paddy sold, paddy price subsidy and income from
non-paddy production as in equation (2).
Income = Revenue from paddy price subsidy + Revenue from paddy sold + Income from
paddy production (2)
Initial farmer cash
Farmers
Income cash
Expenditure
Effect of cash
Cash availability availability for
Average income
expenditure
Time to average
income Desired cash Table of the effect of cash
Desired expenditure for availability for expenditure
Time to desired
non paddy production
cash
Average desired Time to averaging
expenditure expenditure
Fraction of consumption
for non paddy production
Desired Potential cash
expenditure allocation
Allocation for paddy Allocation for non
production paddy production
Figure 4. Stock and flow diagram (Farm cash)
Each farmer strives to keep their money in balance. Money balance represents
farmers’ cash to meet their expenditure as in equation (3). The ratio of actual to desired cash
measures the farmers’ cash availability. If cash availability drops, payments are reduced to
bring total expenditure in line with revenues, and vice versa. To get the effect of cash
available on expenditure, we have to model the desired expenditure and cash availability.
Farmers cash = Income - Expenditure (3)
Availability concept (cash availability) is equal to the farmers’ cash/desired cash. If the
availability is more than 1, then the farmers are believed to own the desired cash level. The
farmers can deliver their stock based on demand required. However, if the availability is less
than 1, the farmers are believed not to have the desired cash level. The percentage of income
from paddy activity is 60% of total income (Hashim, 1998).GEOGRAFIA OnlineTM Malaysian Journal of Society and Space 14 issue 4 (308-321)
© 2018, e-ISSN 2680-2491 https://doi.org/10.17576/geo-2018-1404-25 314
Results and discussion
Two analyses have been utilised to study the impact of the world crude oil prices on the
paddy sector towards liberalisation. The first analysis attempted to calculate the cost of fuel
and fertiliser used based on machinery and transportation costs. While the second analysis is
a simulation of system dynamics to study the impact of the removal of fuel subsidy with the
change in world crude oil prices.
Fuel and fertiliser cost
Mechanisation in paddy cultivation has been widely used in the MADA area to accelerate the
paddy production activity. Among the machines rented by farmers are Kubota, tractor and
combine harvester as shown in Table 2. The cost of paddy mechanisation increases due to
equipment maintenance cost and fuel price factors.
Table 2. The rate of machinery used per season in paddy production (2018)
Stages Activity Inputs Model Duration time The Life-
(hour/hectare) weight of long
machine (year)
(kilogram)
Land Cut stable Tractor 4W New 1.4 450 8
preparation Holland
Plowing Tractor 2W New 1.4 2380 10
Holland
Levelling Power tiller Dongfen 1.4 488 8
Planting Direct seeding Blower Maruya 1.4 20 5
ma
Crop Cleaning of Bush cutter Tanaka 2.8 4.1 5
Management field
boundaries
Pesticides Sprayer Maruya 0.7 10 5
spray ma
Weed Bust Cutter Tanaka 2.8 4.1 5
Harvesting Harvest Combine New 1.4 12000 10
harvester Holland
Source: Interview with machine supplier, MADA
Crop management activities show a longer usage time of 6.3 hours per hectare followed
by land preparation activity of 4.2 hours per hectare. However, the amount of time used
varies according to the type of paddy land. Most of the machines are purchased second-hand
from suppliers. The company renovates machines depending on their usages and soil types.
For instance, ploughing tractor tyres are replaced with track because of the severe soil
condition. Each machine is upgraded with equipment on demand. The process is done by the
company.
Table 3. Machinery wages rate and fuel cost (MYR/hectare) in MADA (2018)
Types Kubota Tractor (3W) Tractor (4W) Combine Truck
harvester
Wages rates (MYR/hectare) 150 200 260 320 MYR45 /
kilogram
Fuel Cost (MYR/hectare) 20 35 45 50 MYR20/Trip
Price (MYR) 45,000 75,000GEOGRAFIA OnlineTM Malaysian Journal of Society and Space 14 issue 4 (308-321)
© 2018, e-ISSN 2680-2491 https://doi.org/10.17576/geo-2018-1404-25 315
Maintenance 2,000 5,000 5,000 10,000
(MYR/season)
Source: Interview with machine supplier, MADA
The portion of cost per hectare for combined harvester rental price in the MADA area is
about MYR 320 per hectare including; (i) management charges (MYR 14), (ii) machine
supplier (broker) charges (MY R58), (iii) diesel cost (MYR 50-60), iv) driver salary (MYR
58) and (v) machine supplier profit (MYR 100-130). Most of the machines are in good
condition for three to four seasons’ use. The machine is underutilised due to concerns about
possible damages. Maintenance service is done once for every season. Broken machines are
repaired at MYR 360. Tractors are rented from MADA and wages for the worker are paid
daily. The endurance of this tractor depends on the engine. A truck is used to deliver paddy
that has been harvested from the paddy field to the rice mill.
Table 4 shows the fuel consumption rate and costs involved in paddy production. The
rate of fuel in the includes diesel and petrol used by paddy machinery. Land preparation
activities show the highest utilisation rate of 45 L per hectare with a production cost of MYR
98.10 per hectare. The high utilisation rate is due to the use of the tractor for ploughing and
land levelling. Meanwhile, based on Table 5, the paddy cultivation process consists of a total
of 3-4 cycles of fertilisation of N, P2O5, K2O manure and (organic). The amount of fertiliser
used in the MADA area is 388.53 kg/hectare with the highest N content totalling to 137.04
kg/hectare, followed K2O (111.6 kg/hectare), P2O5 (82.33 kg/hectare), and manure (57.56
/hectare). The rate of manure is still low among farmers. This is influenced by the supply of
subsidised fertiliser.
Table 4. Rate (L/hectare) and cost (MYR/hectare) of fuel per season in paddy production (2018)
Stages Activity Inputs Fuel Rate (L /hectare) Cost (MYR/hectare)
Land 1st Tillage Tractor 4W Diesel 15 32.70
preparation nd
2 Tillage Tractor 2W Diesel 15 32.70
Leveling Power Tiller Diesel 15 32.70
Total 45 98.10
Planting Direct seeding Blower 20kg Petrol 6 13.2
Crop Fertiliser Sprayer 20L Petrol 8 17.60
management Pesticides Sprinkle 20L Petrol 8 17.60
Weeding Bust Cutter Petrol 16 35.20
Total 32 70.40
Harvesting Harvest Combine harvester Diesel 30 69.76
Transportation Petrol 7 15.40
Total 120 266.86
Notes: Price of diesel = MYR 2.18 per L. Price of petrol = MYR 2.2 per L
Table 5. Rate of fertiliser used (Kilogram/hectare) per season in paddy production (2018)
Activity Elements Composition (Rate/re) Rate (kg) Rate (kg/hectare)
1st Fertilising Nitrogen (N) 17.5 16.28 46.85
Phosphorus (P2O5) 15.5 14.42 41.5
Potassium (K2O) 10 9.3 26.76
Total 115.11
2nd Fertilising Nitrogen (N) 17.5 12.21 35.14
Phosphorus (P2O5) 15.5 10.81 31.11
Potassium (K2O) 10 6.98 20.09GEOGRAFIA OnlineTM Malaysian Journal of Society and Space 14 issue 4 (308-321)
© 2018, e-ISSN 2680-2491 https://doi.org/10.17576/geo-2018-1404-25 316
Manure - - 14.39
Total 100.73
3rd Fertilising Nitrogen (N) 17 12.75 36.69
Phosphorus (P2O5) 3 2.25 6.47
Potassium (K2O) 20 15 43.17
Manure - 28.78
Total 115.11
4th Fertilising Nitrogen (N) 17 6.38 18.36
Phosphorus (P2O5) 3 1.13 3.25
Potassium (K2O) 20 7.5 21.58
Manure - 14.39
Total 57.58
Total 388.53
Source: Interview with the farmer, MADA
Simulation of system dynamics
As a result in fuel and fertilisers section, changes in the world oil prices will directly
impact the cost of fuel used by machines. In addition, it will indirectly impact the fertiliser
costs because a significant share of the fertilisers used is imported chemical fertilisers.
Furthermore, the data will be used for the simulation of system dynamic models. The model
validity is usually carried qualitatively and informally. System dynamics become confident in
the models when they see the replication of historical records on model simulations. The
starting point of the model is 1990, which provides two decades of simulated historical
experience. Comparison of simulated and actual behaviour establishes the model’s ability to
capture trends and turning points in essential quantities.The behaviour of the model between
1990 and 2016 is compared to the actual performance of the paddy industry. The model
captures major trends and turning points in important economic events with an error tolerance
generally under 15%. The simulated behaviour of the economy is then presented to 2030.
Actual data are based on a dataset collected by the Department of Statistics. Meanwhile,
simulation data is illustrated by the equation for important variables involved in paddy
production.
Paddy production Domestic Fuel Price
(Million tonnes) (RM/liter)
Figure 5. Simulation vs actual behaviour for selected variables (1990-2012)
Table 7. Error analysis of the paddy productivity model
Variable (RMSPE) R2 Theil Inequality Statistics
(%) Mean (U )m
Deviation (Us) Covariation (Uc)
Paddy productivity 4.71 0.78 0.40 0.03 0.57GEOGRAFIA OnlineTM Malaysian Journal of Society and Space 14 issue 4 (308-321)
© 2018, e-ISSN 2680-2491 https://doi.org/10.17576/geo-2018-1404-25 317
Errors of unequal variation can be corrected by incorporating a theory of the missing
cyclic behaviour in the model. The mean square error (MSE), root-mean-square-per cent
error (RMSPE) and Theil inequality statistics are used to quantify the magnitude and nature
of the errors. RMSPE measures the average per cent difference between simulated and actual
values. Because the per cent error is squared, a single large error counts more heavily than
two smaller errors with the same magnitude (Sterman, 2004). For this model, a value of less
than 10% represents a lower error between the simulated and historical data. The RMSPE for
paddy productivity is of a smaller value (4.71%) showing that the model variables are in the
right direction.
Model validation involves examining the ‘robustness’ of the model under extreme
policies, shocks and extreme values of parameters. The model should be robust in extreme
conditions, which means the behaviour of the model should exhibit realistic results even
under extreme values for the input. The model is simulated without any change known as
‘business as usual’ (BAU) to predict behaviour based on historical data. Meanwhile, a
scenario is defined as the changing of structure, whether through parameter, value or both to
check sensitivity and predict the outcome.
Based on the baseline scenario, we initially test the model under an extreme
condition. In this case, the extreme condition refers to a scenario (S1) simulating removal of
fuel subsidy with a change in world crude oil prices. The fuel subsidy is set at 0 in 2018 and
remains constant until 2030. Based on historical behaviour, world crude oil prices increase
over time. At the same time, the liberalisation of the paddy sector needs to consider the rising
crude oil price factor for the industry to be competitive in the world market. The world bank
estimates that oil price will continue to increase to reach USD 70 per barrel in 2030 compared
to USD 52.8 per barrel in 2017. Meanwhile, Canada Energy Board estimates an increase of
32.5% in crude oil price from 2017 to 2030 (Gusev, 2018). Using these statistics, this
simulation for world crude oil price is expected to increase by 50% in 2018 until 2030.
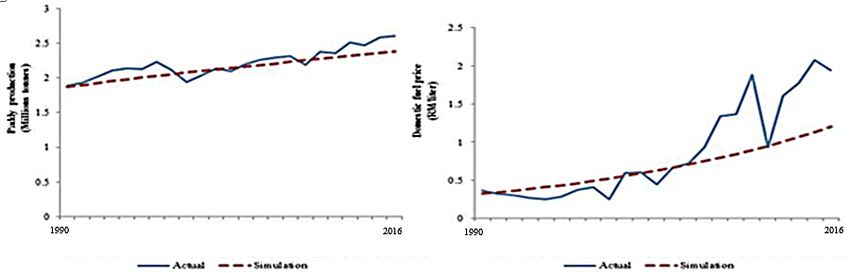
Income (RM millions)
Figure 6. Simulation behaviour for farmers’ incomeGEOGRAFIA OnlineTM Malaysian Journal of Society and Space 14 issue 4 (308-321)
© 2018, e-ISSN 2680-2491 https://doi.org/10.17576/geo-2018-1404-25 318
Paddy productivity (Tonnes/ha)
Figure 7. Simulation behaviour for paddy productivity
Removal of fuel subsidies with the increase of world crude oil prices will affect
productivity level and farmers’ income, as shown in Figures 6 and 7. The simulation results
of S1 shows a declining trend in the farmers’ income by 18% over time because of the
reduced farm cash by 10.1%. The machinery expenditure increased by 2.5% in 2030, as it is
the multiplication of fuel price and average unit of fuel consumption. When the machinery
cost goes up, the paddy production cost will also rise. It is noted that the increment is small in
magnitude at 1.3%, as we assume the other production costs are kept constant. The only
variation comes from the increase in machinery cost. Fuel prices also indirectly affect the
price of fertiliser. With a 1% increase in world crude oil price, the fertiliser price will increase
by 3.4% (Siti 'Aisyah Baharudin et al., 2016).
The indirect effect is higher than the direct impact on paddy productivity. Therefore,
rising fuel prices will increase the price of fertiliser and ultimately affect farmers' expenses by
45%. Less fertiliser usage will cause a drop in productivity by 10.2% because there is a direct
relationship between these two variables. Interestingly, Saari et al. (2008) argued that the
primary product is one of the affected sectors due to a 90% petroleum price increase and
given that there is no government intervention in fuel price.
Policy implication
The model is satisfactory for validation purposes when the models operate reasonably under
extreme conditions. However, these criteria are indefinite and lead to quick conclusions.
Therefore, in constructing a model for policy analysis using the system dynamics
methodology, the model has to reflect the way decisions are made in the system (Forrester,
1992). To improve the simulation behaviour in the future, researchers need to design a better
strategy and formulate superior policy implementation. The goal will be realised through the
implementation of the right strategy to achieve a higher productivity level. The strategy is a
plan of actions to achieve a particular purpose and often implemented through programs. The
program is realised by executing activities according to the conditions and time.
Policy scenarios are set by the model structure (including the current policy,
government actions and exemplary actions from other countries) and parameters. Policy
analysis is run under two policy scenarios. The model is simulated with the removal of fuel
subsidies, and world crude oil price is expected to increase by 50% known as Base Run (S1)
which began in 2018. Policy scenario 1 (PS1) examines the implications of BAU with the
implementation of improved farm practices. On the other hand, the second scenario (PS2)
examines the impact of precision farming technology.GEOGRAFIA OnlineTM Malaysian Journal of Society and Space 14 issue 4 (308-321)
© 2018, e-ISSN 2680-2491 https://doi.org/10.17576/geo-2018-1404-25 319
Income (RM millions)
Figure 8. Policy simulation for farmers’ income
Paddy productivity (Tonnes/ha)
Figure 9. Policy simulation for paddy productivity
Improvement in farm practices is known as scoring specific production practices. Based
on the survey conducted in the MADA area, it is evident that the farmers need to improve or
change the current practices to minimise over usage of chemical input, extensive use of
chemical pesticide control and attitude towards other farmers in terms of sharing water
sources and information about paddy planting. Good farm practices refer to the optimum
level of input usage and farmers’ attitude in generating paddy yield. The checklist of paddy
planting or ‘Rice Check’ acts as a guide to the management of paddy planting to abide by the
targeted production goal. The primary purpose is to ensure smooth growth of the paddy plant,
which is geared towards high paddy productivity.
Best proposed practices include i) use of organic fertiliser and pesticides, ii) proper
timing for land preparation activity until the paddy is transferred to millers, and iii) adequate
frequency of chemicals input. Current practice is set as 30%, while the maximum best
practice is set at 100% based on the previous study. Improvement in farm practices seems like
an excellent way as it does not inflict any additional cost but only requires a change in the
attitude among the farmers themselves. It can be implemented through a proclamation by
institutes such as PPK, MADA and other agencies. These agencies could help promote a
better understanding of good farm practice and amicable communication among farmers. The
simulation PS1 shows that paddy productivity increases by 16.2 %.GEOGRAFIA OnlineTM Malaysian Journal of Society and Space 14 issue 4 (308-321)
© 2018, e-ISSN 2680-2491 https://doi.org/10.17576/geo-2018-1404-25 320
Based on the survey in the MADA area, we found that the agricultural machinery
suppliers have modified most of the machines used by paddy farmers. Most of the farmers
use large second-hand machines. Unfortunately, such machines cause inefficient consumption
of energy, fuel and time. Therefore, this study suggests expanding the use of precision
farming among the farmers. Precision farming refers to the management of paddy plantation
related to spatial and temporal information introduced by the Malaysian Agricultural
Research and Development Institute (MARDI) to manage paddy fields using modern
technology. Another benefit of the technique is the low cost it incurs to develop a digital field
plot map using rapid field plot digitising based on images collected from commercial remote
sensing satellite or aerial images. Developed countries such as South Korea and Japan have
demonstrated how technological advancements have helped in increasing their agricultural
productivity and cater to the needs of their population. This simulation result of PS2 indicates
an increment in productivity by 40% within the 12 years of implementation from 2018.
Conclusion
The impact of higher world crude oil prices can be traced through direct and indirect impacts.
The direct impact is the increased fuel cost and machinery rental that influence farmers’
income. Due to the change in fuel price, production cost also increases as the share of fuel is
only about 5%, and we assume that other production costs are kept constant. On the other
hand, the indirect impact is the increased fertiliser cost and decreased fertiliser consumption
that influences paddy productivity. The circumstance leads to a reduction in farmers’ cash
flow. Given the increase in the petroleum price, this exerts pressure on profit margins. For the
farmers, their welfare declines since they have to pay higher production costs to produce
paddy. Therefore, besides making decisions on paddy price subsidy and fertiliser subsidy, the
government also has to pay special attention to its effect from the increase in world crude oil
prices to machinery rental. A comprehensive study must be carried out to ensure the
government policymakers have sufficient information before making decisions.
Acknowledgement
This research was fully funded by Short-Term Grant, Universiti Sains Malaysia (USM)
(304/PSOSIAL/6315147).
References
Abdul Rahim, A.S., & Zariyawati, M.A., (2011). Causal effects of world crude oil prices on
the prices of rice and soybean oil: An ardl approach. Pertanika Journal Social Science
and Humanities, 19(1), 123-130.
Amin Mahir Abdullah. (1989). Subsidi dan kesannya ke atas petani padi. Jurnal Ekonomi
Malaysia, 19, 17-30.
Bernama. (2018). MOF: Harga RON95, diesel ditetapkan pada RM2.20, RM2.18 seliter,
Bernama, 1-3. June 7.
Bundschuh, J., & Guangnan Chen, E. (2014). Sustainable energy solutions in agriculture. (1st
ed.). CRC Press, London.
ECM. (2011). National energy balance, Putrajaya, Suruhanjaya Tenaga (Energy Commission
of Malaysia).GEOGRAFIA OnlineTM Malaysian Journal of Society and Space 14 issue 4 (308-321)
© 2018, e-ISSN 2680-2491 https://doi.org/10.17576/geo-2018-1404-25 321
FAO. (2018). Agricultural outlook 2018-2027, Rome, OECD-FAO.
Forrester, J.W., (1992). Policies, decisions and information sources for modeling. European
Journal of Operational Research, 59(1), 42-63.
Gusev, M. (2018). Crude oil price forecast: 2018, 2019 and long term to 2030. Retrieved
from http://comstat.comesa.int/infographics/.
Hashim, S.M., (1998). Income inequality and poverty in Malaysia. (1st ed.) Rowman &
Littlefield, London.
Idris, N.D.M., & Siwar, C. (2017). From poverty reduction to poverty relief: Impact of non-
farm income in Integrated Agriculture Development Area (IADA) Samarahan,
Sarawak, Malaysia. Geografia Malaysian Journal of Society and Space, 11(2), 32-41.
Jafni, J.M., C.H., Abu Hassan, D., & Mohd Shahrul Shah, M. (2010). Strengthening food
security through sustainable rice production. Serdang, In Proceeding of national rice
conference 2010, 434-437.
MADA. (2013). Statistics of MADA 2013. Kedah: Lembaga Kemajuan Pertanian Muda
Retrieved from http://www.mada.gov.my/en
Man, N., & Sadiya, S.I. (2009). Off-farm employment participation among paddy farmers. In
the MUDA Agricultural Development Authority and Kemasin Semerak Granary areas
of Malaysia. Asia-Pacific Development Journal, 16(2), 3-18.
Mat, B., & Othman, Z. (2014). Regional cooperation in addressing food security issues in
Southeast Asia: Malaysian perspectives. Geografia Malaysian Journal of Society and
Space, 10(6), 37-47.
MoA. (2013). Agrofood statistics 2013, Putrajaya, Ministry of Agriculture and Agro-based
Industries.
Rabu, M.R., & Shah, M.D.M. (2013). Food and livelihood security of the Malaysian paddy
farmers. Economic and Technology Management Review, 8(1), 59-69.
Ramli, N.N., Mad Nasir Shamsudin, Zainalabidin Mohamed, & Radam, A. (2012). The
impact of fertilizer subsidy on Malaysia paddy/rice industry using a system dynamics
approach. International Journal of Social Science and Humanity, 2(3), 2013-2015.
Saari, Y., Alias Radam, & Abdullah., A.M. (2008). The impacts of increase in the domestic
petroleum prices on cost production in the agricultural and agro-based sectors.
International Journal of Business and Society, 9(1), 37-39.
Sanyal, P.L.A.M., & Kaplan, P. (2015). Impact of energy price variability on global fertilizer
price: application of alternative volatility models. Sustainable Agriculture Research,
4(4), 132-144.
Siti 'Aisyah Baharudin, Fatimah Mohamed Arshad, Muhammad Tasrif, & Ibragimov, A.
(2016). Impact of fuel prices on paddy farmer’s expenditure allocation in Malaysia.
British Journal of Applied Research, 1(1), 5-9.
Sterman, J.D. (2004). Business dynamics: Systems thinking and modeling for a complex
World. (1st ed.). New York, Irwin/McGraw-Hill.You can also read