Production of Fuel from Plastic Waste: A Feasible Business - MDPI

Page created by Esther Curtis
 
CONTINUE READING
Production of Fuel from Plastic Waste: A Feasible Business - MDPI
polymers
Communication
Production of Fuel from Plastic Waste: A Feasible Business
Irene Fahim 1, * , Omar Mohsen 1                    and Dina ElKayaly 2

                                          1   Department of Industrial Engineering, School of Engineering, SESC Research Center, Nile University, Nile
                                              Avenue, Giza 12655, Egypt; O.Mohsen@nu.edu.eg
                                          2   School of Business and Finance, New Giza University, Cairo 11435, Egypt; dina68@hotmail.com
                                          *   Correspondence: isamy@nu.edu.eg

                                          Abstract: This paper aims to conduct a feasibility study of producing fuel from plastic waste. It is
                                          a suggested approach to deal with the huge production of synthetic plastic around the world, so
                                          as to avoid its accumulation in landfills and the depletion of resources. Several types of research
                                          have addressed the conversion of plastic waste into energy, and in this study the authors focused on
                                          using pyrolysis to convert plastic to liquid oil. Accordingly, the volume of the waste was reduced
                                          significantly, and the produced liquid oil had a high calorific value in comparison to fossil fuel. The
                                          authors managed to develop a profitable business model for a facility producing fuel from plastic
                                          waste in Egypt. This project could be a very lucrative business opportunity for investors or venture
                                          capitalists interested in investing in green economy. A Business Model Canvas was used as a tool to
                                          identify how the different components of the business relate to each other.

                                          Keywords: fuel; energy; plastic waste; recovery; calorific value; feasibility

         
                                   1. Introduction
                                          1.1. Plastic Waste: A Global Problem
Citation: Fahim, I.; Mohsen, O.;
ElKayaly, D. Production of Fuel from           Synthetic plastic production has reached 400 million tons worldwide. More than
Plastic Waste: A Feasible Business.       50% of this figure is thrown in landfills or recycled. More than 15 million tons reach
Polymers 2021, 13, 915. https://          seas and oceans every year. There are several ways that plastic waste ends up in the
doi.org/10.3390/polym13060915             ocean. Two-thirds of the waste is generated from land-based sources: litter left on the
                                          beach or washed down rivers and drains, and litter being dropped in towns and cities.
Academic Editor: Giulia Fredi             The waste is also produced from industrial spills, badly managed landfill sites, by bins
                                          near the coast, or by rubbish being flushed down toilets. Most of these waste items are
Received: 11 February 2021                single-use plastics such as drink bottles, plastic bags, cotton bud sticks, sanitary items, and
Accepted: 9 March 2021                    wet wipes. Incineration is also used to get rid of waste. However, U.S. emissions from
Published: 16 March 2021                  plastic incineration reached 5.9 million metric tons of carbon dioxide in 2015, and they are
                                          expected to reach 49 million metric tons by 2030 and 91 million metric tons by 2050 (The
Publisher’s Note: MDPI stays neutral      Hidden Climate Polluter: Plastic Incineration—Global Alliance for Incinerator Alternatives,
with regard to jurisdictional claims in   2021). The burning of waste releases thousands of pollutants that affect people living near
published maps and institutional affil-
                                          these incinerators. Furthermore, landfilling features a much lower climate impact than
iations.
                                          incineration. However, landfills are currently full, and there is no more space for waste
                                          accumulation. Landfilling contaminates soil and water, and also affects wildlife. Previously,
                                          the U.S. and other Western countries sent their contaminated waste to China, transferring
                                          the responsibility of waste management. In 2018, however, China closed its doors to the
Copyright: © 2021 by the authors.         West’s contaminated recycling [1]. It has been concluded that waste plastic fuel has similar
Licensee MDPI, Basel, Switzerland.        properties to diesel fuel and can be used instead of diesel [2].
This article is an open access article
distributed under the terms and           1.2. Plastic Waste: A Severe Problem in Egypt
conditions of the Creative Commons
                                               According to the plastics value chain mapping and assessment, “Egypt generates
Attribution (CC BY) license (https://
                                          around 20 million tons of garbage and waste annually, with plastic waste assumed to
creativecommons.org/licenses/by/
                                          represent 6% out of the total, distributed over Cairo (60%), Alexandria (16%), the Nile
4.0/).

Polymers 2021, 13, 915. https://doi.org/10.3390/polym13060915                                              https://www.mdpi.com/journal/polymers
Production of Fuel from Plastic Waste: A Feasible Business - MDPI
Polymers 2021, 13, x FOR PEER REVIEW                                                                                                                         2 of 10

                                  1.2. Plastic Waste: A Severe Problem in Egypt
Polymers 2021, 13, 915                    According to the plastics value chain mapping and assessment, “Egypt generates                                       2 of 9
                                  around 20 million tons of garbage and waste annually, with plastic waste assumed to rep-
                                  resent 6% out of the total, distributed over Cairo (60%), Alexandria (16%), the Nile Delta
                                  (19%),(19%),
                                 Delta       and other       regions
                                                     and other             including
                                                                      regions              UpperUpper
                                                                                    including        Egypt,     Suez Suez
                                                                                                             Egypt,     Canal,Canal,
                                                                                                                                  and Sinai     (5%). (5%).
                                                                                                                                          and Sinai      Out ofOut the
                                  970
                                 of thekilotonnes
                                           970 kilotonnes of plastic      wastewaste
                                                                   of plastic       generated      annually,
                                                                                            generated             only aonly
                                                                                                           annually,       range    of 30%
                                                                                                                                 a range    ofis30%
                                                                                                                                                  recycled,    while
                                                                                                                                                       is recycled,
                                  5%    is reused,      33%    is   landfilled,      and   32%    is left  to be   burned”.
                                 while 5% is reused, 33% is landfilled, and 32% is left to be burned”. The total amount of       The   total   amount      of plastic
                                  waste waste
                                 plastic    represents       10% of
                                                      represents       10% all of
                                                                                garbage      in Egypt.
                                                                                    all garbage             The amount
                                                                                                    in Egypt.     The amount   of plastic    thatthat
                                                                                                                                     of plastic     is neither    col-
                                                                                                                                                         is neither
                                  lected    nor    landfilled      is 65%.     This   represents      1.3  million    tons
                                 collected nor landfilled is 65%. This represents 1.3 million tons annually in Egypt, while annually      in Egypt,     while  Cairo
                                  only contributes
                                 Cairo     only contributes  0.78 million         tons. When
                                                                       0.78 million                burned,
                                                                                           tons. When           plastic plastic
                                                                                                             burned,       waste releases       harmfulharmful
                                                                                                                                    waste releases           dioxins
                                  (highly(highly
                                 dioxins      toxic chemicals),
                                                         toxic chemicals), which which
                                                                                     can be caninhaled     by humans
                                                                                                     be inhaled     by humansand animals,       deposited
                                                                                                                                     and animals,             in soil
                                                                                                                                                         deposited
                                  and
                                 in  soilsurface     water,water,
                                            and surface         and deposited
                                                                           and deposited on plants.    Uncollected
                                                                                                 on plants.               plasticsplastics
                                                                                                                 Uncollected         pose a threat
                                                                                                                                                pose atothreat
                                                                                                                                                            animalsto
                                  and    sea   life  [3].
                                 animals and sea life [3].
                                          Thereare
                                         There      areseveral
                                                          severalsuccessful
                                                                      successfulwaste   wastemanagement
                                                                                                 managementtechniquestechniquesthat  thathave
                                                                                                                                            havebeenbeenadopted
                                                                                                                                                            adopted
                                  in  the
                                 in the     Middle      East.    This     research      focuses    on   using    plastic   waste
                                                         East. This research focuses on using plastic waste for fuel production.    for  fuel   production.      This
                                  process
                                 This          minimizes
                                         process      minimizes  the volume
                                                                        the volume   of solid   waste
                                                                                           of solid      for landfills
                                                                                                       waste               and and
                                                                                                                for landfills     would     decrease
                                                                                                                                        would             CO2 emis-
                                                                                                                                                   decrease    CO2
                                  sions in Egypt
                                 emissions               caused
                                                  in Egypt      causedby plastic      wastewaste
                                                                             by plastic        by around       8% for8%
                                                                                                       by around         thefor
                                                                                                                              first
                                                                                                                                 theyear,
                                                                                                                                       first and
                                                                                                                                              year,byand30%byfor30%the
                                  firstthe
                                 for     five    years.
                                             first   five Moreover,
                                                            years. Moreover, it woulditdecrease           the high the
                                                                                              would decrease           demand       for fossil for
                                                                                                                            high demand           fuels   products.
                                                                                                                                                       fossil fuels
                                  Additionally,
                                 products.              the carbonthe
                                                   Additionally,            emissions       produced using
                                                                                carbon emissions           produced  this using
                                                                                                                           novel this
                                                                                                                                    fuel novel
                                                                                                                                           are 93%  fuellower   than
                                                                                                                                                           are 93%
                                  those than
                                 lower      producedthoseinproduced
                                                               the use ofinnormal  the usediesel      and gasoline.
                                                                                               of normal      diesel and  Plastic   wastesPlastic
                                                                                                                              gasoline.        are subjected
                                                                                                                                                        wastes areto a
                                  pyrolysisto
                                 subjected        process     usingprocess
                                                     a pyrolysis         a catalyst     [4]. aThe
                                                                                     using         catalyst
                                                                                                catalyst    [4].can
                                                                                                                 Thebecatalyst
                                                                                                                          a blendcan of zeolite,
                                                                                                                                         be a blendclay,ofalumina,
                                                                                                                                                            zeolite,
                                 clay,
                                  and alumina,
                                         silicates inand       silicates
                                                          various            in various
                                                                       proportions            proportions
                                                                                           [5]. There are three [5]. There
                                                                                                                       types are    three types
                                                                                                                                of pyrolytic          of pyrolytic
                                                                                                                                                 reactions    differ-
                                 reactions
                                  entiated by    differentiated
                                                     the processing     by time
                                                                              the processing
                                                                                      and temperaturetime and       temperature
                                                                                                               of the    biomass: slow of the    biomass:fast
                                                                                                                                              pyrolysis,       slow
                                                                                                                                                                  py-
                                 pyrolysis,
                                  rolysis, and    fast  pyrolysis,
                                                     flash   pyrolysis    and[6].flash    pyrolysis
                                                                                    The major           [6]. Theofmajor
                                                                                                   byproducts                  byproducts
                                                                                                                        this process             of this
                                                                                                                                          are char    and process
                                                                                                                                                            gas. The
                                 are  char and of
                                  proportion          gas.
                                                         theThe      proportion
                                                               byproduct               of the byproduct
                                                                                  depends       on temperature, depends      on temperature,
                                                                                                                         heating     rate, pressure, heating
                                                                                                                                                           andrate,
                                                                                                                                                                 resi-
                                 pressure,      and
                                  dence time [7].      residence       time    [7].
                                         Egypt
                                          Egypthas   hastentenrefineries
                                                                  refinerieswhich whichproduce
                                                                                            produce760,000760,000barrels
                                                                                                                      barrelsofofpetroleum
                                                                                                                                     petroleumproducts
                                                                                                                                                     productsper   per
                                 day.
                                  day. TheThe consumption
                                                 consumption of         of petroleum
                                                                             petroleum products
                                                                                              products in   in Egypt
                                                                                                                Egypt has has reached
                                                                                                                                reached 1.2 1.2 million
                                                                                                                                                 million barrels.
                                                                                                                                                             barrels.
                                 Figure
                                  Figure11shows  showsthat  that35%  35%ofofpetroleum
                                                                                 petroleumproducts
                                                                                                 productsininEgypt Egyptare   areimported,
                                                                                                                                   imported,while  while65% 65%are are
                                 locally    produced.        The     cost   of  the   imported      oil reached      around
                                  locally produced. The cost of the imported oil reached around $7 billion in 2019 [8]. Thus,   $7  billion   in  2019   [8]. Thus,
                                 the
                                  thefuel
                                        fuelproduced
                                               producedfrom     fromplastic
                                                                         plasticwastewastewouldwouldfulfill
                                                                                                         fulfillthe
                                                                                                                  theenergy
                                                                                                                        energydemands
                                                                                                                                  demandsofofthe     thetransport
                                                                                                                                                          transport
                                 sector,    and    Egypt    would       have     a  continuous      and    sustainable
                                  sector, and Egypt would have a continuous and sustainable source of fuel. Eventually,     source    of fuel.  Eventually,     this
                                 could     save    a huge     amount        of  money      previously       being
                                  this could save a huge amount of money previously being spent on importing oil.    spent   on  importing       oil.

                                                    Locally Produced vs. Imported Petroleum
                                                                Products in Egypt
                                                                   Imported
                                                                   petroleum
                                                                    products
                                                                      35%

                                                                                                                   Locally produced
                                                                                                                      petroleum
                                                                                                                       products
                                                                                                                          65%

                                                     Locally produced petroleum products                     Imported petroleum products

                                  Figure1.1.Local
                                 Figure      Localproduction
                                                   productionand
                                                              andimports
                                                                  importsofofpetroleum
                                                                              petroleumproducts
                                                                                        productsininEgypt.
                                                                                                     Egypt.

                                      This study calculates the feasibility of combining several synthetic polymer matrix
                                 composites with different functions to produce a successful fuel processing system, us-
                                 ing waste from high-density polyethylene (HDPE), polyethylene terephthalate (PET),
                                 polystyrene (PS), and polypropylene (PP). Getting rid of the waste of these poorly degrad-
                                 able synthetic polymers, which are undesirable due to their negative impact on health as
Polymers 2021, 13, 915                                                                                                         3 of 9

                                   well as on the environment, is successfully performed in this work by changing them to fuel
                                   through pyrolysis. The fuel industry would strongly benefit from this process as it would
                                   improve process sustainability. In this context, research into fuel and biorefineries will be
                                   immensely important in the near future. This work focuses on estimating the price of the
                                   development of fuel using a cost-effective process based on the valorization of synthetic
                                   plastic waste. In this context, the recycling of waste plastic as a fuel through pyrolysis in an
                                   inert atmosphere is an environmentally friendly solution.

                                   2. Background on the Industrial Pyrolysis Process
                                        This article focuses on calculating the cost of converting several types of plastic waste
                                   (PE, PS, PP, and PET) into fuel. The plastic waste is cleaned, dried, and size reduced. It is
                                   converted into liquid fuel using fast pyrolysis. HDPE is extracted from milk jugs, yogurt
                                   tubs, cleaning product containers, and body wash bottles. PET is collected from food and
                                   mouthwash containers. PP is found in plastic food storage containers, car parts, thermal
                                   vests, yogurt containers, and disposable diapers. PS is found in cups, insulation, packing
                                   materials, egg cartons, and disposable dinnerware [9]. The collected plastic is shredded
                                   and crushed into small pieces (1 × 3 cm2 ) to reduce the volume of the plastic in the reactor.
                                   The plastic pieces are washed to remove any toxic materials.
                                        The catalyst needed is Zeolite Socony Mobil-5 (ZSM-5), which is a high-silica zeolite,
                                   widely used in the petroleum industry as a heterogeneous catalyst for hydrocarbon iso-
                                   merization reactions. The chosen catalyst is a commercial catalyst. However, it must be
                                   dried in an oven to remove the moisture to below (5%) and further cracked to produce
                                   a much smaller particle size that will help in the reaction. The plastic-to-catalyst ratio is
                                   10:1 [10]. The addition of the catalyst massively reduces the time needed for the process
                                   as well as the temperatures of the pyrolysis process, which results in an increase in the
                                   conversion rates for a wide range of polymers, which face significantly lower temperatures
                                   than they do during purely thermal pyrolysis. It also provides a high level of control in the
                                   distribution of the hydrocarbon products in LDPE, HDPE, PP, and PS pyrolysis [11].

                                   Synthesis of Liquid Fuels
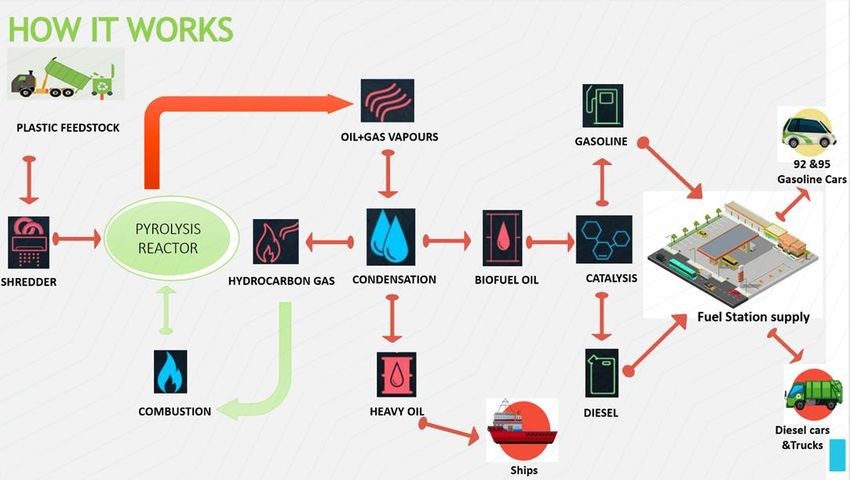
                                         The feedstock (plastic waste from different types of synthetic plastic) is shredded and
                                   mixed with the catalyst into the pyrolysis reactor with certain quantities and ratios, as
                                   illustrated in Table 1. The stainless-steel reactor is a fixed bed. The plastic is heated to reach
                                   a maximum temperature of 550 ◦ C, at a heating rate of 15 ◦ C/min. The products of the
                                   pyrolysis process are oil and gas vapor [12]. These products go through a condensation
                                   process to produce fuel oil, heavy oil, and light hydrocarbon gas [10], as shown in Figure 2.
                                   Hydrocarbons are stored and reused in the combustion process, so the energy in this
                                   system is self-sufficient. Biofuel oil is transported to refineries and converted to gasoline
                                   and diesel using the previously mentioned catalyst. Heavy oil is supplied to ships. The
                                   cost of this process is calculated to determine the economic feasibility of this process. One
                                   of the important properties of a fuel on which its efficiency is judged is its calorific value.
                                   The calorific value is defined as the energy produced when the unit mass of fuel is burned
                                   completely in sufficient air. Figure 2 shows a comparison between diesel, kerosene, furnace
                                   oil, heavy fuel oil (HFO), light fuel oil (LFO), gasoline, fuel from plastic waste (WPPO),
                                   and biodiesel. The calorific value of the fuel produced from plastic waste was estimated
                                   according to the IP 12/58 method. Its calorific value was 9829.3515 kcal/kg as shown in
                                   Figure 3, which is close to the calorific value of diesel [11–13].

                                              Table 1. Feedstock type and quantity [12].

     Feedstock            Feedstock         Catalyst           Feedstock      Reaction Temp.      Heating Rate         Process
       Type              Quantity (kg)    Quantity (kg)          Ratio             (◦ C)           (◦ C/min)          Efficiency
       HDPE                   5                0.5               100%               550                15                94%
        PET                   5                0.5               100%               550                15                70%
         PS                   5                0.5               100%               550                15                80%
Polymers 2021, 13, 915                                                                                                                4 of 9

                                                                  Table 1. Cont.

     Feedstock            Feedstock         Catalyst               Feedstock         Reaction Temp.     Heating Rate         Process
       Type              Quantity (kg)    Quantity (kg)              Ratio                (◦ C)          (◦ C/min)          Efficiency
         PP                   5                 0.5                   100%                  550              15                 60%
      PP/PET                  5                 0.5                  50–50%                 550              15                 67%
       PS/PP                  5                 0.5                  50–50%                 550              15                 75%
Polymers
 Polymers2021,
          2021,13,
                13,xxFOR
                      FORPEER REVIEW
                          PEER5REVIEW                                                                                                4 of 10
       Mixed                                    0.5                 25% each                550              15             85.6–89.5%4 of 10

                                                      Figure
                                                       Figure2.
                                                      Figure 2.2.The
                                                                  Thepyrolysis
                                                                 The  pyrolysisprocess.
                                                                     pyrolysis  process.
                                                                               process.

                                           Diesel
                                            Diesel    Kerosene
                                                       Kerosene     Oil
                                                                     Oil   HFO
                                                                            HFO    LFO
                                                                                    LFO   Gasoline
                                                                                           Gasoline   WPPO
                                                                                                      WPPO   Biodiesel
                                                                                                              Biodiesel

                                   Figure
                                    Figure3.
                                   Figure 3.3.Similarity
                                               Similarityof
                                              Similarity  ofplastic
                                                         of  plasticoil
                                                            plastic  oilwaste
                                                                    oil wasteto
                                                                        waste  tothe
                                                                              to  theother
                                                                                 the  otherfuel
                                                                                     other  fuelproducts
                                                                                           fuel  products[11]
                                                                                                products  [11]
                                                                                                         [11].

                                               Table
                                                Table1.1.Feedstock
                                                          Feedstocktype
                                                                    typeand
                                                                         andquantity
                                                                             quantity[12].
                                                                                      [12].

                    Feedstock
                     FeedstockQuan-
                                Quan-
   Feedstock
    Feedstock                          Catalyst
                                        Catalyst Feedstock
                                                    FeedstockRa-
                                                              Ra- Reaction
                                                                   ReactionTemp.
                                                                             Temp.                    Heating
                                                                                                      HeatingRate
                                                                                                              Rate        Process
                                                                                                                           ProcessEffi-
                                                                                                                                   Effi-
                          tity
                           tity
     Type
      Type                           Quantity
                                      Quantity(kg)
                                               (kg)     tio
                                                         tio            (°C)
                                                                         (°C)                          (°C/min)
                                                                                                        (°C/min)             ciency
                                                                                                                              ciency
                          (kg)
                           (kg)
Polymers 2021, 13, 915                                                                                                                          5 of 9

                                      3. Methodology
                                      3.1. Feasibility of Producing Fuel from Plastic Waste
                                           The statistics clearly demonstrated deficiencies in Egypt’s plastic waste management.
                                      Therefore, the authors decided to introduce a new business opportunity of establishing a
                                      production facility that converts 13,000 tons of plastic waste to fuel per day. This business
                                      concept is presented using a Business Model Canvas (BMC) as shown in Table 2. BMC helps
                                      to define how to get fuel products to their target customers by establishing a profitable
                                      business based on product innovation and efficient business processes, leading to a reduced
                                      risk of failure.

                                      3.2. Calculating Cost Elements
                                           To calculate the economic feasibility of converting plastic waste to fuel, the authors
                                      had to interview professional experts. In-depth interview was the selected data collection
                                      method. It was used to collect the needed detailed information. Around ten in-depth
                                      interviews were conducted and divided as per Table 3.

                                                        Table 2. Business Model Canvas.

                                                             Business Model Canvas
                                                                                               Customer Relations
 Key Partners                 Key Activities                 Value Proposition                                                Customer Segments
                                                                                                     Consumer educa-
       Plastic producers            Recycling                  Less pollution                                                     Manufacturers
                                                                                                      tion/Awareness
       Governmental                 Assist in managing         Better waste                                                       Associations
                                                                                                     Good business
        agencies                      the plastic waste           management system
                                                                                                      environment
       Financers                                                Lowering of the
       Authorities           Key Resources                       healthcare budget            Distribution Channel
        concerned with the           Recyclable materials       Business opportunity               Circular economy
        environment                  Machinery                  Better quality of life              platforms
                                     Financial support          Job creation                       Wholesalers
                                                                 Energy saving
 Cost Structure                                              Revenue Stream
       Plant design and outlay                                  Cost saving using recyclable materials flow
       R&D costs                                                Diversification (different types of plastic)
       Raw materials and supplier selection                     Governmental support/grace period

                                               Table 3. Sample design of the experts’ interviews.

                         Number of
      Covering                                           Segment (Who?)                                              Why?
                         Interviews
                                                                                           To find the investment cost to cover equipment costs.
                                         Technical expert owning a company selling         He was willing to customize the needed production
                              1
                                         production lines and installing them              line matching the required specifications, and he could
                                                                                           identify the needed labor (blue collar).
                                                                                           To find:
                                                                                                  The cost of establishing a company.
    Elements of the                                                                               The cost of issuing its legal documents.
   investment costs                                                                               The annual increase needed to compensate the
                              1          Chartered accountant                                      inflation rate.
                                                                                                  The currency conversion rate
                                                                                                  The norms of overheads, marketing, and other
                                                                                                   expenses
                                                                                                  The depreciation and taxation percentages
                                         Sales managers of office furniture companies
                              2          (Mobica, Mohm Furniture, office furniture         To find the cost of the office furniture
                                         manufacturer in Egypt)
    Elements of the                      Salesperson in an industrial zone
                              1                                                            To find the rental and utilities costs
   operational costs                     (Home—Polaris Parks)
Polymers 2021, 13, 915                                                                                                                               6 of 9

                                                                       Table 3. Cont.

                             Number of
      Covering                                               Segment (Who?)                                                Why?
                             Interviews
                                                                                                  To find:
                                                                                                        Suggested organization chart incorporating the
                                             Human Resources managers of factories                       blue collar workers and suggesting the suitable
                                  2                                                                      white collar workers
                                             working in the same zone and related industries
    Elements of the                                                                                     Average salaries
   operational costs                                                                                    Other benefits
                                                                                                  To find:
                                             Traders offering raw material who serve related            The cost of the raw materials (plastic waste and
                                  2                                                                      necessary chemicals)
                                             industries
                                                                                                        Average selling price of fuel

                                               Based on these interviews, the authors identified both the investment and operational
                                          costs. The investment costs are the costs paid once during the establishment of the facility,
                                          as shown in Table 4.

                                          Table 4. Investment costs.

                                                Investment and Establishment Costs                                      Fees in EGP
                                                        Professional license fees                                           20,000
                                                            Equipment cost                                                2,000,000
                                                            Office furniture                                                50,000
                                                            Total fixed costs                                             2,070,000
                                          Source: based on in-depth interviews conducted with experts—November 2020.

                                               The key assumptions for the feasibility study are identified in Table 5. The operational
                                          costs are the running costs paid monthly/annually as illustrated in Table 6. The technical
                                          expert suggested an initial daily active production capacity and we created several iter-
                                          ations until the authors agreed on the assumptions mentioned in Table 5. The authors
                                          also contacted a technical expert experienced in conducting technical feasibility studies to
                                          cross-validate the numbers.

                                                 Table 5. Key assumptions for the feasibility model.

                 Element                                               Description                                              Source
                                               13,000 tons of fuel
                                               (out of 20,000 tons of plastic waste)
                                               The 20,000 tons was based on the amount of plastic waste        Calculated by the technical expert (one of
 Daily active production capacity
                                               collected daily. The production of 13,000 tons of fuel out of   the authors)
                                               20,000 tons of plastic waste was based on a preliminary
                                               experiment executed at lab scale
 Number of working daysNumber of               26 days per month                                               Industry norm in Egypt that was
 working months                                12 months per year                                              confirmed by the technical expert
 Monthly rental of a prebuilt factory          EGP 35,000 per month                                            Market price confirmed by in-depth
                                                                                                               interview with the sales manager of the
                                               Electricity costs EGP 11,440 per month                          industrial zone
 Utilities and electricity
                                               Utilities oil and water-repellent costs EGP 13,312 per month
                                                                                                               Market price confirmed by in-depth
 Price per ton of plastic waste                EGP 1500 per ton
                                                                                                               interviews with traders
                                               Total salaries (white- and blue-collar workers) = EGP           Market price confirmed by in-depth
 Labor
                                               150,000 per month                                               interviews with HR individuals
                                               Overheads = 4% of Cost of Gods sold (COGS)
                                               Marketing expenses = 0.5% of COGS
 Overheads, marketing, and other                                                                               Market norm confirmed by an in-depth
                                               Other expenses = 0.5% of COGS
 expenses                                                                                                      interview with the chartered accountant
                                               Taxation = 22% of gross profit
                                               Depreciation = 20% of gross profit
Polymers 2021, 13, 915                                                                                                                         7 of 9

                                                            Table 6. Operational costs.

                                                                                              Operational Costs in EGP
        Category                      Description
                                                                        Year 1               Year 2             Year 3              Year 4
                                     Monthly rentals                   420,000               462,000            508,200             559,020
 Building and utilities                  Electricity                   137,280               137,280            137,280             137,280
                            Utilities, oil, and water repellent        159,744               159,744            159,744             159,744
    Raw materials               Plastic waste + catalyst             9,360,000,000        10,296,000,000    11,325,600,000      12,458,160,000
         Labor                    Blue and white collar                1,800,000            1,800,000          1,800,000          1,800,000
   Cost of goods sold     Sum of the abovementioned expenses         9,362,517,024        10,298,559,024    11,328,205,224      12,460,816,044
                            Management and administrative
       Overheads                                                      374,500,681          411,942,361        453,128,209         498,432,641
                                        expenses
       Marketing                       Marketing                      46,812,585           51,492,795         56,641,026          62,304,080
                          Exceptional expenses (might include
         Others                                                       374,500,681          411,942,361        453,128,209         498,432,642
                                       insurance)
                   Total Operational Expenses                        9,364,587,024        11,173,936,541    12,291,102,668      13,519,985,408
                                 Source: based on in-depth interviews conducted with experts—November 2020.

                                    3.3. Calculating the Revenue Projection
                                        To project the revenues shown in Table 7, the authors contacted traders selling similar
                                    products. They estimated the price to be EGP 10,000–10,500. The annual increase is kept
                                    conservative, mainly covering the inflation rate.

                                                           Table 7. Revenue projection.

                                                                                                  Revenue in EGP
                                      Description
                                                                        Year 1               Year 2             Year 3              Year 4
   Active production       13,000 tons will be produced every
                                                                       4,056,000            4,461,600          4,907,760           5,398,536
    capacity in tons          day (×26 days × 12 months)
         % Sold                                                          80%                  85%                90%                 95%
          Price                Price per ton = EGP 10,200               10,200               10,200             10,200              10,200
                           Increase of selling price and costs
    Annual increase                                                      10%                  10%                10%                 10%
                           mainly covering the inflation rate
                          Total Income                              33,096,960,000        38,682,072,000    45,053,236,800      52,311,813,840

                                    3.4. Estimating the Profitability
                                         The project is feasible based on the numbers presented in Table 8. A sensitivity analysis
                                    was also performed by increasing the cost by 10% and/or decreasing the price by 10%,
                                    and still the project remained feasible, as demonstrated in Table 9. However, the working
                                    capital remains a challenge, both to satisfy the short-term obligations and to achieve the
                                    projected profits.

                                    Table 8. Profitability.

                                                                                                    Revenue in EGP
                                              Description
                                                                          Year 1               Year 2            Year 3             Year 4
                                            Total income              33,096,960,000       38,682,072,000    45,053,236,800     52,311,813,840
                                             Total costs              9,364,587,024        11,173,936,541    12,291,102,668     13,519,985,408
                                             Gross profit             23,732,372,976       27,508,135,459    32,762,134,132     38,791,828,432
                                              Taxation               1,186,618,648.80       1,375,406,773     1,638,106,706      1,939,591,421
                                      Depreciation of equipment
                                                                         500,000              500,000           500,000            500,000.0
                                         and office furniture
                                              Net gains               22,545,654,327       26,132,628,686   31,123,927,425.36   36,852,137,010.6
Polymers 2021, 13, 915                                                                                                                   8 of 9

                                  Table 9. Sensitivity analysis.

                                                                                                Total Gain in EGP
                                              Description
                                                                           Year 1           Year 2            Year 3            Year 4
                                      After decreasing the price to
                                                                        21,929,142,327   25,412,080,286   30,284,700,465     35,877,701,262
                                            become EGP 1000
                                     After increasing the total costs
                                                                        21,656,018,560   25,071,104,715   29,956,272,671     35,567,738,396
                                                 by 10%
                                     After applying both changes        21,039,506,560   24,350,556,315   29,117,045,711     34,593,302,648

                                   4. Conclusions
                                       This study demonstrated the importance of recycling plastic waste, especially in devel-
                                  oping countries, as a means of saving unnecessary energy usage which in return decreases
                                  the production costs. Plastics can be easily converted into high-value fuel, which can be
                                  used as an alternative fuel. The volume of plastic waste present in the environment will be
                                  reduced along with the environmental effects such as excessive heating and greenhouse
                                  effects. The pyrolysis process is considered an effective, clean, and exceptionally successful
                                  technique in handling plastic solid waste, and it provides a cheap source of energy. Such
                                  a radical change should start with entrepreneurs suggesting new business ideas aimed
                                  at creating a wave leading to changing regulations and initiating governmental policies.
                                  Converting plastic waste into fuel in the Egyptian market would not only solve the plastic
                                  waste crisis in Egypt but would also decrease plastic pollution by avoiding incineration
                                  and landfilling, in addition to reducing the amount of imported oil barrels. Similarly, a
                                  company on Nova Scotia’s South Shore that plans to turn plastic waste into diesel and
                                  kerosene expects no significant environmental effects from its operations [14].Quantafuel
                                  is another Norwegian company collaborating with BASF Chemicals company to turn a
                                  global environmental problem into low-carbon products by collecting marine plastic waste
                                  and turning it into fuel [15].

                                  Author Contributions: Conceptualization, D.E.; Data curation, I.F. and O.M.; Formal analysis, I.F.;
                                  Investigation, D.E.; Methodology, I.F.; Resources, I.F. All authors have read and agreed to the
                                  published version of the manuscript.
                                   Funding: This research received no external funding.
                                   Institutional Review Board Statement: Not applicable.
                                   Informed Consent Statement: Not applicable.
                                   Data Availability Statement: The data presented in this study are available on request from the
                                   corresponding author.
                                   Conflicts of Interest: No potential conflicts of interest were reported by the authors.

References
1.    Erdogan, S. Recycling of Waste Plastics into Pyrolytic Fuels and Their Use in IC Engines. In Sustainable Mobility; Intech Open:
      London, UK, 2020; pp. 78–90.
2.    Farag, M.; Korachy, A. Plastics Value Chain Mapping and Assessment Technical Report No. 20, USAIDS Strengthening
      Entrepreneurship and Enterprise Development (SEED). 2017. Available online: http://www.seedegypt.org/wp-content/
      uploads/2019/04/Plastics-Value-Chain-Mapping-and-Assessment.pdf (accessed on 3 February 2021).
3.    Gnansounou, E.; Raman, J. Hotspot Environmental Assessment of Biofuels. In Biomass, Biofuels, Biochemicals, Biofuels: Alternative
      Feedstocks and Conversion Processes for the Production of Liquid and Gaseous Biofuels, 2nd ed.; Academic Press: Cambridge, MA, USA,
      2019; pp. 141–162.
4.    Syamsiro, M.; Saptoadi, H.; Norsujianto, T.; Noviasri, P.; Cheng, S.; Alimuddin, Z.; Yoshikawa, K. Fuel Oil Production from
      Municipal Plastic Wastes in Sequential Pyrolysis and Catalytic Reforming Reactors. Energy Procedia 2014, 47, 180–188. [CrossRef]
5.    Salvilla, N.V.; Ofrasio, B.I.G.; Rollon, A.P.; Manegdeg, F.G.; Abarca, R.R.M.; de Luna, M.D.G. Synergistic co-pyrolysıs of polyolefin
      plastics with wood and agricultural wastes for biofuel production. Appl. Energy 2020, 279, 115668. [CrossRef]
6.    Patni, N.; Shah, P.; Agarwal, S.; Singhal, P. Alternate strategies for conversion of waste plastic to fuels. ISRN Renew. Energy 2013,
      2013, 1–7. [CrossRef]
Polymers 2021, 13, 915                                                                                                          9 of 9

7.    Egypt, $ 6.8 Billion 2019 Imported Fuel Bill 2019. Available online: https://www.alarabiya.net/aswaq/economy/2019/12/30
      (accessed on 3 February 2021).
8.    Different Plastic Types and How They Are Recycled. 2021. Available online: https://www.generalkinematics.com/blog/
      different-types-plastics-recycled/ (accessed on 3 February 2021).
9.    Juwono, H.; Nugroho, K.A.; Alfian, R.; Ni’mah, Y.L.; Sugiarso, D. New generation biofuel from polypropylene plastic waste with
      co-reactant waste cooking oil and its characteristic performance. J. Phys. Conf. Ser. 2019, 1156, 012013. [CrossRef]
10.   Kumar, N.P.; Vinayaka, T.; Rajesh, S.; Pavan, K. Production of Biofuel Compounds from Waste Plastics by Using Catalytic
      Pyrolysis Process. 2018. Available online: https://www.irjet.net/archives/V5/i5/IRJET-V5I5904.pdf (accessed on 3 February
      2021).
11.   Rosendahl, L. Direct Thermochemical Liquefaction for Energy Applications; Woodhead Publishing: Cambridge, UK, 2018.
12.   Khan, M.Z.H.; Sultana, M.; Al-Mamun, M.R.; Hasan, M.R. Pyrolytic Waste Plastic Oil and Its Diesel Blend: Fuel Charac-terization.
      J. Environ. Public Health 2016. [CrossRef] [PubMed]
13.   Company Aiming to Convert Plastics into Fuel Seeks Environmental Approval. Retrieved 3 February 2021. Available online:
      https://ca.news.yahoo.com/company-aiming-convert-plastics-fuel-090000327.html (accessed on 7 July 2018).
14.   Transforming Plastic Waste into Valuable Low-Carbon Fuel. Available online: https://gwcouncil.org/wp-content/uploads/2020
      /06/Attachment-4-Quantafuel-introduction.pdf (accessed on 3 February 2021).
15.   BASF Invests in Quantafuel to Drive Chemical Recycling. Retrieved 3 February 2021. Available online: https://www.
      recyclingtoday.com/article/basf-quantafuel-investment-chemical-recycling/ (accessed on 8 October 2019).
You can also read