Investor Update Itron Investor Update 2021
←
→
Page content transcription
If your browser does not render page correctly, please read the page content below

Investor Update
FEBRUARY 2021

©2021 ITRON PROPRIETARY
                          Itron Investor Update 2021 |
FORWARD LOOKING STATEMENTS
This presentation contains, and our officers and representatives may from time to time make, "forward-looking statements" within the meaning of the safe harbor
provisions of the U.S. Private Securities Litigation Reform Act of 1995. Forward-looking statements are neither historical factors nor assurances of future performance.
These statements are based on our expectations about, among others, revenues, operations, financial performance, earnings, liquidity, earnings per share, cash flows
and restructuring activities including headcount reductions and other cost savings initiatives.
This document reflects Itron’s/our current strategy, plans and expectations and is based on information currently available as of the date of our latest Form 10-K or
Form 10-Q filed with the SEC. When we use words such as "expect," "intend," "anticipate," "believe," "plan," “goal,” “seek,” "project," "estimate," "future," “strategy,”
"objective," "may," “likely,” “should,” "will," "will continue," and similar expressions, including related to future periods, they are intended to identify forward-looking
statements. Forward-looking statements rely on a number of assumptions and estimates. Although we believe the estimates and assumptions upon which these
forward-looking statements are based are reasonable, any of these estimates or assumptions could prove to be inaccurate and the forward-looking statements based
on these estimates and assumptions could be incorrect. Our operations involve risks and uncertainties, many of which are outside our control, and any one of which, or
a combination of which, could materially affect our results of operations and whether the forward-looking statements ultimately prove to be correct. Actual results and
trends in the future may differ materially from those suggested or implied by the forward-looking statements depending on a variety of factors.
Therefore, you should not rely on any of these forward-looking statements. Some of the factors that we believe could affect our results include our ability to execute on
our restructuring plan, our ability to achieve estimated cost savings, the rate and timing of customer demand for our products, rescheduling of current customer orders,
changes in estimated liabilities for product warranties, adverse impacts of litigation, changes in laws and regulations, our dependence on new product development and
intellectual property, future acquisitions, changes in estimates for stock-based and bonus compensation, increasing volatility in foreign exchange rates, international
business risks, uncertainties caused by adverse economic conditions, including, without limitation those resulting from extraordinary events or circumstances such as
the COVID-19 pandemic and other factors that are more fully described in Item 1A: “Risk Factors” included in our Annual Report on Form 10-K for the year ended Dec.
31, 2020 and other reports on file with the Securities and Exchange Commission. We do not undertake any obligation to publicly update or revise any forward-looking
statement, whether written or oral. These risks and uncertainties are detailed in the Company's filings with the Securities and Exchange Commission, including its most
recently filed 10-K, copies of which may be accessed through the SEC's website at http://www.sec.gov.
The impact caused by the ongoing COVID-19 pandemic includes uncertainty as to the duration, spread, severity, and any resurgence of the COVID-19 pandemic
including other factors contributing to infection rates, such as reinfection or mutation of the virus, the effectiveness or widespread availability and application of any
vaccine, the duration and scope of related government orders and restrictions, impact on overall demand, impact on our customers’ businesses and workforce levels,
disruptions of our business and operations, including the impact on our employees, limitations on, or closures of, our facilities, or the business and operations of our
customers or suppliers. Our estimates and statements regarding the impact of COVID-19 are made in good faith to provide insight to our current and future operating
and financial environment and any of these may materially change due to factors outside our control. For more information on risks associated with the COVID-19
pandemic, please see Itron’s updated risk in Part II, Item 1A: Risk Factors of our latest 10-Q filing with the SEC.

           ©2021 ITRON PROPRIETARY                                                                                                          Itron Investor Presentation 2021   | 2
ITRON AT-A-GLANCE
    Itron enables utilities and cities to safely, securely and reliably deliver critical infrastructure services that measure,
    manage, and provide data analytics that enable them to responsibly and efficiently manage resources in the communities
    they serve. With over 40 years of experience and over…

                                                                                                                                                                                   $2.2B 2020 REVENUE
                                                                                                                                                                                   & REVENUE MIX OF:
                                                                                                                                                                  Outcomes                                             APAC
                                                                                                                                                                      11%                                               7%
             8,000                                         >200M                                               >74M
        CUSTOMERS IN                                  COMMUNICATING                                    ENDPOINTS UNDER
        100 COUNTRIES                                   ENDPOINTS                                        MANAGEMENT                                                                 Device
                                                                                                                                                                                   Solutions                     EMEA
                                                                                                                                                                                      32%                            27%
                                                                                                                                                                 Networked
                                                                                                                                                                                                                             AMERICAS
                                                                                                                                                                 Solutions
                                                                                                                                                                     57%                                                       66%

             ~3M                                           ~6,200                                               +250                                                                   WITH A Q4’2020:
     DISTRIBUTED                                       PEOPLE                                     PARTNERS IN A BROAD                                                     $3.3B                                            >$1.2B
INTELLIGENCE ENABLED                               ACROSS THE GLOBE                             ECOSYSTEM OF SOLUTIONS                                                                                           12-MONTH BACKLOG
                                                                                                                                                                         BACKLOG
      ENDPOINTS

Note: Revenue reported year ending December 31, 2020 and Backlog and People as of December 31, 2020, all other data points rounded or estimated based on internal Itron source material at the time of publication

                  ©2021 ITRON PROPRIETARY                                                                                                                                                       Itron Investor Presentation 2021        | 3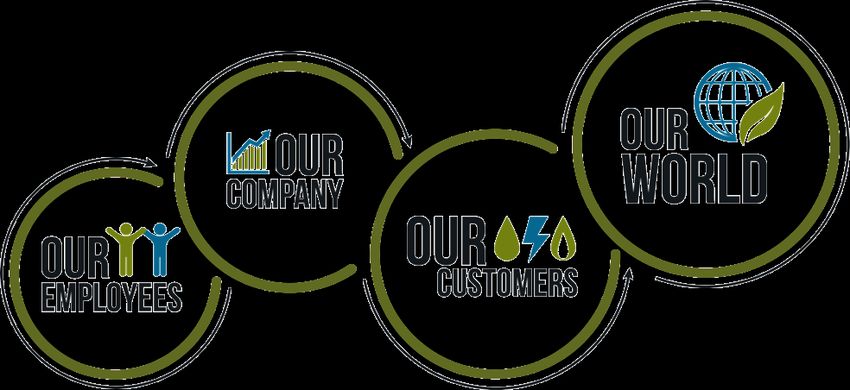
OUR VISION AND PURPOSE
Itron is dedicated to creating a more resourceful world

» We believe that the way we manage energy
  and water will define this century.

» Our long-term view is that by delivering
  products and services that support
  sustainability, diversity and accountability
  of our key stakeholders we can create a
  more resourceful world.

» To achieve this, Itron leverages a holistic
  approach that integrates our strategic,
  operational and risk management efforts
  with our ESG initiatives.

      ©2021 ITRON PROPRIETARY                             Itron Investor Presentation 2021   | 4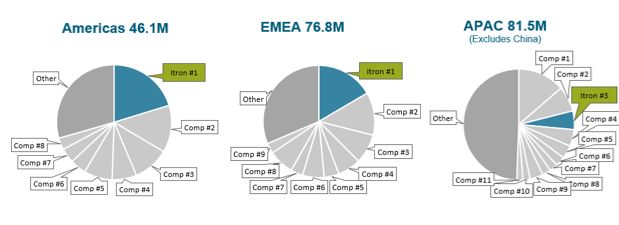
ITRON’S FOUR ESG PILLARS
 Our approach to a more resourceful world
                           Energy Mix – Manufacturing Sites                             Full Time Employee Demographics – By Region

                          Nuclear      Renewable    Non-Renewable     DIVERSITY AND
 ENVIRONMENTAL             49.7%         31.7%          18.6%
AND OPERATIONAL                                                     OUR HUMAN CAPITAL
  STEWARDSHIP                                                            PLEDGE
                          Certified Locations:
                          ISO 9001 (20); IS0 14001 (15);
                          ISO 27001 (13); OHSAS 18001 (6)

                          Itron Board of Directors Key Statistics
                                                                                      Transforming Our Industry: Integrating Renewables
                                                                                      One customer found it 87% less expensive and 29
                                                                                      weeks faster to connect distributed generation to the
                                                                                      grid with Itron solutions.

                                                                                      Investing in our Communities & Education
    EFFECTIVE                                                       SOLUTION IMPACT Itron-sponsored programs reached over 1.5 million
  SHAREHOLDER                                                       AND COMMUNITY
   ADVOCACY                                                           ENGAGEMENT    students and 27.3 million consumers in 2019.

For more please visit: www.itron.com/ESG

          ©2021 ITRON PROPRIETARY                                                                             Itron Investor Presentation 2021   | 5
Industry and Itron Overview
STRONG INDUSTRY GROWTH POTENTIAL
    TAM of ~$25B Annually Growing at 9% CAGR, With ~18% CAGR in Outcomes

                                                          World Wide                                   AMERICAS                                              EMEA                                              APAC
    2020 Total Available Market
      (B$) / CAGR (2020-2023)
                                                      TAM                 CAGR                    TAM                   CAGR                     TAM                     CAGR                        TAM                    CAGR

 Outcomes                                               7.0               18.0%                    2.8                  16.9%                      2.4                   16.0%                         1.8                  21.9%

 Networked Solutions                                    8.6                8.4%                    3.0                   8.7%                      1.8                     8.5%                        3.8                   8.0%

 Device Solutions                                       9.2                1.7%                    0.8                   4.5%                      4.0                     1.0%                        4.5                   1.7%

 Total                                                 24.8                9.0%                    6.6                  11.9%                      8.2                     7.5%                      10.1                    8.2%

                                   NORTH AMERICA                                                                                                                       GLOBAL
           ~64% penetration of ~400M smart endpoints                                                                                 ~28% penetration of ~3.7B endpoints smart

Source: Management Estimates using data from Omida 2020, Northeast Group Smart Streetlighting and Smart Cities Market Forecast 2020, Guidehouse Distribution Automation Q4 2020. Penetration rates using IHS Research - Global Electricity,
Gas and Water Metering Reports, 2020 Editions (includes China); Northeast Group Smart Streetlighting and Smart Cities Market Forecast 2020-2029

                 ©2021 ITRON PROPRIETARY                                                                                                                                                    Itron Investor Presentation 2021                  | 7
DYNAMIC FORCES IMPACTING OUR INDUSTRY
Mega-trends highlight the critical role Itron technology plays in utility ecosystem
INFRASTRUCTURE ENVIRONMENTAL SOCIAL
» Managing Demand Needs » Remote Pandemic Mgmt » Supporting Critical Need Customers
» Aging Infrastructure » Extreme Weather » Enhanced Customer Experience
» Grid Security » Resource Sustainability » Global Urbanization
» Clean Energy & Storage » Safety and Prevention » Internet of Things
» Electric Vehicles » Monitoring and Management » Generating “Big Data”
Itron is focused on enabling customer success in a changing world!
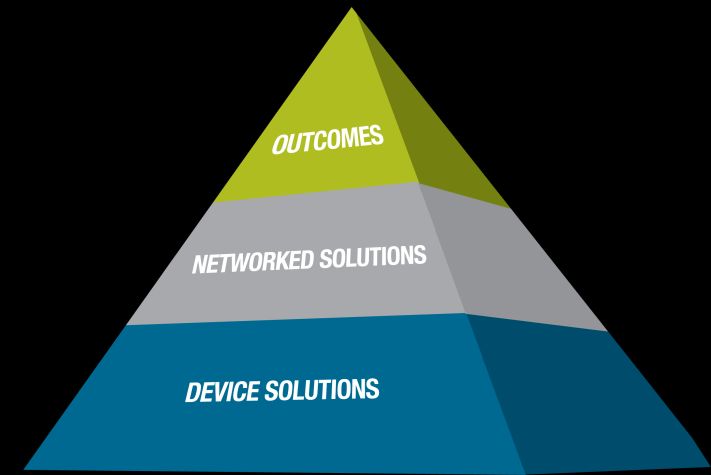
©2021 ITRON PROPRIETARY Itron Investor Presentation 2021 | 8OUR MODEL SUPPORTS CRITICAL INFRASTRUCTURE
Solutions via open standards-based technology that transcend multiple verticals
TARGET
DEVICES
BROADER
BILLIONS
Rapid/profitable growth… INDUSTRIAL INTERNET OF THINGS
HIGHER
Value & reach expansion GROWTH
100s OF
MILLIONS SMART CITY INFRASTRUCTURE
Network coverage … INCREASING
10s OF
Footprint expansion MARGINS
MILLIONS SMART UTILITY NETWORKS
High quality…
OPEN, SECURE, STANDARDS BASED,
Margin expansion PLATFORM
Supporting our customers critical infrastructure by creating intelligent touchpoints!
©2021 ITRON PROPRIETARY Itron Investor Presentation 2021 | 9OUR STRATEGIC PRIORITIES
1 EXPANDING OUR FOOTPRINT
Increasing coverage
2 EXPANDING OUR VALUE
Empowering our customers
3 EXPANDING OUR REACH
Enabling as many sensors & devices on our platform as possible
CREATING THE OPPORTUNITY TO ENHANCE VALUE WITH…..
OPERATIONAL LEVERAGE IMPROVING
FREE CASH FLOW INCREASING
TECHNOLOGY LEADERSHIP
©2021 ITRON PROPRIETARY Itron Investor Presentation 2021 | 10OUR INVESTMENT DRIVES INDUSTRY INNOVATION
Global Design & Research Centers Investment Strategy
» Intense Focus on Utilities and Municipalities
» Solution Centric Prioritization
» Global Technology Platforms to Maximize Re-use Potential
» Global Centers of Excellence
Itron Segment R&D Investment Innovation Priorities
As a % of Segment Revenue
Outcomes
& Corporate Outcomes » Invest in solutions that increase customer outcomes success
Platform
2020
& Corporate
Platform
Target Outcomes
& Corporate
Company R&D as a % of Total Revenue 9% 8-9% Platform
» Grow Distributed Intelligence solutions and Itron apps store
Outcomes 11%
Networked Solutions
Networked 8%
Networked Networked » Invest in next generation network & robust partner ecosystem
Device Solutions 4%
Devices Devices Devices
» Global device sensor and control platform
©2021 ITRON PROPRIETARY Itron Investor Presentation 2021 | 11OUR TECHNOLOGY IS INDUSTRY LEADING
PROVEN Proven solutions drive shorter development, integration
SOLUTIONS and deployment times
CUSTOMER Technology is not enough—deep engagement with
ENGAGEMENT customers is critical to ensure benefits are realized
MULTI-APPLICATION Deploying a unified platform decreases systems integration
PLATFORM complexities and accelerates benefit capture
INTEROPERABILITY Standards based technologies decreases deployment
complexity and ensures timely benefit delivery
©2021 ITRON PROPRIETARY Itron Investor Presentation 2021 | 12OUR OPEN PLATFORM IS A DIFFERENTIATOR
Over +250 Partners and counting across Energy, Water, and Smart City Infrastructure
DISTRIBUTED ENERGY GRID METERING
MANAGEMENT MANAGEMENT SOLUTIONS
SMART UTILITY IOT NETWORKING & DISTRIBUTED INTELLIGENCE
CITIES SOLUTIONS COMMUNICATIONS APPLICATIONS
©2021 ITRON PROPRIETARY Itron Investor Presentation 2021 | 13OUR SOLUTIONS MANAGE CRITICAL INFRASTRUCTURE
Itron connects critical infrastructure and enables outcomes via our platform
ITRON ENABLES OUTCOMES:
» Smart Energy
» Smart Water
» Smart Streetlighting
» Distribution Automation
» Renewable Energy Management
» Electric Vehicle Management
» Smart City Solutions
Multi-application, Multi-tenant Platform Distribution Automation and Demand Response
Device Agnostic for Energy, Water & Smart City Advanced Grid Control & Distributed Energy Management with
Management with Data Analytics on One Network Demand Response Capabilities
Advanced Metering Infrastructure Streetlight Canopy
Two-way, Transport Agnostic, Communications Intelligent Lighting & Increased Network Coverage & Resiliency
Distributed Intelligence Smart City Solutions
Delivering Intelligence and Applications to the Edge Connecting Communities to Outcomes such as Safety, Traffic, Smart
of the Network for Demand Response & More Parking, Intelligent Transport, Kiosks, and Environmental Sensors
Electric Vehicle Management Services & Analytics
Enabling Insight and Control over EV proliferation Solving Problems & Delivering Valuable Outcomes
©2021 ITRON PROPRIETARY Itron Investor Presentation 2021 | 14ITRON EXPANDS BUSINESS CASE VALUE
Our intelligent platform enables increased benefits by adding applications
AVERAGE NORTH AMERICAN SMART
75 GRID BUSINESS CASE* 75
$/customer, electric only, PV over 20 years60
60
90 90
DI DI
100 100
SL 22 SL
EE 30 EE
30 290 290
15
22 DR 15 DR
30
100 100
30
DA DA
AMI AMI
300 330 300 330
Cost Benefits Cost Benefits
B/C ratio: ~1.1 B/C ratio: ~1.9
Operational benefits from AMI are now nearing breakeven Distributed applications create additional benefits and
new business model opportunities
Note: Based on publicly available U.S. smart grid business/rate cases and includes Itron internal estimates.
AMI: Advanced Metering Infrastructure; DA: Distribution Automation; CVR: Conservation Voltage Reduction; DR: Demand Response; EE: Energy Efficiency (Portal); SL: Streetlights; DI: Distributed Intelligence Apps
©2021 ITRON PROPRIETARY Itron Investor Presentation 2021 | 15Business Performance
STATE OF THE BUSINESS
Q4’20 and FY’2020 performance impacted by COVID-19
»   Revenue and Gross Margin impacted by COVID-19 with reduced demand and factory under utilization
»   Sufficient liquidity to fund operations with cash and equivalents of $207 million
»   Record backlog of $3.3B and strong 12-month backlog of $1.2B as of Dec 31, 2020

Outlook improving with the speed of recovery mixed by geography
»   Our focus is the health and safety of our employees while supporting our customers recovery
»   Customers working toward recovery is mixed by region; Slowly improving toward future growth
»   Provided 2021 guidance for return to growth and improved profitability

Delivering on our long-term strategy
»   Announced 2020 restructuring plan to drive additional $25M in cost savings
»   Leadership in smart energy and smart city solutions with a Multi-tenancy, Distributed Intelligence Platform
»   Continued investment in technology for automation; resilience & reliability; and higher margin outcomes

       ©2021 ITRON PROPRIETARY                                                            Itron Investor Presentation 2021 | 17
BOOKINGS AND BACKLOG
$3.3
$3.2
» Book to bill of 1.9 in Q4 and 1.02 for FY’20 $3.0
$2.9
$2.8
» Record Q4’20 bookings of $973M
» Record backlog of $3.3B
$1.5
$1.3 $1.3 $1.2
$1.1
» 12-month backlog of $1.2B
» Timing of new deployments affected by COVID-19
Q4'19 Q1'20 Q2'20 Q3'20 Q4'20
12-Month Backlog Total Backlog
Chart in Billions, actual currency rates.
©2021 ITRON PROPRIETARY Itron Investor Presentation 2021 | 18Q4’20 SUMMARY
Revenue Year-Over-Year Bridge
» COVID-19 related constraints impact revenue
and margin; Spend controls and elimination of
variable compensation help offset
» Revenue of $525M down 16% from 2019
» Gross margin of 28.3%
» Adj EBITDA of $56M / 11% of revenue Non-GAAP EPS Year-Over-Year Bridge
» Non-GAAP EPS of $0.65
» Free cash flow of $29M
©2021 ITRON PROPRIETARY Itron Investor Presentation 2021 | 19FULL YEAR 2020 SUMMARY
Revenue Year-Over-Year Bridge
» 2020 results impact by the COVID-19 pandemic
» Revenue of $2.2B down 13% from 2019
» Gross margin of 27.7%
» Adj EBITDA of $178M / 8% of revenue
Non-GAAP EPS Year-Over-Year Bridge
» Non-GAAP EPS of $1.85
» Free cash flow of $63M
©2021 ITRON PROPRIETARY Itron Investor Presentation 2021 | 20DEBT AND LIQUIDITY OVERVIEW
US$M
$936
Delevering Actions in Q4’20
$805 » Repaid $400M revolving credit facility
$729
$536
» Prepaid $14M on Term Loan
» No debt payments due in 1H’21
Debt
$400
» Net leverage-street 4.1x at end of Q4’20
Total Debt Net Debt
» Term Loan due 2024 and Senior Notes 2026
» Blended interest rate of 3.0%
Senior Notes Term Loan
Leverage Snapshot Q4’20 Free Cash Flow and Liquidity
Net Leverage – Street 4.1x » Free cash flow of $29M
Net Leverage – Bank 2 3.6x » $435M available revolving credit facility
» Cash and equivalents was $207M
1. Total debt as of end of Q4’20. Excludes unamortized prepaid debt fees.
2. Bank Covenant for Q4’20 is 4.75x Net Leverage using the “Bank” calculation
©2021 ITRON PROPRIETARY Itron Investor Presentation 2021 | 21Financial Perspectives
ITRON INVESTMENT THESIS

  POSITIONED TO NAVIGATE NEAR-TERM                                 BUILT FOR THE LONG-TERM

               Support a Resilient Industry
               with Critical Utility and Smart                         Improving Operating Leverage
                    City Infrastructure                                    and Earnings Power

Only U.S.-based Industrial           Sufficient Liquidity       Positioned for            ESG Principles
     IoT “pureplay”                and no Debt payments     Free Cash Flow Growth        Embedded in DNA
     in our industry                   due in 1H 2021

      ©2021 ITRON PROPRIETARY                                                          Itron Investor Presentation 2021 | 23
FOCUSED ON GROWTH AND MARGIN EXPANSION
GROWTH IN OUR HIGHER OPERATIONAL LEVERAGE CASH FLOW
MARGIN SOLUTIONS WITH MOVE TO AN ASSET OPTIMIZATION
LIGHT MODEL
©2021 ITRON PROPRIETARY Itron Investor Presentation 2021 | 24FINANCIAL OPERATING PERSPECTIVE
Multiple levers driving long-term financial benefits and increased earnings power
Opportunity
• Higher value solutions driving growth
REVENUE • Continue rotation to higher margin segments
• New product introductions in SaaS solutions More Less
SUPPLY • Product rationalization and value engineering
CHAIN • Manage component & commodity cycles
• Continue shifting towards more strategic outsourcing More Less
OPERATIONAL • Rationalization of manufacturing and service delivery
LEVERAGE • Optimizing our product portfolio
• Growth of recurring revenue in the Outcomes business More Less
OPEX • Unified global sales organization
EFFICIENCIES • Disciplined discretionary spending
• Restructuring benefits & integration synergies
More Less
OPERATING MARGIN Initiatives will continue to drive significant margin improvement
©2021 ITRON PROPRIETARY Itron Investor Presentation 2021 | 25CAPITAL ALLOCATION STRATEGY
Focus on de-leveraging and investment in our business
NEAR-TERM
CAPITAL
DEPLOYMENT
FRAMEWORK
ORGANIC CAPITAL
DE-LEVER INVESTMENT ALLOCATION
✓ Repaid full revolver ✓ Continuing shift to asset- ✓ Potential, opportunistic M&A
light business model possible though nothing
✓ Anticipate sufficient cash
currently planned
flow for de-levering ✓ R&D fully expensed and
reflected in existing margin
profile
©2021 ITRON PROPRIETARY Itron Investor Presentation 2021 | 26ITRON OPERATING MODEL
Rotation to higher margin contribution and increased free cash flow
Target Operating
Model
Revenue 3 to 5% CAGR
Gross Margin 33 to 35%
OPEX 22 to 23%
of Revenue
Adjusted EBITDA 13 to 15%
of Revenue
Free Cash Flow 6 to 8%
of Revenue
Net Debt to Adj. EBITDA Ratio 3x to 2x
Other key estimate assumptions: No M&A or additional restructuring projects not previously announced.
©2021 ITRON PROPRIETARY Itron Investor Presentation 2021 | 272021 GUIDANCE
» Revenue of $2.23 – $2.33 billion
» ~5% growth at the midpoint
» Non-GAAP diluted EPS of $2.15 – $2.55
» ~27% growth at the midpoint
Assumptions:
o Euro/USD of $1.20
o Effective non-GAAP tax rate of ~30%
o Non-GAAP interest expense of ~$36 million
o Average diluted shares outstanding of ~41 million
©2021 ITRON PROPRIETARY Itron Investor Presentation 2021 | 28Appendix
CONSOLIDATED GAAP RESULTS: Q4’20
            $ in Millions (except per share amounts)                                         Q4 2020   Q4 2019        Change
            Revenue                                                                          $525.2    $628.4           -16%
                Change in constant currency                                                                              -18%

            Gross margin                                                                     28.3%     28.2%          +10 bps
            Operating income                                                                  $32.6     $28.9           +13%
            Net income attributable to Itron, Inc.                                            $21.5     $14.6           +47%
            Earnings per share - diluted                                                      $0.53     $0.36           +47%

» Revenue down primarily due to the timing of customer projects and continuing operating constraints resulting from COVID-19

» GM of 28.3% was up 10 bps due to mix of higher-margin software license sales, partially offset by increased inventory reserves

» GAAP operating income and net income increased due to lower discretionary spending and variable compensation

 Reconciliation of GAAP to Non-GAAP results in Appendix and also available on our website.

               ©2021 ITRON PROPRIETARY                                                                           Itron Investor Presentation 2021 | 30
CONSOLIDATED GAAP RESULTS: FY’20
$ in Millions (except per share amounts) FY 2020 FY 2019 Change
Revenue $2,173.4 $2,502.5 -13%
Growth in constant currency -13%
Gross margin 27.7% 30.1% -240 bps
Operating income ($10.4) $132.7 NM
Net income attributable to Itron, Inc. ($58.0) $49.0 NM
Earnings per share - diluted ($1.44) $1.23 NM
» Revenue down due to customer demand and operating constraints resulting from COVID-19
» Gross margin of 27.7% decreased 240 bps primarily due to COVID-19 induced operating inefficiencies and increased
inventory reserves
» GAAP operating income decreased due to lower gross profit, a $60M loss on sale of business related to the divestiture of
Itron’s manufacturing and sales operations in Latin America, and $37M restructuring expense was partially offset by lower
variable compensation and other opex controls
Reconciliation of GAAP to Non-GAAP results in Appendix and also available on our website.
©2021 ITRON PROPRIETARY
DRAFT Q4 2020 Earnings Conference Call | 31DEVICE SOLUTIONS SEGMENT: Q4’20
Revenue, gross margin and operating margin
$ in Millions, actual currency
$206
$186 Revenue down 10% and 13% in constant currency
» Decrease primarily due to reduced customer demand
in EMEA
» COVID-19 related delays
» Latin America transaction
14.6%
11.8%
Gross margin down 280 bps
» Due to COVID-19 induced operational inefficiencies
» Increased inventory reserves and special warranty
7.8% 6.8%
Operating margin down 100 bps
Q4'19 Q4'20 » Fall through of lower gross margin
Revenue Gross Margin Operating Margin » Partially offset by lower operating expenses
©2021 ITRON PROPRIETARY Itron Investor Presentation 2021 | 32DEVICE SOLUTIONS SEGMENT
Improving our profitability
$M
Market Position
Standard Meter Shipments Endpoints Electric, Gas, Water 2020*
Device Target Model
Revenue Growth
-5 to -3% CAGR
Gross Margin
20 to 25%
*Source: In year 2020 reported in Omdia Research - Global Electricity, Gas
and Water Metering Reports, 2020 Editions (Excludes China)
Full Year 2020 Performance Segment Strategic & Product Focus
» Revenue down 19% as reported and in constant currency » Optimize product portfolio to drive improved margins
• Decrease primarily due to COVID-19
• Latin America transaction
» Gross margin down 530 bps » Opportunistically leverage products across geographies
• COVID-19 induced operating inefficiencies & product mix
• Increased inventory reserves » Selectively target markets for high-margin, value-creation products
» Operating margin down 550 bps
• Fall through of lower gross profit
©2021 ITRON PROPRIETARY Itron Investor Presentation 2021 | 33EVOLUTION OF OUR GLOBAL DEVICE PLATFORM
TODAY
2000 2005 2010 2021
Purchased US Electric business Purchased Int’l Electric, Gas, Water Benefits of a
from Schlumberger in 2003 Meter Business from Actaris in 2007
Global Platform
US Solid State International
» Reduced factory and
Meters
capital capacity needed
» Lower resources and
Electric Meter Entered US Market with Itron’s last US Analog meter shipped in 2005; Solid Global GenX
expense needed to
numerous versions 100% Analog / State and Smart Spec large part of portfolio. Electric Platform
Market Mechanical 70% solid state and 30% mechanical 100% solid state maintain the platform
» Easy to modify for
market specific
Gas Meter communications
Market Global Supplier of market and size Intelis Gas Platform is100% Static
specific versions 100% Mechanical Active in Int’l & NAM
» Smaller, more efficient
compact design than
current meter forms
» Streamlined supply
chain, simpler variety
Water Meter Itron strong International Water Intelis Water Platform is 100% Static
of form factors
Market & 100% Mechanical / Active in Int’l / Pilot in US
Market Only Network models in NAM
©2021 ITRON PROPRIETARY Itron Investor Presentation 2021 | 34NETWORKED SOLUTIONS SEGMENT: Q4’20
Revenue, gross margin and operating margin
$ in Millions, actual currency
$369
Revenue down 25% as reported and in constant currency
$277
» Timing of customer deployments
» COVID-19 related delays
» Projected low point for Networked Solutions
36.2%
35.3%
Gross margin up 90 bps
» Improved efficiencies in implementation and maintenance services
26.7% Operating margin down 120 bps
25.5%
» Reduced operating leverage
Q4'19 Q4'20
Revenue Gross Margin Operating Margin
©2021 ITRON PROPRIETARY Itron Investor Presentation 2021 | 35NETWORKED SOLUTIONS SEGMENT
Expanding our footprint
$M Market Position
Networked Solutions Cumulative Share Americas 2020*
Networked Endpoints Distribution Smart
Electric / Gas / Water Automation Streetlights
Networked Target Model (US Only)
Revenue Growth
+7 to +9% CAGR
Gross Margin
35 to 40%
Full Year 2020 Performance Segment Strategic & Product Focus
» Revenue down 12% as reported and in constant currency
» Grow total share of connected communicating endpoints
• Timing of customer deployments
• Decrease primarily due to COVID-19 related project delays
» Gross margin down 200 bps » Expand solutions across utilities and smart cities
• Primarily due to COVID-19 induced operating inefficiencies
• Unfavorable product mix » Invest in next generation network & robust partner ecosystem
» Operating margin down 330 bps
• Fall through of lower gross profit *Source: Scott Report (Networked Endpoints)- AMR-AMI Deployments in North America – Q2 2020
Northeast Group (DA) - US Smart Grid-Market Forecast 2019-2028
• Increased investment in product development Northeast Group (Smart SL) - Global Smart Street Lighting & Smart Cities-Market Forecast 2020-2029
©2021 ITRON PROPRIETARY Itron Investor Presentation 2021 | 36OUR SMART PLATFORM PROPOSITION
An intelligent Industrial IoT platform that is solution, device and transport agnostic
BEYOND SMART. ACTIVE.
» Strong foundation with backwards compatibility
ENDPOINT
» Multi-endpoint networking + distributed intelligence
» One network with multi-solution capabilities
» Highly-integrated, transport-agnostic platform
TRANSPORT
» High-resolution data management; enabling near real-time
decision making; integrating an ecosystem of over 250 partners
PROVEN AT OPEN RESILIENT AND FUTURE PROOF A TRUSTED
SOLUTION SCALE ECOSYSTEM TECHNOLOGY PARTNER
SECURE
©2021 ITRON PROPRIETARY Itron Investor Presentation 2021 | 37OUTCOMES SEGMENT: Q4’20
Revenue, gross margin and operating margin
$ in Millions, actual currency
$61
$54 Revenue up 14% and 13% in constant currency
» Increase in software license sales
42.9% » One time customer adjustment recorded in prior year
32.2% Gross margin up 10.7 pts
» Increase in higher-margin software license sales
» One time customer adjustment recorded in prior year
29.6%
Operating margin up 14.3 pts
15.3%
» Fall through from higher gross profit
» Reduced discretionary spending
Q4'19 Q4'20
Revenue Gross Margin Operating Margin
©2021 ITRON PROPRIETARY Itron Investor Presentation 2021 | 38OUTCOMES SEGMENT
Expanding our value
$M Itron Endpoints Under Management
74M
Outcomes Target Model 65M
48M
Revenue Growth
+10 to +15% CAGR
Gross Margin
40 to 45% 2018 2019 2020
» >74M connected endpoints under management
» ~3M distributed intelligence enabled endpoints deployed
Full Year 2020 Performance Segment Strategic & Product Focus
» Revenue +2% as reported and in constant currency
» Leverage networked solutions footprint
• Increase in software license and services
• One time customer adjustment recorded in prior year
» Gross margin flat » Invest in innovative solutions with distributed intelligence
• Increase in higher margin software license sales
• One time customer adjustment recorded in prior year » Provide end-to-end managed services leveraging portfolio and partners
• Offset by higher costs
» Operating margin +130 bps
• Reduced discretionary spending
©2021 ITRON PROPRIETARY Itron Investor Presentation 2021 | 39WHAT IS AN OUTCOME?
Outcomes are actions based on insights from data management and analysis
Customer “consumer” engagement
EXAMPLE: Engage consumers to reduce load by adjusting a smart thermostat
Operations management
EXAMPLE: Analyze data to detect and locate a leak
Information management
EXAMPLE: Organize AMI data to provide consumer billing
Rich set of data from the network
EXAMPLE: Meter consumption data set
Capitalizing on connected endpoint data
©2021 ITRON PROPRIETARY Itron Investor Presentation 2021 | 40NON-GAAP FINANCIAL MEASURES
To supplement our consolidated financial statements presented in accordance with GAAP, we use certain non-
GAAP financial measures, including non-GAAP operating expense, non-GAAP operating income, non-GAAP net
income, non-GAAP diluted EPS, adjusted EBITDA, adjusted EBITDA margin, constant currency and free cash flow.
We provide these non-GAAP financial measures because we believe they provide greater transparency and
represent supplemental information used by management in its financial and operational decision making. We
exclude certain costs in our non-GAAP financial measures as we believe the net result is a measure of our core
business. The company believes these measures facilitate operating performance comparisons from period to
period by eliminating potential differences caused by the existence and timing of certain expense items that would
not otherwise be apparent on a GAAP basis. Non-GAAP performance measures should be considered in addition
to, and not as a substitute for, results prepared in accordance with GAAP. Our non-GAAP financial measures may
be different from those reported by other companies. We strongly encourage investors and shareholders to review
our financial statements and publicly-filed reports in their entirety and not to rely on any single financial measure. A
more detailed discussion of why we use non-GAAP financial measures, the limitations of using such measures, and
reconciliations between non-GAAP and the nearest GAAP financial measures are included in the quarterly earnings
press release.
©2021 ITRON PROPRIETARY Itron Investor Presentation 2021 | 41GAAP TO NON-GAAP RECONCILIATIONS ©2021 ITRON PROPRIETARY Itron Investor Presentation 2021 | 42
GAAP TO NON-GAAP RECONCILIATIONS

  ©2021 ITRON PROPRIETARY          Itron Investor Presentation 2021 | 43
CONSOLIDATED NON-GAAP & CASH RESULTS – Q4’20
            $ in Millions (except per share amounts)                                                Q4 2020   Q4 2019        Change
            Non-GAAP operating income                                                               $43.6      $46.5            -6%
            Non-GAAP operating margin                                                                8.3%      7.4%          +90 bps
            Adjusted EBITDA                                                                         $55.5      $56.8            -2%
            Adjusted EBITDA margin                                                                  10.6%      9.0%          +160 bps
            Non-GAAP net income attributable to Itron, Inc.                                         $26.3      $28.9            -9%
            Non-GAAP earnings per share - diluted                                                   $0.65      $0.72           -10%
            Net cash provided by operating activities                                               $38.9      $44.7           -13%
            Free cash flow                                                                          $29.0      $28.6           +2%

      » Non-GAAP op inc and adj EBITDA decreased due to lower gross profit, partially offset by lower discretionary spending
        and variable compensation
      » Non-GAAP net income decreased primarily due to lower non-GAAP operating income
      » Free cash flow increased with reduced capital expenditures offsetting lower operating cash flow

Reconciliation of GAAP to Non-GAAP results in Appendix and also available on our website.

               ©2021 ITRON PROPRIETARY
                                                                                            DRAFT                       Itron Investor Presentation 2021 | 44
CONSOLIDATED NON-GAAP & CASH RESULTS: FY’20
$ in Millions (except per share amounts) FY 2020 FY 2019 Change
Non-GAAP operating income $132.1 $232.4 -43%
Non-GAAP operating margin 6.1% 9.3% -320 bps
Adjusted EBITDA $178.4 $270.0 -34%
Adjusted EBITDA margin 8.2% 10.8% -260 bps
Non-GAAP net income attributable to Itron, Inc. $75.3 $132.8 -43%
Non-GAAP earnings per share - diluted $1.85 $3.32 -44%
Net cash provided by operating activities $109.5 $172.8 -37%
Free cash flow $63.3 $112.1 -44%
» Non-GAAP operating income and adj EBITDA decreased due to lower gross profit resulting from COVID-19 impact, partially
offset by lower variable compensation and other opex controls
» Non-GAAP net income decreased primarily due to lower non-GAAP operating income
» Free cash flow of $63M decreased from the prior year due to lower profitability, partially offset by improved working capital
Reconciliation of GAAP to Non-GAAP results in Appendix and also available on our website.
©2021 ITRON PROPRIETARY
DRAFT Q4 2020 Earnings Conference Call | 45ITRON ACRONYM GLOSSARY
AMI = Advanced Metering Infrastructure GENX = Generation 2, 3, 4, and 5 of the Silver Spring O&M = Operation and Maintenance
Networks platform OWR = OpenWay Riva
AMM = Advanced Metering Manager, SSNI Product Name
GDPR = General Data Protection Regulation PaaS = Platform as a Service
AMR = Automated Meter Reading
IaaS = Infrastructure as a Service PBU = Product Business Unit
ASP = Average Selling Price
IEC = International Electrotechnical Commission PCBA = Printed Circuit Board Assembly
AP = Access Point
IMP = Itron Mobile Platform PLC = Power Line Carrier
BOM = Bill of Material(s)
INS = Itron Networks Segment RF = Radio Frequency
BYOD = Bring Your Own Device
IOU = Investor Owned Utility RPMA = Random Phase Multiple Access
BYOT = Bring Your Own Thermostat
IoT = Internet of Things S & OP = Sales and Operations Planning
C & I = Commercial and Industrial
LoRa = “LOng RAnge” (Marketing Alliance) S & OE = Sales and Operations Execution
CAGR = Compounded Annual Growth Rate
LPWAN = Low Power Wide Area Network SaaS = Software as a Service
CCE = Commercial and Customer Enablement
LTE = Long Term Evolution SLV = Streetlight Vision
CDMA = Code Division Multiple Access
M2C = Meter to Cash SS = Spread Spectrum
CGR = Connected Grid Router
M2M = Machine to Machine TAM = Total Available Market
CM = Contract Manufacturer / Manufacturing
MDM = Meter Data Management TDMA = Time Division Multiple Access
DA = Distribution Automation
MV = Multi Vender TCO = Total Cost of Ownership
DEM = Distributed Energy Management
NaaS = Network as a Service TMC = Total Manufacturing Cost
DER = Distributed Energy Resources
NB-IoT = Narrow Band Internet of Things UIQ = Utility IQ, Product Name
DERMs = Distributed Energy Resource Management
NEMA = National Electrical Manufacturers Association Wi-Fi = Wireless Fidelity
DI = Distributed Intelligence
NIC = Network Interface Card WW = World Wide
DNO = Device Solutions, Networked Solutions, Outcomes
NMS = Network Management System VAVE = Value Analysis and Value Engineering
EDI = Electronic Data Interchange
OaaS = Outcome as a Service VVO = Voltage Var Optimization
ERP = Enterprise Resource Planning
OCOGS = Operating Cost of Goods Sold
ERT = Encoder Receiver Transmitter
OFDM = Orthogonal Frequency Division Multiplexing
FAN = Field Area Network
©2021 ITRON PROPRIETARY Itron Investor Presentation 2021 | 46INVESTOR RELATIONS CONTACTS
Kenneth P. Gianella
Vice President, Investor Relations
669-770-4643
ken.gianella@itron.com
Thank You Rebecca Hussey
Manager, Investor Relations
509-891-3574
rebecca.hussey@itron.com
www.itron.comYou can also read