Investor Presentation - September 2016 (updated) - Galp
←
→
Page content transcription
If your browser does not render page correctly, please read the page content below
Investor
Presentation
September 2016 (updated)

Cautionary Statement                                                                                                                                                                                                                                         2

By attending or reading this presentation, you acknowledge and agree to be bound by the following limitations and restrictions. This presentation has been prepared by Galp Energia, SGPS, S.A. (“Galp” or the “Company”) and may be amended
and supplemented, but may not be relied upon for the purposes of entering into any transaction. This presentation is strictly confidential, is being distributed to a limited range of persons solely for their own information and may not (i) be
distributed to the media or disclosed to any other person in any jurisdiction, nor (ii) be reproduced in any form, in whole or in part, without the prior written consent of the Company.

Although the Company has taken reasonable care in preparing the information contained herein, no representation, warranty or undertaking, express or implied, is made as to, and no reliance should be placed on, the fairness, accuracy,
completeness or correctness of the information or the opinions contained herein or any other material discussed at the presentation. Neither the Company nor any of its affiliates, subsidiaries, shareholders, representatives, agents, employees or
advisors shall have any liability whatsoever (including in negligence or otherwise) for any loss or liability howsoever arising from any use of this presentation or its contents or any other material discussed at the presentation or otherwise arising
in connection with this presentation.

This presentation does not constitute or form part of and should not be construed as, an offer to sell or issue or the solicitation of an offer to buy or otherwise acquire securities of the Company or any of its subsidiaries or affiliates in any
jurisdiction or an inducement to enter into investment activity in any jurisdiction. Neither this presentation nor any part thereof, nor the fact of its distribution, shall form the basis of, or be relied on in connection with, any contract or
commitment or investment decision whatsoever in any jurisdiction.

This presentation is made to and directed only at persons (i) who are outside the United Kingdom, (ii) having professional experience in matters relating to investments falling within Article 19(5) of the Financial Services and Markets Act 2000
(Financial Promotions) Order 2005 (the "Order") or (iii) high net worth entities, and other persons to whom it may lawfully be communicated, falling within Article 49(2)(a) to (d) of the Order (all such persons together being referred to as
"Relevant Persons"). This presentation must not be acted or relied on by persons who are not Relevant Persons.

Neither this presentation nor any copy of it, nor the information contained herein, in whole or in part, may be taken or transmitted into, or distributed, directly or indirectly in or to the United States. Any failure to comply with this restriction
may constitute a violation of U.S. securities laws. No securities of the Company have been registered under the United States Securities Act of 1933 or the securities laws of any state of the United States, and unless so registered may not be
offered or sold except pursuant to an exemption from, or in a transaction not subject to, the registration requirements of the Securities Act and applicable state securities laws.

Matters discussed in this presentation may constitute forward-looking statements. Forward-looking statements are statements other than in respect of historical facts. The words “believe”, “expect”, “anticipate”, “intends”, “estimate”, “will”,
“may”, "continue”, “should” and similar expressions usually identify forward-looking statements. Forward-looking statements may include statements regarding: objectives, goals, strategies, outlook and growth prospects; future plans, events or
performance and potential for future growth; liquidity, capital resources and capital expenditures; economic outlook and industry trends; energy demand and supply; developments of Galp’s markets; the impact of regulatory initiatives; and the
strength of Galp’s competitors. The forward-looking statements in this presentation are based upon various assumptions, many of which are based, in turn, upon further assumptions, including without limitation, management’s examination of
historical operating trends, data contained in the Company’s records and other data available from third parties. Although Galp believes that these assumptions were reasonable when made, these assumptions are inherently subject to
significant known and unknown risks, uncertainties, contingencies and other important factors which are difficult or impossible to predict and are beyond its control. No assurance, however, can be given that such expectations will prove to
have been correct. Important factors that may lead to significant differences between the actual results and the statements of expectations about future events or results include the Company’s business strategy, industry developments,
financial market conditions, uncertainty of the results of future projects and operations, plans, objectives, expectations and intentions, among others. Such risks, uncertainties, contingencies and other important factors could cause the actual
results of Galp or the industry to differ materially from those results expressed or implied in this presentation by such forward-looking statements.

Actual future results, including financial and operating performance; demand growth and energy mix; Galp’s production growth and mix; the amount and mix of capital expenditures; future distributions; resource additions and recoveries;
project plans, timing, costs, and capacities; efficiency gains; cost savings; integration benefits; product sales and mix; production rates; and the impact of technology could differ materially due to a number of factors. These include changes in
oil or gas prices or other market conditions affecting the oil, gas, and petrochemical industries; reservoir performance; timely completion of development projects; war and other political or security disturbances; changes in law or government
regulation, including environmental regulations and political sanctions; the outcome of commercial negotiations; the actions of competitors and customers; unexpected technological developments; general economic conditions, including the
occurrence and duration of economic recessions; unforeseen technical difficulties; and other factors.

The information, opinions and forward-looking statements contained in this presentation speak only as at the date of this presentation, and are subject to change without notice. Galp and its respective representatives, agents, employees or
advisors do not intend to, and expressly disclaim any duty, undertaking or obligation to, make or disseminate any supplement, amendment, update or revision to any of the information, opinions or forward-looking statements contained in this
presentation to reflect any change in events, conditions or circumstances.

Investor Presentation | September 2016
An integrated energy player                                                                                                                                  3

                                                                                                                          52 projects
                                                                                         Exploration &                    701 mmboe 2P reserves
                                                                                          Production                      45.8 kboepd WI production
                                                                                                                          €356 m Ebitda
                          €10.8 bn Market Cap

                                    €1.6 bn      Ebitda
                                                                                                                          330 kbopd refining capacity
                                                                                            Refining &                    114.6 mmboe processed
                                    €1.3 bn      Capex                                      Marketing                     9.1 mton sales to direct clients
                                                                                                                          €800 m Ebitda
                                   6.8 k Employees

                                         7% ROACE1                                                                        7.665 mm3 NG/LNG sales
                                                                                               Gas &                      12,533 km NG distribution network
                                                                                               Power                      4.636 GWh electricity sales
                                                                                                                          €381 m Ebitda

                                           1 ROACE of 7% on capital employed of €8.6 bn as of YE2015, including work in progress
Investor Presentation | September 2016
                                           (non-productive assets) of €2.1 bn.
                                           All figures relate to year end 2015, except market cap shown as end of August 2016.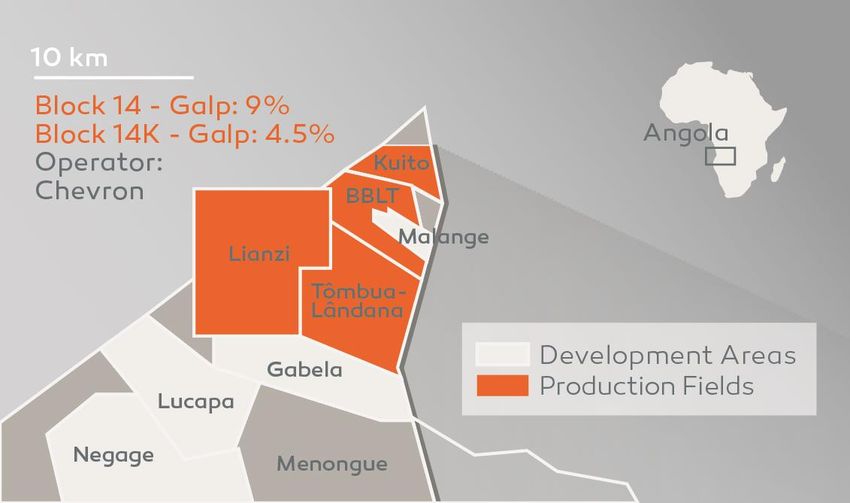
The 3E's approach                                                                       4

                           Execute              Extract             Explore

                        Focus on delivery    Unlock more value       Screening new
                         and profitability     from current        opportunities and
                                                  portfolio      portfolio management

Investor Presentation | September 2016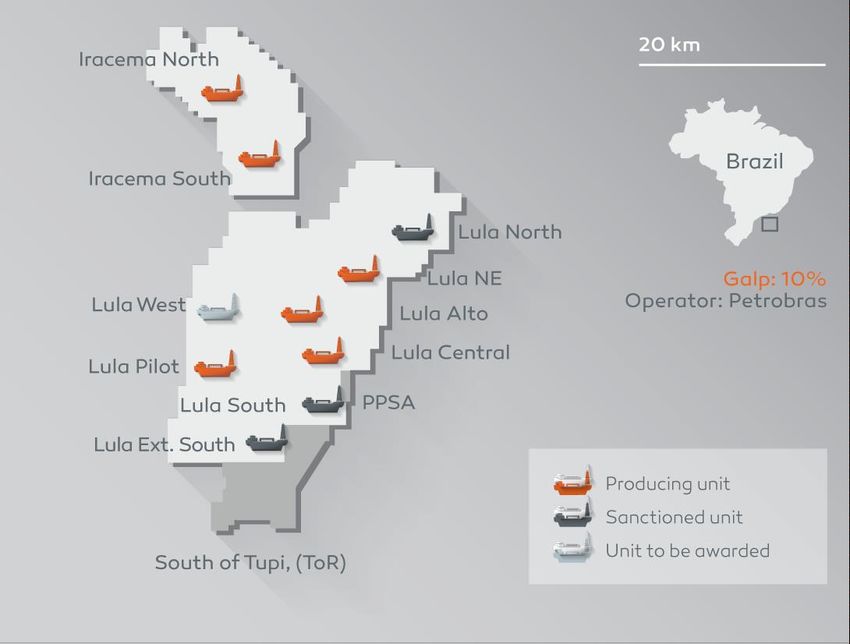
5

             Developing highly competitive upstream projects

             Extracting value from downstream and gas businesses

             Committed to a solid capital structure

             Delivering long term value to stakeholders

             Key takeaways

             Appendix

Investor Presentation | September 2016
Galp holds a unique upstream portfolio                                                  6

              Brazil                                                       Portugal
              6 sanctioned projects                            7 exploration licenses
              4 non-sanctioned projects
              17 exploration licenses
              Santos basin (8)
              Potiguar basin (7)
                                                                        East Timor
              Barreirinhas basin (4)                            1 exploration license
              Parnaíba basin (4)          Op.
              Pernambuco basin (2)
              Amazonas basin (1)
              Sergipe Alagoas (1)         Op.
                                                                      Mozambique
                                                           2 non-sanctioned projects
              São Tomé and Príncipe
              1 exploration license       Op.

                                                                            Angola
                                                              5 sanctioned projects
              Namibia                                      1 non-sanctioned project
              2 exploration licenses      Op.                 6 exploration licenses

                                          Op.   Operated
Investor Presentation | September 2016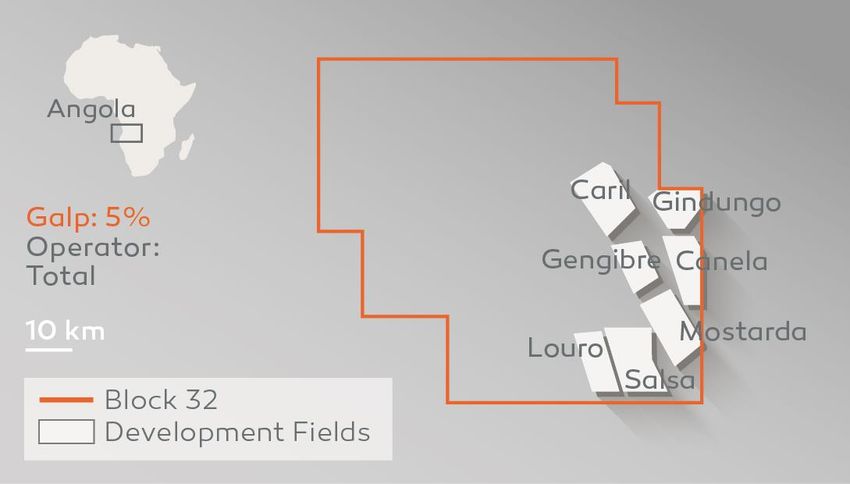
Executing world-class projects… 7
1999 2006 2009 2010 2013 2014 2015 2016
South America
FPSO #1 (CAR) FPSO #2 (CPY) FPSO #3 (CMB) FPSO #4 (CIT) FPSO #5 (CMR)
Lula Pilot Lula NE Iracema South Iracema North Lula Alto
(100 kbopd) (120 kbopd) (150 kbopd) (150 kbopd) (150 kbopd)
FPSO #6 (CSQ)
Lula Central
(150 kbopd)
Africa
Kuito field1 BBLT CPT TL CPT Lianzi field
Block 14 Block 14 Block 14 Block 14k
(100 kbopd) (130 kbopd) (through BBLT
CPT)
1Kuito FPSO decommissioned during 2013.
Investor Presentation | September 2016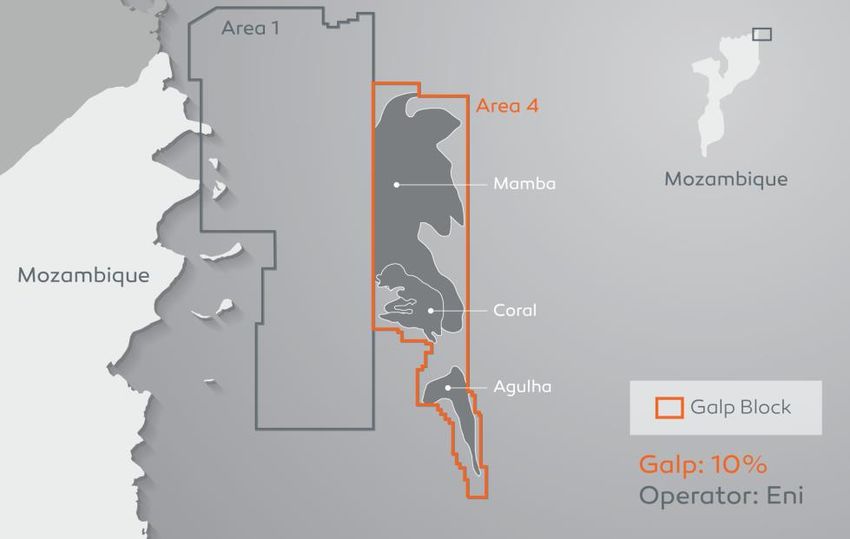
… and further to be delivered                                                                              8

                    2017                     2018              2019           2020           2020+

                  Lula South             Lula Ext South       Atapu 1          Sépia        Lula West
                Replicant FPSO           Replicant FPSO    Replicant FPSO   Leased FPSO
                  150 kbopd                 150 kbopd        150 kbopd
South America

                                                                                             Atapu 2
                                                                                          Replicant FPSO
                                                                                            150 kbopd
                  Lula North             Berbigão/Sururu
                Replicant FPSO           Replicant FPSO                                      Carcará
                  150 kbopd                 150 kbopd

                                                                                             Júpiter

                                                                                              Coral
Africa

                Kaombo North             Kaombo South
                  125 kbopd                 125 kbopd
                                                                                             Mamba

Investor Presentation | September 2016
Premium assets delivering production growth                                                                           9

Working interest production (kboepd)

                                  Execute + Extract                               Execute + Extract + Explore
                                   Sanctioned Projects

                                     Breakeven
Investing in competitive upstream projects 10
Technical costs1 ($/boe)
Reservoir characteristics and project scale
driving Brazil technical costs close to $15/boe
27
Potential from further capex and cost
22
optimisation
< 20
Lifting costs expected to be under $5/boe by
2020
2014 2015 2020E
Lifting costs Leasing costs DD&A
1Technical costs based on group working interest production (excludes royalties, overheads and oil taxes).
Investor Presentation | September 2016Lula/Iracema: delivering a world-class project 11
BM-S-11: Lula/Iracema
Six out of 10 FPSOs producing in 2016
96 wells drilled out of c.150 planned
Consortium technical skills and experience
supporting the development of this key asset
Investor Presentation | September 2016Lula/Iracema: outstanding productivity 12
Top pre-salt producer wells1 FPSO #1 production Oil recovery factor
(kboepd) (kbopd) (%)
100 Plateau ≈7 years
Lula 45.4
40%
Lula 43.7
Sapinhoá 40.1
Lula 40.0 28%
Jubarte 39.9
Lula 38.2
Sapinhoá 37.9
Sapinhoá 36.9
Lula 36.8
Lula 36.2
Lula 33.9 2010 2015 2020E Current recovery Ambition 2
Lula 33.6 factor
PoD 2010 Actual + Forecast
Each 1 p.p. increase in oil recovery results
in incremental c.200 mmbbl gross
1Source: ANP Jun-16.
2Note: Galp view.
Investor Presentation | September 2016Increasing efficiency in Lula/Iracema 13
Drilling and completion (#days) Ramp-up period of Lula/Iracema FPSOs
(#months)
18
239 15
13 13
110
75
2010 2015 Best performance FPSO #1 FPSO #2 FPSO #3 FPSO #4
and LT ambition
Benefiting from learning curve and optimising well FPSO #4 already producing at plateau, having achieved
designs full ramp-up in 13 months
Negotiating rig and subsea contracts FPSO #5 and FPSO #6 to reach full capacity
during 2017
Investor Presentation | September 2016De-risking other relevant projects in Brazil 14
Berbigão | Sururu | Atapu Carcará Júpiter | Sépia East
1
Significant resource base in a DST in Carcará North proved Sépia East DoC submitted and
challenging heterogeneous excellent reservoir productivity unitisation with Sépia (ToR, 100%
reservoir Petrobras) being prepared
DoC expected to be submitted in
Production in Berbigão/Sururu 2018 Júpiter appraisal campaign proved
expected by 2018 and Atapu 1 by large oil, natural gas and
early 2019 Extension of the discovery into condensates base, with DoC
open area to the North extended until 2021
1Petrobras announced the farm-out to Statoil in July 16.
Investor Presentation | September 2016Mozambique: Optimising initial development solutions 15
Area 4
Area 4 total GIIP volumes of c.85 Tcf
Dry gas in high quality reservoir
Mamba onshore LNG - 2x5 mtpa LNG trains (1st phase)
Unitisation process with Area 1 concluded in 2015
Finalising framework for common facilities
development
EPC proposals being evaluated
Coral FLNG - 1 FLNG (3.0-3.7 mtpa)
EPCIC contract under negotiation
LNG long-term gas offtake contract being finalised
PoD approved in February 2016
Investor Presentation | September 2016Angola: Optimising development projects 16
Blocks 14/14k Block 32
Four producing areas and two CPT platforms Ongoing drilling campaign
Lianzi production started during 2015 Two FPSO of 125 kbopd expected for 2017 and 2018
Implementation of cost reduction initiatives PSA fiscal terms renegotiated during 2015 and
potential for further cost reduction
Investor Presentation | September 201617
Developing highly competitive upstream projects
Extracting value from downstream and gas businesses
Committed to a solid capital structure
Delivering long term value to stakeholders
Key takeaways
Appendix
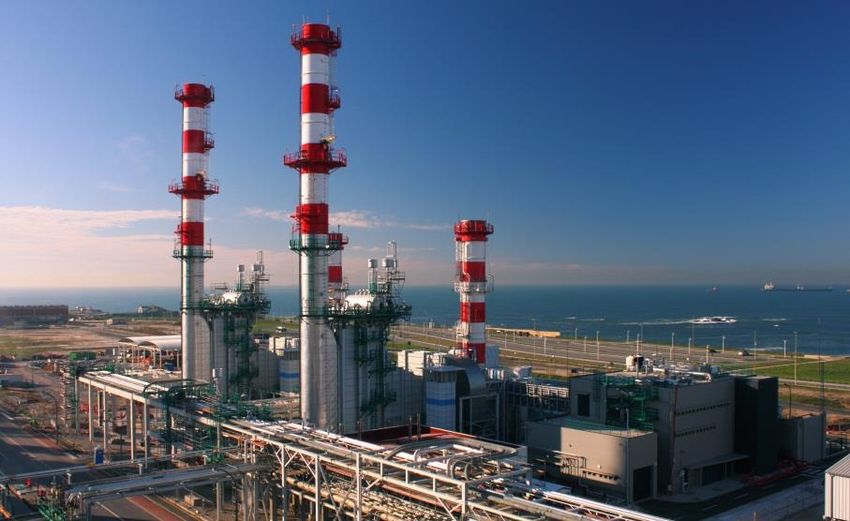
Investor Presentation | September 2016An efficient refining system capable of meeting market needs 18
Production profile and consumption in Iberia
Fully invested and competitive refining system
after €1.4 bn upgrade
14%
Focus on maximising energy efficiency and
26% optimising refining processes to achieve higher
refining margin
69% 83% Leveraging refineries’ location (European SW),
namely competitiveness to the U.S. market
5% 3%
Galp production yields Iberian oil market
Others Middle distillates Light distillates
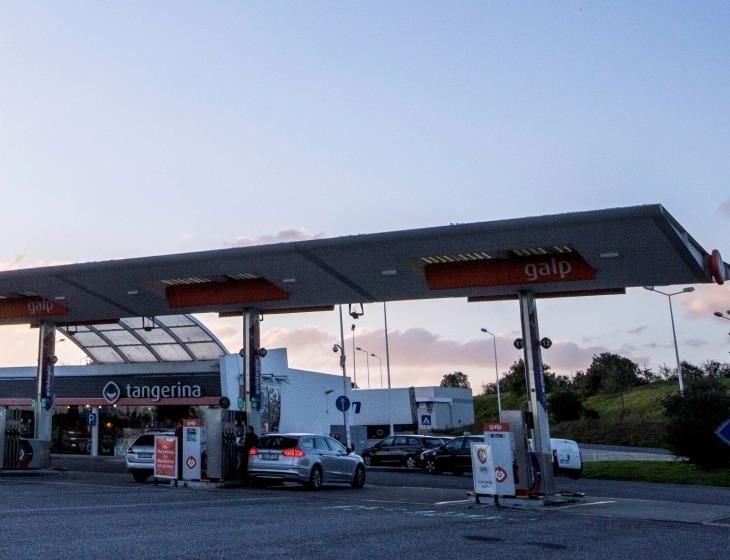
Investor Presentation | September 20163rd largest player in Iberia and a growing presence in Africa 19
Service station in Portugal
1,435 service stations, of which 138 service
stations across the African continent
Annual oil sales to direct clients of 9.1 mton, of
which around 8% sold in Africa
Improving refining and marketing integration
Stable contribution to Ebitda
Launched innovative tri-fuel offer in Iberia (oil
products, gas and electricity)
Investor Presentation | September 2016Downstream efficiency and margin optimisation 20
Galp refining margin improvements ($/bbl) Additional cost reduction in R&M (€m)
50 150
6.0
1.0
100
5.2 80
2.5 2.5
2015 2020 before Improvements 2020E Previous target 2015 Further New target
improvements impact by 2019 delivered efficiency by 2020
(2018+) efficiency
Benchmark refining margin
Investor Presentation | September 2016Building a sustainable NG and LNG portfolio 21
NG and LNG portfolio breakdown (bcm)
Expand and leverage client base
Portfolio
ambition
Other Diversify and increase sourcing
Spot Network trading
Medium-term
Contracted 2015 volumes structured sales Grow medium-term structured sales
pipeline
7.7 bcm
Contracted LNG NG Iberia
demand
Sourcing Sales
Investor Presentation | September 2016Steady contribution from regulated activities 22 NG Infrastructure Power Extensive infrastructure in Iberia with regulated gas 173 MW of cogeneration capacity installed and distribution network and stakes in Iberian pipelines expected c.4 TWh/yr of electrical power generation RAB of €1.05 bn, with 6.2% RoR between 3 TWh of electricity sold to direct clients in Iberia Jul’16 – Jul’17 Investor Presentation | September 2016
Ring fencing regulated gas infrastructure business 23
Transaction structure Highlights
Values @ June 30, 2016
Marubeni led consortium with Toho Gas to acquire a
Galp Energia, SGPS, SA stake of 22.5% in GGND
Total Assets: €11.7 bn Shared governance leading to accounting deconsolidation
Net Debt: €1.8 bn
€138 m equity transaction, implying c.€1.3 bn EV, a 27%
premium over RAB and 11.5x Ebitda 2016E multiple
Galp Energia, SGPS, SA
Shareholder loans
€568 m
Equity
100%
GGND to raise own funding to repay existing shareholder
Total Assets: €13.0 bn loans
Net Debt: €2.5 bn
€0 m 77.5% Total cash proceeds of c.€700 m to Galp at completion
(GGND fully consolidated)
Galp Gás Natural About GGND
Distribuição
(GGND) Holding of nine local distribution concessionaries
Total Assets: €1.3 bn €1.05 bn Regulated Asset Base, with RoR of 6.2% for the
Net Debt1: €0.6 bn period Jul’16 - Jul’17
1 GGND will raise stand-alone funding to reimburse existing shareholder loans of €568 m.
Investor Presentation | September 201624
Developing highly competitive upstream projects
Extracting value from downstream and gas businesses
Committed to a solid capital structure
Delivering long term value to stakeholders
Key takeaways
Appendix
Investor Presentation | September 2016Capex plan focused on developing key projects 25
Capex profile (€bn)
2016-2020E capex estimated at €1.0 - €1.2 bn
1.5
Group capex
E&P to account for c.85% of Group capex
First stage of BM-S-11 in Brazil to drive short
E&P Brazil development
term investments
Potential capex reduction from greater
efficiency and contract renegotiation
E&P Mozambique
0.0 Expected 2016 capex of €1.1 - €1.3 bn
2015 2016E 2017E 2018E 2019E 2020E
Investor Presentation | September 2016Capex flexibility 26
Capex allocation 2016-2020
Around 60% of E&P capex already committed
and focused on Brazil and Angola
E&P developments
uncommitted
E&P uncommitted capex relates to non-
sanctioned projects with production to start
after 2020
E&A1 capex accounting for 15% of E&P
investment and more intensive from 2019
onwards
Downstream and gas capex mostly for energy
efficiency projects and process optimisation
E&P excl. Mozambique E&P Mozambique D&G
1 E&A – Exploration & Appraisal.
Note: E&P committed capex considers Lula/Iracema and Iara in Brazil, Blocks 32 and 14/14k in Angola, and
Investor Presentation | September 2016 2016 E&A.Group Ebitda CAGR 2015-20 of 15% 27
E&P Ebitda (€m) D&G Ebitda (€m)
R&M G&P1
2,250 1,500
Ebitda CAGR >40%
1,500 1,000
750 500
0 0
2015 2016E 2017E 2018E 2019E 2020E 2015 2016E 2017E 2018E 2019E 2020E
2016 Group Ebitda expected at €1.2 - €1.3 bn
1G&P Ebitda does not consider sale of regulated infrastructure.
Investor Presentation | September 2016Free cash flow breakeven during 2018 28
Galp free cash flow1 (€m)
FCF positive during 2018, assuming committed
and uncommitted capex
600
Testing at $45/bbl, FCF positive one year later,
assuming no further capex reduction
0 Brazil FCF positive during 2017 at $45/bbl
Further upsides expected from upstream
learning curve, higher productivity and contract
renegotiation
-600
2015 2016E 2017E 2018E 2019E 2020E
Base case Brent flat @ $45/bbl Positive FCF of €215 m in 1H16 post-dividend
and before expansion capex
1IFRS post interest, taxes and dividends and excluding Sinopec reimbursements.
Investor Presentation | September 2016 Note: Does not consider sale of regulated infrastructure.Galp fully funded 29
Sources and uses 2016-2020 (€bn) Net Debt to Ebitda3
Base case Brent flat @ $45/bbl
12 3.0x
NG Inf. cash in
Not
Liquidity1 committed
8 Capex 2.0x
CFFO Dividends2
4 post-tax 1.0x
Debt
service
0 0.0x
Sources Uses 2014 2015 2016E 2017E 2018E 2019E 2020E
1Liquidityas of June 2016, including cash of €0.9 bn, credit lines of €1.2 bn and loan to Sinopec of €0.6 bn.
2Assumes €0.41472 DPS, related to 2015 fiscal year, and €0.50 flat DPS from 2016 onwards.
3Ratio considers net debt plus Sinopec MLT Shareholder Loan to Petrogal Brasil minus loan to Sinopec. Does not
Investor Presentation | September 2016 consider sale of regulated infrastructure.30
Developing highly competitive upstream projects
Extracting value from downstream and gas businesses
Committed to a solid capital structure
Delivering long term value to stakeholders
Key takeaways
Appendix
Investor Presentation | September 2016Galp in the capital markets 31
Galp shareholding structure Free float evolution
67%
Free Float 60%
o.w.:
7%
2% - 5%
60%
2% - 5%
33% 23%
2% - 5%
2% - 5%
Free float Free float Potential
Geographic dispersion of institutional investors1:
@2006 (IPO) @Sept. 2016 Free float
Europe North America RoW @2017
56% 38% 6%
1Accordingto best available information, as of end of June 2016.
Investor Presentation | September 2016 Note: Parpública’s 7% stake placed through exchangeable bonds.Adding value to shareholders 32
Last 12-month share performance (%) Total shareholder return since Galp IPO1 (%)
39%
11%
7% 6% 4% 2% 1%
-3% 0%
-5%
-10%
European European SXEP European European European European European European
Majors Integrated Refiners E&P Majors Refiners Integrated E&P
Source: Bloomberg. 1 Total shareholder return from October 23, 2006 to end August 2016.
European E&P: Africa Oil, Cairn, DNO, ENQuest, Genel, Lundin, Ophir, Premier, Soco and Tullow; European
Integrated: Eni, MOL, OMV, Repsol and Statoil; European Majors: BP, Shell and Total; European refiners:
Investor Presentation | September 2016 Hellenic Petroleum, Lotos, MOH, Neste, Orlen, Saras and Turkish Petroleum.Commitment to shareholder remuneration 33
Galp DPS (€/share)
0.50 Current policy of 20% p.a. dividend growth
0.41 until 2016
0.35
0.29 Business plan assumes €0.50/sh flat from 2017
0.24
onwards
2012 2013 2014 2015 2016E
Investor Presentation | September 2016A corporate governance model which promotes transparency 34
Governing bodies
The board of directors is composed of 19
General Shareholders members of which seven are executive
Meeting members
Remuneration
Supervisory Board
Committee Of the 12 non-executive directors, five are
considered independent directors based on the
independency criteria established by the
Statutory Auditor
Portuguese Securities Market Commission
(CMVM)
Board of Directors
A robust supervisory framework including the
Supervisory Board and the Statutory Auditor
Company Secretary
Executive Committee
Investor Presentation | September 2016A focused and experienced executive team 35
Over 25 years of experience in
different industries, including
Oil & Gas, energy and
beverages. Member of Board
of Directors of Galp since
2007
Chief Executive Officer
Carlos Gomes da Silva
Chief Financial COO Exploration COO Supply, COO Iberian Oil COO Gas & Power Chief Corporate
Officer & Refining & Marketing & Officer / New
Production Planning International Oil Energies
Filipe Silva Thore E.Kristiansen Carlos Silva Tiago Câmara Pestana Pedro Ricardo Carlos Costa Pina
Former CEO of Held positions as More than 20 years Former CEO of Dia Over 20 years of Former Secretary of
Deutsche Bank in Senior Vice of professional Portugal, which experience in the State for Treasury
Portugal President of Statoil experience in the operates 640 stores in Gas sector. and Finance and
for South America areas of mainland Portugal Previously member of the BoD
and was also procurement and responsible for of the Portuguese
Chairman of Statoil engineering in the supply and trading Securities Market
Brasil automotive, of natural gas Commission
hospitality and Oil &
Gas industries
Investor Presentation | September 2016Galp corporate sustainability recognised internationally 36
Galp’s acknowledgements
Galp was included for the forth consecutive
year in the Iberia 125 CDLI1 by the Carbon
Disclosure Project in 2015
Presence in the DJSI Europe and DJSI World
for the third consecutive year
Considered one of the 100 most sustainable
companies in the world by Corporate Knights,
occupying the 30th place in the general
ranking and the 2nd best in the sector
1Climate Change Disclosure Leadership Index.
Investor Presentation | September 201637
Developing highly competitive upstream projects
Extracting value from downstream and gas businesses
Committed to a solid capital structure
Delivering long term value to stakeholders
Key takeaways
Appendix
Investor Presentation | September 2016Key takeaways 38
Competitive Unique growth Financial
position profile discipline
Projects Production Capex
0 ≈15% Commitment
@$55/bbl @2020 remuneration
1From financial outlook presented in the CMD in Mar-15 to the one published in the CMD Mar-16.
Investor Presentation | September 201639
Developing highly competitive upstream projects
Extracting value from downstream and gas businesses
Committed to a solid capital structure
Delivering long term value to stakeholders
Key takeaways
Appendix
Investor Presentation | September 2016Key operating indicators 40
2Q16 2Q15 2Q16 YoY 1H15 1H16 YoY
Exploration & Production 1
56.3 43.8 54.7 25% Average working interest production 2 (kboepd) 42.7 55.5 30%
52.9 40.5 51.7 28% Oil production (kbopd) 39.4 52.3 33%
2
53.7 40.9 52.2 28% Average net entitlement production (kboepd) 39.8 53.0 33%
7.9 7.4 7.1 (3%) Angola 7.6 7.5 (1%)
45.8 33.5 45.0 34% Brazil 32.2 45.4 41%
26.2 53.0 38.3 (28%) Average realised sale price3 (USD/boe) 51.8 32.1 (38%)
8.9 7.6 9.8 29% Production costs (USD/boe) 9.6 9.3 (3%)
Refining & Marketing
4.1 7.3 4.6 (37%) Galp refining margin (USD/boe) 6.6 4.3 (35%)
4
2.0 1.4 1.7 25% Refining cash cost (USD/boe) 1.6 1.8 17%
25.2 29.8 26.3 (12%) Raw materials processed (mmboe) 56.0 51.5 (8%)
4.2 4.7 4.6 (4%) Total refined product sales (mton) 9.1 8.7 (4%)
2.1 2.3 2.3 (2%) Sales to direct clients (mton) 4.6 4.4 (3%)
Gas & Power
1,860 1,869 1,593 (15%) NG supply total sales volumes (mm3 ) 4,064 3,454 (15%)
901 919 882 (4%) Sales to direct clients (mm3) 1,918 1,782 (7%)
960 951 712 (25%) Trading (mm3) 2,146 1,672 (22%)
1,192 1,120 1,229 10% Sales of electricity (GWh) 2,247 2,421 8%
1 Unit figures based on net entitlement production.
2 Includes natural gas exported, excludes natural gas used or reinjected.
3 Galp average oil and gas realised sale price, including change in production effects.
Investor Presentation | September 2016
4 Excluding impact of refining margin hedging operations.Maintaining solid capital structure 41
Profit & Loss (€m) Balance Sheet¹ (€m)
1Q16 2Q15 2Q16 QoQ YoY 1H16 YoY Dec.2015 Jun.2016 Jun-Dec
Turnover 2,829 4,247 3,267 +15% (23%) 6,095 (25%) Net fixed assets 7,892 7,304 (588)
Ebitda 293 447 337 +15% (25%) 631 (23%) Work in progress 2,077 2,347 +270
E&P 48 119 86 +79% (27%) 135 (37%)
Working capital 510 365 (145)
R&M 148 230 143 (3%) (38%) 291 (22%)
Loan to Sinopec 723 576 (147)
G&P 90 89 97 +9% +10% 187 (15%)
Other assets (liabilities) (515) (335) +180
Ebit 137 304 185 +35% (39%) 323 (39%)
Non-current assets/liabilities
Associates 21 17 24 +14% +42% 45 +5% 842 +842
held for sale
Financial results 3 (10) 15 n.m. n.m. 18 n.m. Capital em ployed 8,610 8,752 +142
Taxes 1
(39) (107) (79) +100% (26%) (118) (34%) Net debt3 2,422 2,467 +45
Non-controlling interests (9) (15) (12) +41% (16%) (21) (19%)
Equity 6,188 6,285 +97
Net Incom e 114 189 133 +17% (29%) 247 (20%)
Net Debt + Equity 8,610 8,752 +142
Net Incom e (IFRS) (58) 110 66 n.m. (40%) 8 (89%)
1IFRS Figures.
2Does not include loan to Sinopec as cash.
Investor Presentation | September 2016Balanced debt profile 42
Debt breakdown @30 June 2016 (€bn) Reimbursement profile (€m)
June 2016 YE2015
3.4 900
Public
bonds
0.9 600
Private 1.9
placements 0.7
Multilaterals 300
Bank loans
0
Gross debt Cash Loan to Net debt 2016 2017 2018 2019 2020 2021 2022+
Sinopec
c.60%
Maintaining diversified sources of funding and reducing Average maturity of 2.7 years
average cost
Investor Presentation | September 2016Key indicators on Galp’s debt 43
2015 1H16
Gross debt €3.6 bn €3.4 bn
Cash and equivalents €1.1 bn €0.9 bn
Net Debt €2.4 bn €2.5 bn
Net Debt considering loan to Sinopec as cash €1.7 bn €1.9 bn
Net Debt to Ebitda Ratio1 1.2x 1.6x
Available credit lines €1.1 bn €1.2 bn
Average life of debt 3.1 2.7
Average interest rate 3.75% 3.50%
% Debt @ floating rate 58% 57%
1Ratio considers net debt plus Sinopec MLT Shareholder Loan to Petrogal Brasil minus loan to Sinopec.
Investor Presentation | September 2016Outlook and business plan sensitivities 44
Galp assumptions 2016E 2017E 2018E 2019E 2020E
Brent price ($/bbl) 35 45 55 65 70
Refining margin benchmark1 3.6 3.3 2.9 2.6 2.5
EUR:USD 1.12 1.12 1.12 1.12 1.12
Ebitda sensitivities Change 2016E 2020E
Brent price $5.0/bbl €90 m €210 m
Refining margin benchmark1 $1.0/bbl €90 m €95 m
EUR:USD 0.05 (€45 m) (€115 m)
1Benchmark refining margin = 42.5% cracking margin + 45.0% hydrocracking margin + 5.5% aromatics
Investor Presentation | September 2016 margin + 7.0% base oils margin.Galp’s reserves and resources portfolio 45
Reserves and resources (mmboe)1
Reserves 2014 2015 % Chg.
1P 232 276 19%
2P 638 701 10%
3P 833 960 15%
Contingent resources 2014 2015 % Chg.
1C 332 307 (8%)
2C 1,672 1,343 (20%)
3C 3,496 3,025 (13%)
Exploration resources 2014 2015 % Chg.
Unrisked 1,605 1,493 (7%)
Risked 217 226 4%
1Exploration resources and contingent resources on a working interest basis. Reserves figures on a net
Investor Presentation | September 2016 entitlement basis.
All figures are based on DeGolyer and MacNaughton report as of 31.12.2015.Ongoing exploration activities 46
Potiguar basin (Brazil) Alentejo basin (Portugal) São Tomé and Príncipe
Pitu discovery appraised during First ever deepwater exploration First operatorship in deepwaters
2015 well in Portugal
Planning for broadband seismic 3D
Broadband 3D seismic across five Main targets are Lower Cretaceous acquisition
blocks expected in 2016/2017 and Upper Jurassic sands
Investor Presentation | September 2016Acronyms 47
# Number DJSI Dow Jones Sustainability Indices m Million
≈ Approximately DoC Declaration of Commerciality mmbpd Million barrels per day
% Percentage DST Drill Stem Test mmboepd Million barrels of oil equivalent per day
& And E Exploration mmbbl Million barrels
€ Euros E&A Exploration and Appraisal mmboe Million barrels of oil equivalent
$ (or USD) Dollars E&P Exploration and Production MSc Master of Science
x Times Ebitda Earnings before interest and taxes, depreciation and amortisation mton Million tonnes
1C; 2C; 3C Contingent resources EIA U.S. Energy Information Administration mtpa Million tonnes per annum
4D Four Dimensional EOR Enhanced Oil Recovery NE Northeast
1P Proved reserves EPCIC Engineering Procurement Construction Installation Commissioning NG Natural Gas
2P Proved and probable reserves FEED Front-End Engineering Design NOCs National Oil Companies
3P Proved, probable and possible reserves FCF Free Cash Flow NPV Net Present Value
A Appraisal FID Final Investment Decision NLNG Nigeria Liquefied Natural Gas
Organisation of the Petroleum Exporting
ANP Agency of Petroleum, Natural Gas and Biofuels FLNG Floating Liquefied Natural Gas OPEC
Countries
bcm Billion cubic metres FPSO Floating Production Storage Offloading Opex Operational expenditure
bbl Barrel FOB Free On Board p.p. Percentage points
BBLT Benguela, Belize, Lobito and Tomboco FTE Full-time Equivalent PoD Plan of development
BoD Board of Directors GDP Gross Domestic Product PPSA Pré-Sal Petróleo S.A.
bn Billion cubic metres GeoER Reservoir geoengineering Q&A Questions and Answers
c. Circa GIIP Gas Initially in Place R&T Research and Technology
Capex Capital expenditure GIIGNL International group of liquefied natural gas importers R&M Refining and Marketing
CAGR Compound Annual Growth Rate HSE Health, Safety and Environment RCA Replacement Cost Adjusted
CEO Chief Executive Officer ICE Intercontinental Exchange RDA Reservoir Data Acquisition
Cid. Cidade IEA International Energy Agency ROACE Return on Average Capital Employed
CIF Cost, Insurance and Freights IHS CERA Information Handling Services Cambridge Energy Research Associates RRR Reserve Replacement Ratio
CFO Chief Financial Officer IMF International Monetary Fund ToR Transfer of Rights
CNE Central North East IOR Improved Oil Recovery US United States of America
CO2 Carbon dioxide ISPG Instituto do Petróleo e Gás vs. Versus
CDP Carbon Disclosure Project kboepd Thousand barrels of oil equivalent per day WAG Water alternating gas
COO Chief Operating Officer kbopd Thousand barrels of oil per day YoY Year over Year
D&G Downstream and Gas LatAm Latin America YE Year End
DD&A Depreciation, Depletion and Amortisation LNG Liquefied Natural Gas Yr Year
Investor Presentation | September 2016You can also read