Q1 2020 RESULTS - Investor Relations | TORM
←
→
Page content transcription
If your browser does not render page correctly, please read the page content below
1 4 M AY 2 0 2 0

Q1 2020 RESULTS

                     1
SAFE HARBOR STATEMENT
Matters discussed in this release may constitute forward-looking statements. Forward-looking
statements reflect our current views with respect to future events and financial performance and
may include statements concerning plans, objectives, goals, strategies, future events or
performance, and underlying assumptions and statements other than statements of historical
facts. The words “believe,” “anticipate,” “intend,” “estimate,” “forecast,” “project,” “plan,”
“potential,” “may,” “should,” “expect,” “pending” and similar expressions generally identify
forward-looking statements.
The forward-looking statements in this release are based upon various assumptions, many of
which are based, in turn, upon further assumptions, including without limitation, management’s
examination of historical operating trends, data contained in our records and other data available
from third parties. Although the Company believes that these assumptions were reasonable
when made, because these assumptions are inherently subject to significant uncertainties and
contingencies that are difficult or impossible to predict and are beyond our control, the Company
cannot guarantee that it will achieve or accomplish these expectations, beliefs or projections.
Important factors that, in our view, could cause actual results to differ materially from those
discussed in the forward-looking statements include the strength of the world economy and
currencies, general market conditions, including fluctuations in charter hire rates and vessel
values, the duration and severity of the COVID-19, including its impact on the demand for
petroleum products and the seaborne transportation thereof, the operations of our customers and
our business in general, changes in demand for “ton-miles” of oil carried by oil tankers and
changes in demand for tanker vessel capacity, the effect of changes in OPEC’s petroleum
production levels and worldwide oil consumption and storage, changes in demand that may
affect attitudes of time charterers to scheduled and unscheduled dry-docking, changes in
TORM’s operating expenses, including bunker prices, dry-docking and insurance costs, changes
in the regulation of shipping operations, including actions taken by regulatory authorities,
potential liability from pending or future litigation, domestic and international political conditions,
potential disruption of shipping routes due to accidents, political events including “trade wars,” or
acts by terrorists. In light of these risks and uncertainties, you should not place undue reliance on
forward-looking statements contained in this release because they are statements about events
that are not certain to occur as described or at all. These forward-looking statements are not
guarantees of our future performance, and actual results and future developments may vary
materially from those projected in the forward-looking statements.
Except to the extent required by applicable law or regulation, the Company undertakes no
obligation to release publicly any revisions to these forward-looking statements to reflect events
or circumstances after the date of this release or to reflect the occurrence of unanticipated
events.
                                                                                                          2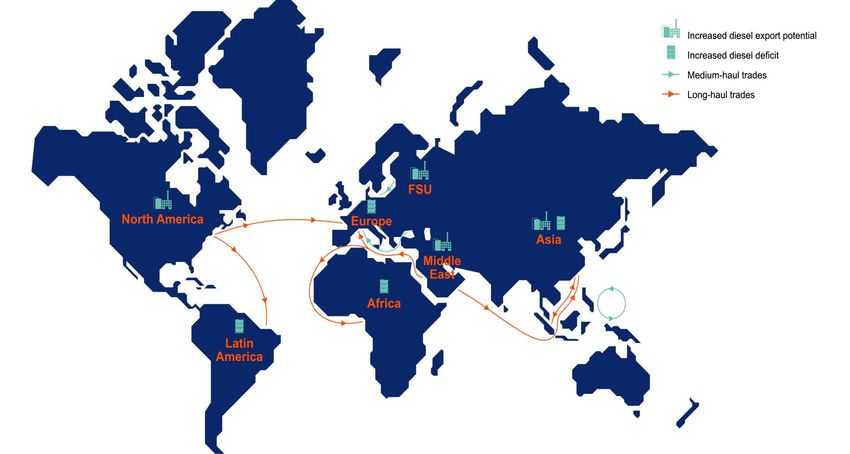
AGENDA

         1   Introduction to TORM and Q1 2020 highlights

         2   Product tanker market overview and outlook

         3   Financial metrics

         4   Asset management & scrubber investments

                                                           3
SAFETY FIRST

               •   Safety is the top priority for TORM and an
                   integral part of the One TORM platform
               •   Safety is especially important during the
                   COVID-19 pandemic
               •   To safeguard employees during the COVID-19
                   pandemic, several precautionary measures
                   were used, e.g. having all office-based
                   employees working from home at an early stage
               •   Having integrated a larger part of the value
                   chain, the One TORM platform has secured
                   safe operations of our vessels without major
                   operational issues

                                                                  4
TORM AT A GLANCE

  A world-leading product tanker company                                                  Fleet overview*
                                                                              79 Owned           2 On order
  •    A leading pure-play product tanker owner
  •    Large commercial footprint with presence in all key product tanker
       segments                                                                                      12   ⚫⚫⚫⚫⚫⚫⚫⚫⚫⚫
  •    Strong capital structure to support disciplined growth strategy        LR2                    +2   ⚫⚫⚫⚫

  •    Dual-listed on Nasdaq in Copenhagen and Nasdaq in New York                                     9   ⚫⚫⚫⚫⚫⚫⚫⚫⚫

                                                                              LR1

                                                                                                     56   ⚫⚫⚫⚫⚫⚫⚫⚫⚫⚫
                                                                                                          ⚫⚫⚫⚫⚫⚫⚫⚫⚫⚫
  One TORM                                                                    MR                          ⚫⚫⚫⚫⚫⚫⚫⚫⚫⚫
                                                                                                          ⚫⚫⚫⚫⚫⚫⚫⚫⚫⚫
  •    Large, global organization with ~330 land-based employees and                                      ⚫⚫⚫⚫⚫⚫⚫⚫⚫⚫
       ~3,100 seafarers                                                                                   ⚫⚫⚫⚫⚫⚫

  •    Integrated in-house operating and technical platform                                           2   ⚫⚫
                                                                              Handysize
  •    Focused on maintaining highest safety, environment and CSR
       standards, while delivering cost-efficient operations                  ⚫ On the water
                                                                              ⚫ Contracted newbuildings
  •    Driving performance improvements and creating value for stakeholders

* As of 14 May 2020, owned vessels include financially leased vessels.                                                 5
Q1 2020 FINANCIAL HIGHLIGHTS

                               6
THE REFERENCE COMPANY IN THE PRODUCT TANKER
SEGMENT

  TORM is a large-scale, tanker owner,                      TORM’s superior integrated
  active in all key product tanker                           operating platform includes
  segments in order to meet customer     in-house technical and commercial management
  needs.                                                      as preferred by customers.

  Our product tankers are                               Second to none responsiveness
  primarily deployed in the                                 to our customers, resulting
  spot market.                                                         in higher TCEs.

  Limited charter-in commitment                                   Scale and digitalization
  (off-balance sheet).                                       driving cost-efficient results.

  TORM has a solid capital                            TORM utilizes financial thresholds
  structure with financial strength to                 to pursue selective fleet growth
  pursue growth.                                                          and renewal.

                                                           Well-positioned to increase
  Competitive advantage when
                                                        competitiveness through asset
  pursuing vessel acquisitions from
                                                 management, scrubber installations and
  yards.
                                                                 market consolidation.

  Semi-annual distribution policy of                In-house S&P team with long-lasting
  25-50% of net income.                                 relationships with brokers, yards,
                                                      financial partners and shipowners.
                                                                                               7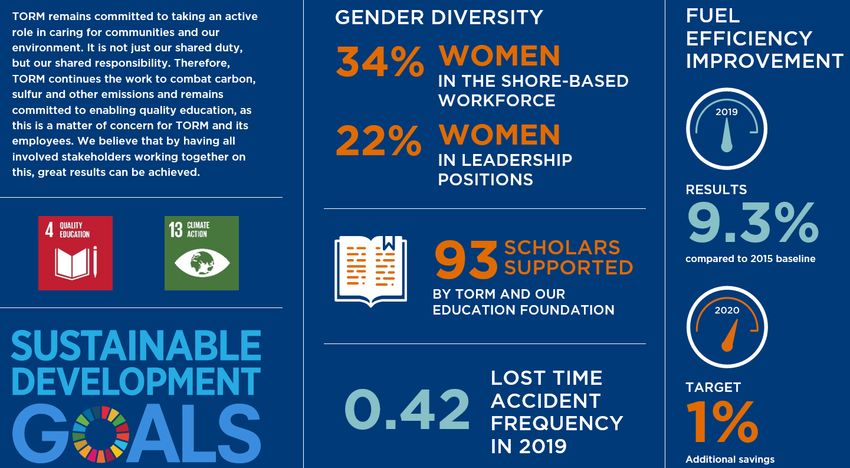
TORM COMMERCIALLY OUTPERFORMS PEERS IN ITS KEY
 MR SEGMENT CORRESPONDING TO USD 19M IN Q1 2020

MR reported TCE, USD/day

                                                                                                                       Q1 2020 performance:
                                                                                                                       •    TORM: USD/day 22,461
                                                                                                                       •    Peer average: USD/day 18,821

TORM MR                                                                                                                                                                           USD
                              USD 14m                               USD 36m                                  USD 19m                                  USD 24m
premium*                                                                                                                                                                          19m

 Note: Peer group is based on Ardmore, d’Amico (composite of LR1, MR and Handy), Diamond S, Frontline 2012, Hafnia Tankers, NORDEN, Maersk Tankers, Teekay Tankers, Scorpio and
 International Seaways.
 For Q1 2020, the peer group only consists of Ardmore, d’Amico, Diamond S, NORDEN, Scorpio and International Seaways. Earning releases from other peers are pending.
 * TORM premium calculation is based on the individual quarters with those vessels in TORM’s MR fleet earning TORM’s TCE rate compared to the peer average.                             8
TORM’S COMMERCIAL CAPABILITIES ARE FOCUSED ON
  OPTIMIZING GEOGRAPHICAL POSITIONING
                       USD/day                                                                                                         (%)

                      14,000                                                                                                           80
West outperformance

                                                                                                                                             Majority of TORM’s
                                                                                                                                             MRs West of Suez
                      12,000
                      10,000                                                                                                           70
                       8,000
                       6,000
                                                                                                                                       60
                       4,000
                       2,000
                            0                                                                                                          50
                       -2,000
East outperformance

                                                                                                                                             Majority of TORM’s
                       -4,000

                                                                                                                                             MRs East of Suez
                                                                                                                                       40
                       -6,000
                       -8,000
                                                                                                                                       30
                      -10,000
                      -12,000
                      -14,000                                                                                                       20
                            Q1 - 17 Q2 - 17 Q3 - 17 Q4 - 17 Q1 -18 Q2 - 18 Q3 -18 Q4 - 18 Q1 -19 Q2 - 19 Q3 -19 Q4 - 19 Q1 - 20 Q2 – 20
                                                                                                                                to date
                         TORM % of MRs positioned West of Suez (right axis)          West premium of benchmark earnings* (left axis)
  * West premium calculated as spread between Atlantic triangulation (TC2 & TC14) and Transpacific voyage (TC10).
  Source: Clarksons, TORM.                                                                                                                                        9
FULLY INTEGRATED BUSINESS MODEL WITH
COMPETITIVE COST STRUCTURE
Significant reduction in OPEX
OPEX per day (yearly, weighted avg. in USD/day)
-20%
7,655
7,193 Compared to the full
6,771 6,673 6,389 6,371 6,089 year of 2014, TORM
has reduced the
OPEX cost base of
approx. USD 44m
on an annualized
basis by an
OPEX/day reduction
of USD/day 1,566.
2014 2015* 2016 2017 2018 2019 Q1 2020 TORM maintains a
low cost base with
an EBITDA break-
even rate in Q1
TORM operates a fully integrated commercial and technical platform
2020 USD/day
• TORM’s operational platform handles commercial and technical operations in-house 8,800
• The integrated One TORM business model provides TORM with the highest possible trading flexibility and
earning power while maintaining a low cost structure
10TORM’S EARNINGS ARE VERY SENSITIVE TO
REALIZATION OF FREIGHT RATES
Quarterly EBITDA Annualized EPS*
Quarterly PBT
Annualized figures* Quarterly EPS
USDm
600 USD 3.0 / DKK 20.5
500 USD 0.8 / DKK 5.1
400
USD 0.6 / DKK 4.1
300
202
200
102
100 57
47
0
Full-year 2019 Q1 2020
(USD/day 16,526) (USD/day 23,643)
* Annualized EBITDA, PBT and EPS for Q1 2020 realized is calculated by multiplying the results by four. 11CSR HIGHLIGHTS
12INDUSTRY COOPERATION AND TRANSPARENCY ARE KEY TO TORM’S
CORPORATE SOCIAL RESPONSIBILITY AND INDUSTRY INITIATIVES
TORM is committed to support…
UN Sustainable TORM supports the SDGs based on an assessment of our CSR activities
Development Goals and areas of impact.
UN Global TORM became signatory to the UNGC in 2009 as the first Danish shipping
Compact company.
Maritime Anti- TORM is founding member of a global business network working towards a
Corruption Network maritime industry free of corruption that enables fair trade.
As part of Danish Shipping, TORM is pushing for international regulation and
Danish Shipping
standards on e.g. emissions through the International Maritime Organization.
Getting to Zero TORM is supporting the efforts to make commercially viable zero-emission
Coalition vessels a scalable reality by 2030.
13HIGHLIGHTS
Q1 FINANCIAL HIGHLIGHTS VESSEL INVESTMENTS
During Q1 2020, TORM took delivery of two LR1
newbuildings and one MR newbuilding
Ordered two LR2 newbuildings
EBITDA of USD 102m TCE Q1 2020 of USD/day 23,643
After the quarter ended, TORM took delivery of one
additional MR newbuilding
Profit before tax of USD 57m MR TCE Q1 2020 of USD/day 22,461
As of 14 May 2020, TORM has installed 37 scrubbers out
of a total program of 49 scrubbers
RoIC of 15.4% Q2 bookings of USD/day 29,188
Earnings per share of 76 US cents (5.1 DKK)
REFINANCING
In early 2020, TORM refinanced USD 496m of existing
debt, securing no major debt maturities until 2026
The refinancing supports our conservative finance structure
and gives us financial flexibility
14EQUITY INVESTMENT HIGHLIGHTS
15AGENDA
1 Introduction to TORM and 2019 highlights
2 Product tanker market overview and outlook
3 Financial metrics
4 Asset management & scrubber investments
16OPERATING IN A DYNAMIC ENVIRONMENT
OPEC+ COVID-19
RUSSIA & SAUDI ARABIA CHANGING DAILY
17NUMEROUS MAJOR EVENTS DRIVING PRODUCT TANKER
FREIGHT RATES TO AN ALL-TIME HIGH
LR2 (TC1) TORM MR (spot)
USD/day
MR (avg) TORM MR covered Q2 2020 as of 11 May 2020
170,000
Q1 2020
80,000 • Panama Canal delays
75,000
• Maintenance at Middle East export-oriented refineries
• High product exports from China amid lower demand
70,000
due to COVID-19
65,000 • OPEC+ price war increasing oil supply
60,000 • Over 50% of LR2s in dirty trade
55,000
50,000
45,000
40,000 Q2 2020-to date
35,000
• Unprecedented declines in local oil demand leading to
30,000
regional dislocations
25,000 • Floating storage of 14% of tonnage primarily from ullage
20,000 issues at terminals
15,000 • Cargo discharge disabilities leading to inefficient trading
10,000 patterns as charters are searching for new buyers
• OPEC cut not sufficient to avoid record high inventory
5,000
build-up supporting crude market
0
Jan- Feb- Mar- Apr- May- Jun- Jul- Aug- Sep- Oct- Nov- Dec- Jan- Feb- Mar- Apr- May- Jun- • Some LR2 switch back to clean trade
19 19 19 19 19 19 19 19 19 19 19 19 20 20 20 20 20 20
Source: TORM, Clarksons. Spot earnings: LR2: TC1 Ras Tanura-> Chiba, MR: average basket of Rotterdam->NY, Bombay->Chiba, Mina Al Ahmadi->Rotterdam, Amsterdam-
>Lome, Houston->Rio de Janeiro, Singapore->Sydney. 18THE COVID-19 PANDEMIC HAS TIGHTENED TONNAGE SUPPLY AND LED
TO MARKET INEFFICIENCIES
Fundamental effects on demand and supply from the COVID-19 MR rates have been strong despite COVID-19
Short-term Medium-term
• Increased product exports in • Potential economic stimulus
in China and other countries USD/day TORM MR spot
initial phases of demand
weakness will restore usual demand and TORM MR covered Q2 2020 as of 11 May 2020
trading patterns 30,000
• As oil demand is negatively 26,511
Tonnage affected around the world, • Once oil demand improves
demand some trade flows will decline again, product will be 22,974
released from storage and
thereby likely negatively
affecting trade flows 20,000 18,424
16,768
15,429
13,603
• Discharge delays as • Release of vessels from
unprecedented product floating storage once oil
10,000
oversupply is resulting in full demand starts to recover
storage tanks at terminals
(“logistical floating storage”) • Newbuilding delivery delays
from the Chinese shipyards
• Full onshore storage capacity and lower ordering interest
Tonnage necessitating floating storage, lead to lower fleet growth in
supply 0
removing tonnage from the the medium and long term, at Q1 Q2 Q3 Q4 Q1 Q2
market a time when the order book is
already historically low 2019 2020
• Delays with scrubber
installations might temporarily
reduce effective tonnage supply
19COVID-19 INDUCED DEMAND DESTRUCTION HAS LED TO
AN UNPRECEDENTED OVERSUPPLY OF OIL PRODUCTS
• The COVID-19 pandemic has
Pre-COVID-19 led to an unprecedented oil
Jan 2020 demand destruction
• Refinery runs have been
Refined product lagging declines in demand,
stocks build leading to unprecedented
inventory builds bringing the
onshore spare storage capacity
to its limits
Refined product
stocks build
• Inventory draws once demand
starts to recover, however, the
Refined product timing and speed remain
stocks draw uncertain
Oil product demand
Refinery production
Sources: TORM. 20CONTANGO IN OIL PRICES SUPPORT FLOATING
STORAGE IN THE MEDIUM TERM
Brent forward spreads and VLCC rates
USD/bbl USD/day
8 Brent M5-M1 VLCC rate (rhs) 180,000
Contango
4
150,000 • “Too little, too late”:
120,000 the unprecedented OPEC+
2
output cuts due from May will not
0 90,000
Backwardation be enough to avoid onshore
-2
60,000 inventories hitting tank tops
-4
30,000 • In some regions, this can happen
-6
earlier than global storage
-8
2008 2009 2010 2011 2012 2013 2014 2015 2016 2017 2018 2019 2020 capacity reaches its limits (e.g.
products in Europe)
ARA gasoil forward spreads and LR2/MR rates
USD/ton USD/day • This has sent some of the crude
ARA gasoil M5-M1 LR2 rate (rhs) MR rate (rhs) benchmarks to all-time lows and
60 Contango 180,000
resulted in “super contango” last
40 160,000 seen in 2008
20
80,000 • Contango is supporting floating
0
storage of both crude and
60,000
products over the coming months,
Backwardation
-20 40,000 but this effect is likely unwinding
-40 20,000
once demand recovers
-60 0
2008 2009 2010 2011 2012 2013 2014 2015 2016 2017 2018 2019 2020
Source: Clarksons, Reuters, TORM. 2114% OF PRODUCT TANKER TONNAGE CLASSIFIED AS
FLOATING STORAGE FOLLOWING A RECENT RAMP-UP
Vessels in floating storage
• The unprecedented decline in oil product
Mn dwt demand has resulted in ullage issues at
20
terminals and refineries, resulting in a spate of
logistical floating storage
15
• Given the time lag between fixture date and
MR when a vessel enters storage service, the
10 number of vessels engaged in the longer-term
floating storage is set to increase in the near
5 LR1 future
LR2 • Currently, 14% of the clean-trading tonnage
0 (16% of LR2, 21% LR1 and 11% of the MR
Jan- Feb- Mar- Apr- May-
20 20 20 20 20 fleet) is in floating storage, 90-95% of this is tied
up in logistical floating storage
Example of floating storage scenario
15 – 30 days
Fixing Loading Potential transportation to expected Floating storage appear in statistics
of cargo of cargo discharge port
Source: TORM. Vessels idle for at least seven days with cargo on board. Latest data as per 13 May 2020. 22PRODUCT TANKER MARKET STRENGTH HAS RECENTLY TRIGGERED
SOME LR2 VESSELS TO SWITCH BACK TO CLEAN
USD/day %
• Over the past six months, the
Aframax rate premium to LR2
40,000 55 product tanker market has been
Share of LR2s in dirty trades (rhs)
supported by around 40 LR2s
30,000
50
switching to dirty trades,
20,000 resulting in more than 50% of
the LR2 fleet trading in dirty
10,000 45
0
• With the clean tanker rates
Jan-17 Apr-17 Jul-17 Oct-17 Jan-18 Apr-18 Jul-18 Oct-18 Jan-19 Apr-19 Jul-19 Oct-19 Jan-20 40 presently at all-time high, and
-10,000 LR2 benchmark rates on par
with or even exceeding VLCC
-20,000 35
earnings, a few LR2s have
-30,000 recently switched back to clean,
30 and this number is likely to
-40,000 increase should the current
-50,000 25 market conditions hold
• This is nevertheless from a
multi-year low number of LR2s
in the clean trade, last seen in
mid-2015
Source: Industry sources, Clarksons, TORM. 23IMO 2020 EFFECTS ON CLEAN TRADING HAVE NOT FULLY
UNFOLDED YET
MGO and VLSFO price spreads (USD/t)
100 MGO-VLSFO spread, Rotterdam • The tight price spread between
MGO-VLSFO spread, Singapore MGO and VLSFO in early 2020
incentivized the use of MGO in
Europe, with MGO share in bunker
50
sales increasing to 31% in January
from 21% a year earlier
• VLSFO uptake in Singapore has
0
been larger than expected, partly
Oct-19 Nov-19 Dec-19 Jan-20 Feb-20 Mar-20 Apr-20 May-20 due to high inventories built up
towards the end of 2019
Bunker sales in Singapore (million tons) • China’s issuance of fuel oil export
quotas will significantly contribute to
5 Other MGO VLSFO HSFO
the VLSFO availability in the region
4 • Post-COVID-19, increasing
3 competition for feedstocks during
peak gasoline demand season can
2 lead to lower VLSFO supplies and
1 increased demand for MGO during
that period
0
Jun-19 Jul-19 Aug-19 Sep-19 Oct-19 Nov-19 Dec-19 Jan-20 Feb-20 Mar-20
Source: Reuters. 24MIDDLE EAST REFINERY CAPACITY ADDITIONS EXPECTED
TO HAVE A POSITIVE LONG-TERM IMPACT
Middle East refinery capacity net additions (m b/d) Forecasted Realized
0.63
0.56
2020-23 avg.=0.41 mb/d
0.32
0.25
0.14
2015-19 avg. 2020F 2021F 2022F 2023F
• As oil product demand increases, the ton-mile demand is positively impacted by increasing geographic dislocations between the
demand for and supply of clean petroleum products (CPP)
• Middle East refinery capacity additions are expected to accelerate in 2020-2021, placing a renewed pressure on less competitive
refineries in e.g. Europe and subsequently leading to increased CPP movements across regions
Source: WoodMackenzie, TORM. 25PRODUCT TANKER ORDER BOOK REMAINS AT
HISTORICAL LOW LEVEL
Product tanker order book as percentage of the fleet (%)
24
19 19
15 16
14 14
11 12
10 10
8 8
2010 2011 2012 2013 2014 2015 2016 2017 2018 2019 2020 YTD 5Y avg. 10Y avg.
Orders with dual-
fuel specification 10 15
• The product tanker order book to fleet ratio is currently at 8% (9% for MRs, 1% for LR1s and 12% for LR2s)
• In Q1 2020, the product tanker fleet capacity grew by 0.9%, with newbuilding deliveries 15% below expectations at the beginning of the year
• TORM estimates that the product tanker fleet will grow by an average of ~3% p.a. in the period 2020-2022, excluding any potential acceleration of
scrapping in response to new regulations*
* These calculations are based on the known order book and TORM’s estimates for additional ordering and scrapping in line with historical average activity.
Source: TORM. 26VESSEL VALUES AND MARKET RATES DISCONNECTED
DUE TO THE COVID-19 UNCERTAINTY
USDm LR2 ‘000 USD/day USDm MR ‘000 USD/day
60 40 40 25
35
55
30 35 20
50
25
45 20 15
30
15
40
10 10
25
35
5
0 0 0 5
Jul-15 Jan-16 Jul-16 Jan-17 Jul-17 Jan-18 Jul-18 Jan-19 Jul-19 Jan-20 Jul-15 Jan-16 Jul-16 Jan-17 Jul-17 Jan-18 Jul-18 Jan-19 Jul-19 Jan-20
Newbuilding 5-yr. second-hand 1-yr. T/C
• The COVID-19 uncertainty is currently weighing on the sentiment. Prompt vessels are seeing increased interest, however, with an abundance of sale
candidates, prices are continuously flat or downward
• Despite unprecedented strength experienced in the freight market, product tanker newbuilding activity has been low so far this year, affected by COVID-
19 uncertainties
Source: Clarksons. T/C rate for non-eco, non-scrubber vessels. 27COVID-19 LEADING TO MEDIUM-TERM MARKET
VOLATILITY
Key medium- to long-term market drivers
• The unprecedented oversupply of crude and oil products, due to the COVID-19 induced
demand destruction, has led to onshore storage filling up fast and keeping increasing number of
vessels tied up in floating storage
• Economic stimulus supporting recovery in oil demand in H2 2020, and restoring some of the
trades distorted by the COVID-19 once the initial stock draw is over
• Product tanker order book to fleet ratio at historically low level, and ordering activity expected to
remain limited
• Refinery capacity addition in the Middle East potentially increasing sailing distances
• IMO 2020 fuel shift adding support to the product tanker demand
• Macroeconomic uncertainty related to the fall out of the COVID-19
• LR2s have recently started to switch to clean, although from a multi-year low base
• The release of floating storage once the global oil demand recovers and inventories start to
draw down
• Geopolitical situation in the Middle East
• Potential new climate-related regulations
Source: TORM. 28AGENDA
1 Introduction to TORM and 2019 highlights
2 Product tanker market overview and outlook
3 Financial metrics
4 Asset management & scrubber investments
29Q1 2020 FINANCIALS USDm Q1 2020 Q1 2019 2019 P&L TCE earnings 158 117 425 Gross profit 115 74 252 Sale of vessels 0 0 1 EBITDA 102 62 202 Profit before tax 57 23 167 Profit before tax excl. impairment reversal 57 23 47 Balance sheet Equity 1,046 867 1,008 NIBD 798 584 786 Cash and cash equivalents 129 155 72 Key figures Earnings per share (USD) 0.76 0.31 0.621) Return on Invested Capital 15.4% 8.8% 4.9%1) Net Asset Value (NAV) 993 829 1,016 Number of vessels (#)2) 78 70 76 Tanker TCE/day (USD) 23,643 17,949 16,526 Tanker OPEX/day (USD) 6,089 6,448 6,371 1) Adjusted for impairment reversal of USD 120m. 2) Including financially leased vessels. 30
SPOT-ORIENTATION PROVIDES SIGNIFICANT OPERATING
LEVERAGE WITH HIGH NEAR-TERM COVERAGE
Significant operational leverage
Unfixed days as of 31 March 2020                                                      LR2      MR
(% of total days)
                                                                                      LR1      Handy
                                                28,356 (100%)                      28,410 (100%)
                                                          4,340                              4,771
             18,671 (89%)                      3,207                              3,207
                      2,405
           2,145
                                                   20,082                             19,706
               13,667
                 453                                 726                                726
                2020                                2021                               2022

Q2 2020 coverage above Q1 realized freight rates (USD/day)
                              Q1 2020 TCE per day              Q2 2020 cover as of 11 May 2020
                                                             % of total days        TCE per day
   LR2                               29,108                        89%                 35,639
   LR1                               24,329                       65%                   36,068
   MR                                22,461                       65%                   26,511
   Handy                             20,649                       58%                   19,145
   Total                             23,643                       69%                   29,188
                                                                                                       31
NET ASSET VALUE ESTIMATED AT USD 993M
31 March 2020 figures, USDm
Net LTV of 49%
1,832
923
993
56 10
112 129
Value of vessels Outstanding debt Committed Cash Working Capital Other* Net Asset Value
(incl. newbuildings) CAPEX
• Net Loan-to-Value was 49% ensuring a strong capital structure
• Net Asset Value (NAV) was estimated at USD 993m (USD 13.3/DKK 90.5 per share)
• Market cap as of 31 March 2020 was USD 630m, or DKK 57.8 per share**
• Market cap as of 11 May 2020 was USD 620m, or DKK 57.6 per share***
** Other includes Other plant and operating equipment and total financial assets.
** Calculated based on 74,267,282 shares and USD/DKK FX rate of 6.82.
*** Calculated based on 74,267,282 shares and USD/DKK FX rate of 6.90. 32WELL-POSITIONED TO SERVICE FUTURE CAPEX
COMMITMENTS
Liquidity and CAPEX as of 31 March 2020
USDm
Available liquidity CAPEX commitments
273 Retrofit scrubbers Newbuildings incl. scrubber
76
23
45 133
129
21
86
47 112
21
26
Cash Available MR LR2 Total 2020 2021 Total
position Working newbuilding newbuilding available
Capital financing financing liquidity
Facility
33FAVOURABLE FINANCING PROFILE WITH NO MAJOR
NEAR-TERM MATURITIES
Scheduled debt repayments as of 31 March 2020
USDm
918 12
16 Financial lease
69
167 Mortgage debt
152 27
95 13
78 27
751 76 38
57
33
224
Oustanding ROY 2020 2021 2022 2023 2024 2025 Hereafter
debt as of 31
March 2020*
Ample headroom under our attractive covenant package:
• Minimum liquidity: USD 45m**
• Minimum book equity ratio: 25% (adjusted for market value of vessels)
** Financial lease excludes non-vessel related IFRS16 liabilities of USD 9.0m and is adjusted for loan receivables of USD 4.6m.
** Subject to final approval 34AGENDA
1 Introduction to TORM and 2019 highlights
2 Product tanker market overview and outlook
3 Financial metrics
4 Asset management & scrubber investments
35TORM IS A LONG-TERM INDUSTRIAL PLAYER WITH FOCUS
ON SUPERIOR OPERATIONAL PERFORMANCE
Long-term industrial player with an integrated operational platform
• Industrial player with a long-term time horizon in the product
tanker market
• Prevalent platform through several cycles with superior financial
returns
• Optimized asset acquisitions and disposals at market
• Sufficient scale of the integrated One TORM operational
platform allows for great benefits
• Long-term relationships with key customer segments:
• International oil majors
• State-owned oil companies
• Trading houses
In-house Integrated In-house
technical One TORM commercial
management platform management
36HISTORICAL TRANSACTIONS AND VESSEL VALUE
DEVELOPMENT
USDm LR2 - Newbuildings MR - Newbuildings
60 LR1 - Newbuildings MR - 7.5-year second-hand (based on avg. of 5 and 10 years)
55
50
Two GSI LR2s
Four GSI LR2s (incl. scrubbers)
45 (excl. scrubbers)
40 Two GSI LR1s
(incl. scrubbers)
35
30 Three GSI NBs
Two HM resales (incl. scrubbers)
(excl. scrubbers) Four GSI NBs
25 (incl. scrubbers)
20 Four HM 2011-built
(8-year old vessels)
0
Jul-2015 Jan-2016 Jul-2016 Jan-2017 Jul-2017 Jan-2018 Jul-2018 Jan-2019 Jul-2019 Jan-2020 Jul-2020
Source: Clarksons, TORM. 37TORM’S RECENT VESSEL SALES ARE DONE AT BROKER
VALUE
Vessel name Vessel Date Age Sales price, net Broker
segment of commission, values,
USDm USDm
TORM Ohio Handy Q3-18 16.7
TORM Neches MR Q3-18 18.0 • Since Q3 2018,
TORM has sold 12
TORM Clara MR Q4-18 17.9 vessels at broker
value
TORM Charente Handy Q4-18 17.2
• Proceeds from vessel
TORM Amazon MR Q1-19 17.1 sales used for fleet
modernization and
TORM Cecilie MR Q1-19 18.1 scrubber investments
TORM Gunhild MR Q2-19 20.0 • Transactions at broker
TORM San Jacinto MR Q3-19 17.0 value support TORM’s
Net Asset Value
TORM Saone Handy Q3-19 15.0 assessment
TORM Garonne Handy Q4-19 15.7
TORM Rosetta MR Q4-19 16.7
TORM Loire Handy Q1-20 15.9
Total 17.1 ~91 ~93
38THERE ARE TWO MAIN OPTIONS FOR OCEAN-GOING VESSELS TO
COMPLY WITH THE UPCOMING IMO 2020 SULFUR REGULATION
Product/chemical
Worldwide tankers1) TORM2)
Newbuildings
Scrubber ~4,200 ~500 49 vessels
installations vessels vessels sass
(12%) (15%) (60%)
Existing fleet on the
Shipowners’ sulfur water
regulation
compliance choices
Compliant fuels ~30,800 ~2,800 32 vessels
vessels vessels sass
(88%) (85%) (40%)
• As of 14 May 2020, TORM has installed 37 scrubbers
• The scrubber installations have been conducted on three LR2 vessels, six LR1 vessels and 28 MR vessels
• Ten additional scrubbers are expected to be installed within 2020, and two will be installed on TORM’s two LR2 newbuildings with expected delivery in
the fourth quarter of 2021
1. Product tankers and chemical tankers 25k dwt+.
2. As of Q4 2021 where the two LR2 newbuildings will be delivered.
Source: IHS, DNV GL's Alternative Fuels Insight platform. 39SCRUBBER INSTALLATIONS ACROSS SHIPPING
SEGMENTS
Product tankers to be fitted with scrubbers (% of current fleet)
No. of vessels
300
In service and fitted with scrubber/in yard
15%
In service and reported for retrofit
250
On order and to be fitted with scrubber
200
150
30%
100
50 10%
3%
0
LR2 Panamax/LR1 MR Handy
Source: Clarksons, compiled by TORM.
Note: Product tanker segment does not cover chemical tankers. Data as of 4 May 2020. 40SCRUBBER INSTALLATIONS IMPACT TIMING OF SUPPLY EFFECT
AND FUEL MIX FOR MARINE TRANSPORTATION
Bunker consumption – scrubber sensitivity
M b/d
Compliant fuels HSFO
6
5
1.3
4
3.9 3.7
3 4.2
4.7 4.5
2 3.7
1
1.1 1.3
0.5 0.8
0 0.3
Current bunker Consumption Consumption Consumption Consumption Consumption
consumption based on 1,000 based on 2,000 based on 3,000 based on 4,000 based on 5,000
scrubbers scrubbers scrubbers scrubbers scrubbers
Source
Source: Clarksons and TORM. 4149 SCRUBBER INSTALLATIONS WILL BE CONDUCTED SUPPORTED BY
TORM’S SCRUBBER JV
TORM’s scrubber JV, ME Production China
Ownership share: 27.5%
ME • One of the largest risks with scrubber
Production installations is the potential delay during both
China
the production and the installation phase
• Due to the strategic partnership with ME
Part of one of the largest shipyards groups
Production and GSI, TORM has secured
Leading scrubber manufacturer
production slots at ME Production China
• 43 out of the 49 scrubbers will be delivered from
TORM’s scrubber JV, ME Production China
42FUEL SPREAD HAS NARROWED ALONG WITH DECLINE IN
CRUDE OIL PRICE
Cal2020 price spread between 0.5% compliant fuels and 3.5% HSFO, Rotterdam delivery vs Brent • The spread
USD/t USD/bbl between 0.5%
300 70 compliant fuel
and 3.5% HSFO
250 60 is currently
50 trading at USD
200 73 for the
40 calendar year
150 VLSFO-HSFO spread (CAL2020)
30 2020, and USD
Brent (RHS)
100 91 for the
20 calendar year
50 10 20211)
Aug-19 Sep-19 Oct-19 Nov-19 Dec-19 Jan-20 Feb-20 Mar-20 Apr-20 May-20 Jun-20 • The recent
narrowing of the
Spot and forward price spread between 0.5% compliant fuels and 3.5% HSFO, Rotterdam delivery spread reflects
USD/t lower crude price
350 VLSFO-HSFO spread, spot as well as lower
300 VLSFO-HSFO spread, forward bunker demand
250 due to the
COVID-19 and is
200 likely temporary
150
100
50
0
Sep-19 Nov-19 Jan-20 Mar-20 May-20 Jul-20 Sep-20 Nov-20 Jan-21 Mar-21 May-21 Jul-21 Sep-21 Nov-21 Jan-22
1. Clarksons - Rotterdam data as of 11 May 2020.
Source: Industry sources. 43APPENDIX
44MANAGEMENT TEAM WITH AN INTERNATIONAL OUTLOOK
AND MANY YEARS OF SHIPPING EXPERIENCE
Executive Director
Jacob Meldgaard
▪ Executive Director of TORM plc
▪ CEO of TORM A/S since April 2010
▪ Chairman of the Board of Danish Shipping and member of the Board of Danish Ship Finance
▪ Previously Executive Vice President of the Danish shipping company NORDEN, where he
was in charge of the company’s dry cargo division
▪ Prior to that, he held various positions with J. Lauritzen and A.P. Moller-Maersk
▪ More than 25 years of shipping experience
Senior Management
Kim Balle Lars Christensen Jesper S. Jensen
▪ Chief Financial Officer ▪ Head of Projects ▪ Head of Technical Division
▪ With TORM since 1 December 2019 ▪ With TORM since 2011 ▪ With TORM since 2014
▪ Previously CFO of CASA A/S and ▪ Previously with Navita Ship, ▪ Previously with Clipper and
DLG Maersk Broker and EA Maersk
▪ More than 25 years of finance Gibson ▪ More than 25 years of shipping
experience ▪ More than 25 years of experience
shipping experience
45KEY FIGURES USDm Q1 2020 Q1 2019 2019 2018 Revenue 246 186 693 635 EBITDA 102 62 202 121 Profit/(loss) before tax 57 23 167 -33 Net profit/(loss) excluding impairment charges 56 23 46 -35 Balance sheet Total assets 2,101 1,717 2,004 1,714 Equity 1,046 867 1,008 847 NIBD 798 584 786 627 Cash and cash equivalents 129 155 72 127 Cash flow statement Operating cash flow 50 55 171 71 Investment cash flow -59 -12 -323 -176 Financing cash flow 63 -15 84 96 Financial related key figures EBITDA margin 41% 33% 29% 19% Equity ratio 50% 51% 50% 49% Return on Invested Capital (RoIC) 15% 9% 5%* 0% * Adjusted for impairment reversal of USD 120m. 46
FLEET OVERVIEW
  # of                          LR2   LR1   MR   Handy           As of 14 May 2020
vessels
 70             68        68                               68

                 11        11                               11
 60
                 9         9                                9
 50

 40

 30
                46        46                               46
 20

 10

  0               2        2                                2
               14 May   End 2020                         End 2021
   Graph
   excluding
   sale and     11        11                               13
   leaseback
   vessels

                                                                                47
UNPRECEDENTED OIL MARKET OVERSUPPLY IS BRINGING THE
ONSHORE SPARE STORAGE CAPACITY TO ITS LIMITS
CPP inventories in key trading hubs*
Mn bbl
• As a result of COVID-19
caused demand destruction,
CPP inventories in the US,
ARA and Singapore combined
have grown counter-
seasonally in April and are
currently above 5-year high
levels, with similar
developments seen globally
• This has put the onshore
storage capacity under
pressure
Note: Based on weekly data for the US, Amsterdam-Rotterdam-Antwerp (ARA) area and Singapore.
Sources: EIA, Reuters, TORM. 48BOTH MEDIUM-HAUL REGIONAL TRADE AND LONG-HAUL
TRADE ARE SUPPORTED BY THE IMO 2020 REGULATION
Examples of trade routes impacted by the IMO 2020 sulfur regulation
• Increased flexibility to
produce additional diesel
in net exporting regions
and refinery expansion
support long-haul and
medium-haul trade
routes across the world
• Additional routes will be
impacted including
shorter distance regional
and coastal trades
49PRODUCT TANKER FREIGHT RATES AT AN ALL-TIME HIGH
LR2 (TC1) MR (average)
USD ‘000/day USD ‘000/day
Source: Clarksons. Spot earnings: LR2: TC1 Ras Tanura-> Chiba, MR: average basket of Rotterdam->NY, Bombay->Chiba, Mina Al Ahmadi->Rotterdam, Amsterdam->Lome,
Houston->Rio de Janeiro, Singapore->Sydney. 50TORM EXPECTS A POSITIVE TCE IMPACT ON THE TORM
FLEET DUE TO THE SCRUBBER INVESTMENTS
Avg. fuel Compliant fuel and
TCE impact per Annual TCE impact
Vessel type consumption, HSFO fuel spread
vessel, USD/day2) per vessel, USDm
tons/day1) assumption, USD/t
MR
Eco vessel ~11 × 100 = ~1,100 0.4
MR
Non-eco vessel ~14 × 100 = ~1,400 0.5
• Scrubber vessels are expected to have lower fuel costs which, in turn, will positively impact the TCE compared to non-scrubber
vessels
• The financial effect will be bigger for the larger vessels with higher fuel consumption
• Decided scrubber investments are based on attractive business cases with a short payback time and with corresponding high IRRs
1) Assumptions: 365 operational days per year, MR scrubber utilization of 90%; based on 2018 actual fuel consumption; assuming 55% steaming ratio.
2) Calculation includes an extra scrubber fuel consumption of 2%. 51OAKTREE IS THE MAJORITY SHAREHOLDER WITH A
REMAINING FREE FLOAT OF 34%
Share information Estimated shareholdings as of May 2020 (%)
TORM’s shares are listed on Nasdaq in
Copenhagen and Nasdaq in New York under 100
the tickers TRMD A and TRMD, respectively.
14
Shares
• 74.8m A-shares, one B-share and one C- 20
66
share
• The B- and the C-shares have certain voting
rights
• A-shares have a nominal value of USD/share
0.01
For further company information,
visit TORM at www.torm.com.
Oaktree Institutional Retail & others Total
52You can also read