Scorpio Tankers Inc. STIFEL Conference Presentation - February 10, 2020
←
→
Page content transcription
If your browser does not render page correctly, please read the page content below
Scorpio Tankers Inc.
STIFEL Conference Presentation
February 10, 2020
Disclaimer and Forward-looking Statements
This presentation includes “forward-looking statements” within the meaning of the safe harbor provisions of the United States Private Securities Litigation Reform Act of 1995. These forward-looking
statements reflect Scorpio Tankers Inc.’s (“Scorpio’s”) current views with respect to future events and financial performance. The words “believe,” “anticipate,” “intend,” “estimate,” “forecast,” “project,” “plan,”
“potential,” “may,” “should,” “expect” and similar expressions identify forward-looking statements. The forward-looking statements in this presentation are based upon various assumptions, many of which are
based, in turn, upon further assumptions, including without limitation, management’s examination of historical operating trends, data contained in Scorpio’s records and other data available from third parties.
Although Scorpio believes that these assumptions were reasonable when made, because these assumptions are inherently subject to significant uncertainties and contingencies which are difficult or
impossible to predict and are beyond Scorpio’s control, Scorpio cannot assure you that it will achieve or accomplish these expectations, beliefs, projections or future financial performance.
Risks and uncertainties include, but are not limited to, the failure of counterparties to fully perform their contracts with Scorpio, the strength of world economies and currencies, general market conditions,
including fluctuations in charter hire rates and vessel values, changes in demand in the tanker vessel markets, changes in Scorpio’s operating expenses, including bunker prices, drydocking and insurance
costs, the fuel efficiency of our vessels, the market for Scorpio's vessels, availability of financing and refinancing, charter counterparty performance, ability to obtain financing and comply with covenants in
such financing arrangements, changes in governmental and environmental rules and regulations or actions taken by regulatory authorities including those that may limit the commercial useful lives of tankers,
potential liability from pending or future litigation, general domestic and international political conditions, potential disruption of shipping routes due to accidents or political events, and other important factors
described from time to time in the reports Scorpio files with, or furnishes to, the Securities and Exchange Commission, or the Commission, and the New York Stock Exchange, or NYSE. Scorpio undertakes no
obligation to update or revise any forward-looking statements. These forward-looking statements are not guarantees of Scorpio's future performance, and actual results and future developments may vary
materially from those projected in the forward-looking statements
This presentation describes time charter equivalent revenue, or TCE revenue, which is not a measure prepared in accordance with IFRS (i.e. a "Non-IFRS" measure). TCE revenue is presented here because
we believe that it provides investors with a means of evaluating and understanding how the Company's management evaluates the Company's operating performance. This Non-IFRS measure should not be
considered in isolation from, as a substitute for, or superior to financial measures prepared in accordance with IFRS.
The Company believes that the presentation of TCE revenue is useful to investors because it facilitates the comparability and the evaluation of companies in the Company’s industry. In addition, the Company
believes that TCE revenue is useful in evaluating its operating performance compared to that of other companies in the Company’s industry. The Company’s definition of TCE revenue may not be the same as
reported by other companies in the shipping industry or other industries. See appendix for a reconciliation of TCE revenue to revenue, please see the Appendix of this presentation.
Unless otherwise indicated, information contained in this presentation concerning Scorpio’s industry and the market in which it operates, including its general expectations about its industry, market position,
market opportunity and market size, is based on data from various sources including internal data and estimates as well as third party sources widely available to the public such as independent industry
publications, government publications, reports by market research firms or other published independent sources. Internal data and estimates are based upon this information as well as information obtained
from trade and business organizations and other contacts in the markets in which Scorpio operates and management’s understanding of industry conditions. This information, data and estimates involve a
number of assumptions and limitations, are subject to risks and uncertainties, and are subject to change based on various factors, including those discussed above. You are cautioned not to give undue weight
to such information, data and estimates. While Scorpio believes the market and industry information included in this presentation to be generally reliable, it has not independently verified any third-party
information or verified that more recent information is not available.

                                                                                                                                                                                                                     2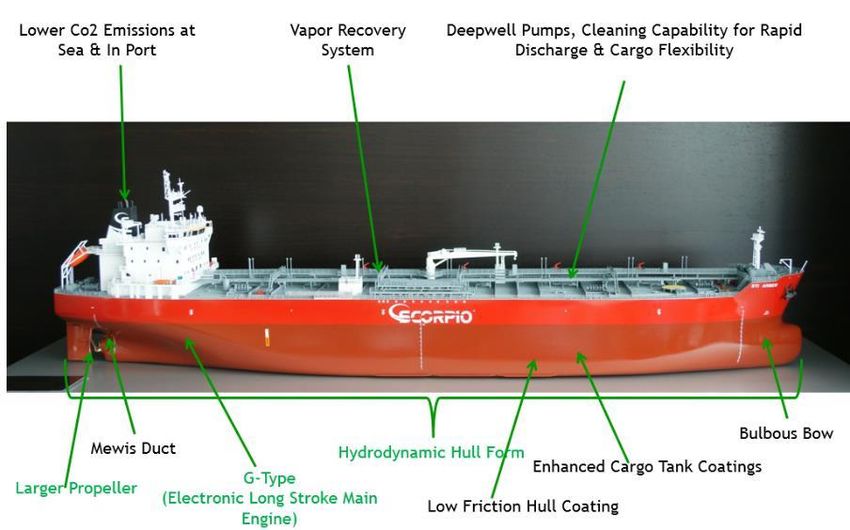
Earnings Reminder

Scorpio Tankers Inc. Fourth Quarter 2020 Earnings Release Date
Date: Thursday, February 18, 2021

Conference Call Details
Date: Thursday, February 18, 2021

Time: 8:30 AM Eastern Standard Time and 2:30 PM Central European Time

US/CANADA Dial-In Number: 1 (855) 861-2416
International Dial-In Number: +1 (703) 736-7422

Webcast Link: https://edge.media-server.com/mmc/p/gp5u9drq

Conference ID: 3055659

                                                                        3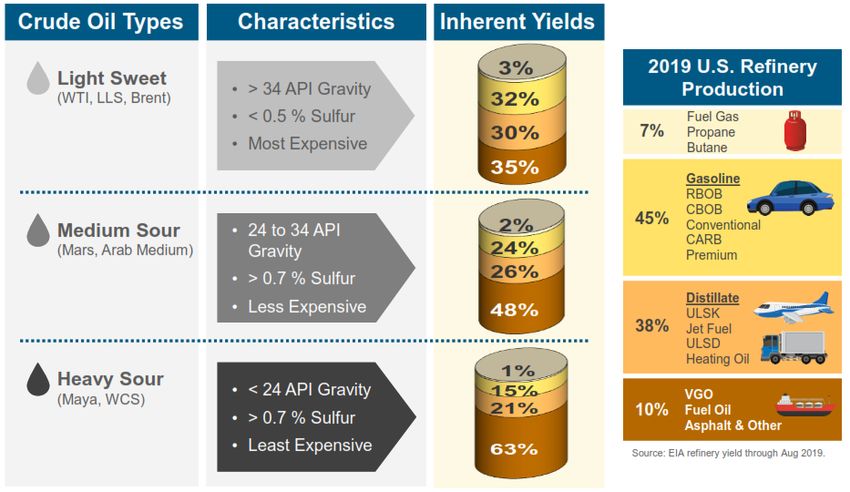
Investment Highlights
                                               • 135 wholly owned, finance leased or bareboat chartered-in tankers on the water with an average age of 5.2 years
  The Largest & Most Modern
  Product Tanker Fleet in the                  • 97 tanks equipped with exhaust gas scrubbers
            World
                                               • Vessels trading within one of the world’s largest product tanker platforms with a strong track record

                                               • Net income of $182.4 million and adjusted EBITDA of $617.2 million for the trailing 12 months ended September 30, 2020
  Strong Financial Position &
      Improving Financial                      • Cash and cash equivalents of $209.7 million as of November 4, 2020
         Performance
                                               • In addition, the company has $63.9 million in committed financing and $75 million under discussion for the refinancing of 11 vessels

                                               • Since 2018, the Company completed $386.4 million in capex payments for drydock, ballast water treatment systems and scrubbers
 Limited Capex Going Forward                   • Remaining capex for FY-20 and FY-21 is $57.6 million
                                               • In addition to the above refinancing's, the Company has $44.2 million of additional liquidity available (after the repayment of existing debt)
                                                 from previously announced financings that have been committed and are tied to scrubber installations

                                               • Repurchased $52.3 million face value of its Convertible Notes due 2022 at an average price of $894.12 per $1,000 principal amount, or $46.7
                                                 million.
    Dividend & Securities
                                               • Repurchased an aggregate of 1,170,000 common shares of the Company at an average price of $11.18 per share in the open market for total
    Repurchase Program
                                                 consideration of $13.1 million
                                               • Quarterly dividend of $.10/share

                                               • $1,000/day increase in average daily rates would generate ~$49 million of incremental annualized cash flow(1)
    Scorpio Has Significant
     Operating Leverage                        • An increase in average daily rates from $20,000 to $25,000 (25%) translates to an increase in annualized cash flow from $421 million to $665
                                                 million, a 57% increase in net cash flow

                                               • Refinery closures and additions are expected to increase seaborne volumes of refined products and ton miles
     Favorable Long Term
                                               • Limited newbuilding orders drives lowest orderbook as a percentage of fleet ever recorded
 Supply/Demand Fundamentals
                                               • Favorable supply/demand environment with demand to outstrip growth in 2021

             1) Based on utilization of 135 vessels and utilization of 365 days per year                                                                                                          4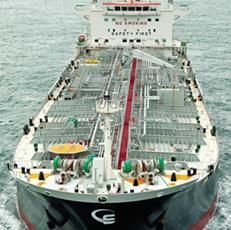
Scorpio Tankers at a Glance
                                          Key Facts                                                     Fleet Overview

                                                                                Largest Product Tanker Fleet in the World
 •   Scorpio Tankers Inc. (“Scorpio”) is the world’s largest product                  with 135 Vessels on the Water
     tanker owner, providing marine transportation of refined                           18x                                  63x
     petroleum products (gasoline, diesel, jet fuel and naphtha) to
     a diversified blue-chip customer base                                            Handymax                               MR
                                                                                (25,000 – 39,999 dwt)               (40,000 – 59,999 dwt)
 •   NYSE-listed with compliant governance

 •   The Company’s fleet consists of 135 wholly owned, finance                          12x                                 42x
     leased or bareboat chartered-in tankers
                                                                                         LR1                                 LR2
 •   Vessels employed in well-established Scorpio pools with a                  (60,000 – 79,999 dwt)              (80,000 – 120,000 dwt)

     strong track record of outperforming the market
                                                                                                Average Age of Fleet:
 •   Headquartered in Monaco, Scorpio is incorporated in the                                         5.2 Years
     Marshall Islands and is not subject to US income tax
                                                                                                Attractive Mix of
 •   Diversified blue-chip customer base                                                   Modern MR and LR Vessels

                                                                                              Scrubber Fitted Vessels:
                                                                                                   97 vessels1

                                                                                               91% of Fleet Built at
                                                                                           Leading Korean Shipyards2

            1)   As of Novemeber 5, 2020
            2)   Includes Tankers built at Hyundai’s Vinashin yard in Vietnam                                                               5
What are Product Tankers?
 • Product tankers provide marine transportation of refined petroleum products or “clean products” (gas oil/diesel, gasoline, jet
   fuel and naphtha), while crude tankers transport “dirty products” (crude oil and fuel oil)

 • Product tankers have coated tanks, typically epoxy, making them easy to clean and preventing cargo contamination and hull
   corrosion, whereas crude tankers have uncoated tanks

                          Product Tanker Segments                                                  Product Tanker Cargos

                                              Cargo       Vessels on
 Product Tanker Segment           DWT        Capacity     the Water                                                        Chemicals

                                                                                       Naphtha
                                  80,000-     615,000-
                                                            42
                                                                                                                            Clean
                                                                                   Clean Condensate
                                  120,000     800,000                                  Jet Fuels
                                                                                                                           Products
     Long Range 2 “LR2”            DWT          bbls                                   Kerosene
                                                                                                                               -
                                                                                       Gasoline                                -
                                  60,000-     345,000-
                                                            12
                                                                                         Vegoil                                -
                                  79,999      615,000                                   Gasoils                                -
     Long Range 1 “LR1”            DWT          bbls                                    Diesels                                -

                                  40,000-      300,000-
                                                            62
                                                                                      Cycle Oils                             Dirty
                                  59,999       350,000                                Fuel Oils                            Products
   Medium Range “MR”               DWT           bbls
                                                                                                                           Crude Oil

                                                            18
                                  25,000-      200,000-
                                  39,999       250,000
     Handymax                      DWT           bbls

                                                                                                                                       6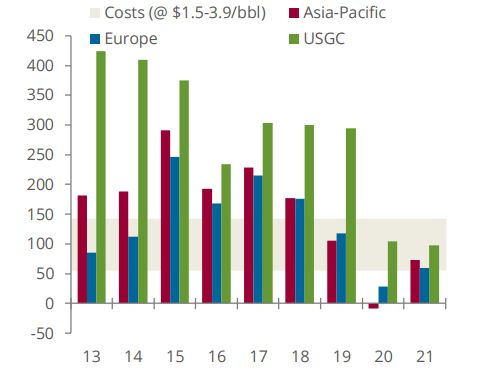
Largest & Most Modern Product Tanker Fleet in the World
 •     World’s largest and youngest product tanker fleet, including the leading owner in the MR and LR2 product tanker segments

 •     While a significant portion of the global MR and LR fleets are older than 15 years of age, the Scorpio fleet has an average age of 5.2 years

                         Largest & Most Modern Product Tanker Fleet                                                                Average Age vs. Worldwide Fleet

     (# of Ships)                                                                                                16
                                        HM     MR       LR1      Total     Average Age
     150                                                                                                                    14.8
                                                                                                                                                     Scorpio Tankers   Active Fleet
                135
                                                                                                                 14

     120                                                                                                         12                                          11.6
                    42
                                                                                                                                              10.7

                                                                                                                 10                                                              9.5
                                  89
      90
                    12             6
                                                                                                                      7.8
                                                 72                                                              8

                                  29                           65
                                                 10
      60                                                       14             55                                 6
                                                 9                                        50                                            5.1
                                                                                                                                                       4.7                 4.9
                    63                                                        11                      45
                                                               13                                      5
                                                                              11                                 4
      30                          43
                                                 51                                       44          24
                                                               33                                                2
                                                                              33
                18                              10.4          12.2                       12.3
                                  7.6                                         9.4         6           8.3
                                                                                                      16
                5.2               11
       0                                         2                                                               0
               Scorpio         BW/Hafnia       TORM           COSCO        SCF Group   Diamond S   A.P. Moller        Handymax            MR             LR1                  LR2

                         Source: Clarksons Shipping Intelligence, February 2020
                         Note: Figures do not include newbuild vessels on order.                                                                                                       7
Financial Performance
Average Fleet TCE ($/day) Revenue
Millions $USD
$30,000 $29,693
$350 $346.2
$25,000 $22,644 $300
$19,910 $254.2
$20,000 $18,570 $250 $221.6
$15,100 $195.8
$14,348 $13,560 $200 $177.3
$15,000
$150.8
$150 $136.1
$10,000
$100
$5,000
$50
$0 $0
Q1-19 Q2-19 Q3-19 Q4-19 Q1-20 Q2-20 Q3-20 Q1-19 Q2-19 Q3-19 Q4-19 Q1-20 Q2-20 Q3-20
Adjusted EBITDA Net Income (Loss)
Millions $USD Millions $USD
$200 $300
$252.0
$143.9
$150 $250
$100 $200
$158.7
$46.6
$50 $150 $124.4
$14.5 $12.0 $113.2
$0 $100 $82.1
$71.8
$54.5
($50) $(29.7) $(20.2) $50
$(45.3)
($100) $0
Q1-19 Q2-19 Q3-19 Q4-19 Q1-20 Q2-20 Q3-20 Q1-19 Q2-19 Q3-19 Q4-19 Q1-20 Q2-20 Q3-20
8Limited Capex & No Major Upcoming Debt Maturities
• Since 2018, the Company completed $386.4 million in capex payments for drydock, ballast water treatment systems and scrubbers
• Remaining capex for FY-20 and FY-21 is $57.6 million
• The Company has $61 million of committed scrubber financing that has yet to be drawn
Company CapEx (Drydock, BWTS & Scrubber Installations) Quarterly Debt Amortization Payments
$100
$250
$204.0 $78.3
$80
$200 $72.7 $73.2 $73.3
$68.8
$173.0
$17.3 $60 33.1
$150
$40
$100 $204.0 $72.7 $73.2 $73.3
$68.8
$155.7
$49.0 $45.2
$20
$50 $40.3
$26.7
$40.3 $49.0
$26.7
$0 $0
FY-18 FY-19 FY-20* FY-21* FY-22* Q4-20 Q1-21 Q2-21 Q3-21 Q4-21
Payments Made Remaining Payments Payments Made through November 4, 2020 Scheduled Principal Repayments
9Summary of Debt Drawdowns, Repayments and Issuance
• From the period October 1, 2019 and September 1, Summary of Debt Drawdowns, Repayments and Issuance
2020 the Company repaid $297 million in debt,
including: From October 1, 2019 through September 30, 2019 Amount (USD$ Millions)
• $53.8 million of unsecured notes repaid in May
2020 Outstanding debt October 1, 2019 $ 3,193,994
• $52.3 million of the Company’s convertible Leasehold interest in four Trafigura vessels 138,800
notes due May 2022
• $191.0 million of debt amortization payments Drawdowns on scrubber finance 44,700
May 2020 unsecured notes issuance 28,100
May 2020 unsecured notes redemption (53,750)
Repurchase of convertible notes (52,300)
Debt repayments, net (190,950)
Outstanding debt September 30, 2020 $ 3,108,594
Debt repayments, net is the debt amortization payments less any drawdowns from vessel refinancing's
Leasehold interest in four Trafigura newbuild vessels, which delivered in 2020, and are apart of the $670 million lease financing or #29 in the debt table of the Q3-20 earnings release 10Potential Cash Flow Generation
Potential Annual Cash Flow Generation Excluding Debt Repayment Potential Annual Cash Flow Generation Including Debt Repayment
Millions $USD Millions $USD
$2,500
$2,500
$2,000
$2,000
$1,500 $1,500
$1,128
$882
$1,416
$636
$1,170
$1,000 $389
$1,000 $924
$143
$677
$431
$288
$500 $500
$555 $555
$0 $0
OPEX, Cash $20,000 $25,000 $30,000 $35,000 $40,000 OPEX, Cash Principal $20,000 $25,000 $30,000 $35,000 $40,000
G&A & Interest G&A & Repayment
Interest
TCE Rate ($/day) (1) TCE Rate ($/day) (1)
(1) TCE Rate reflects a market TCE Rate for a non-scrubber ECO vessel.
Note: Annual revenue calculated as TCE Rate x 365 days x number of vessels. Based on 135 vessels and assumes vessel cash breakeven of $17,100 per day and debt repayment of $288 million in FY-21
11Short Term Market Update
Refined Product Floating Storage (million barrels) (1)
• Despite a significant recovery in oil demand since April, global demand
continues to balance its recovery with the impact of the pandemic
120
107.3
• Asia demand for refined products has surged and expected to continue 100
through their sustained recovery in manufacturing and economic activity 78.8
80 67.9
• Demand in Europe and North America has lagged, but is expected to 60 50.2
accelerate as vaccine rollouts increase personal mobility and demand for 38.9 36.8 39.2 36.8
40 31.7
gasoline, diesel and jet fuel 23.0
20
• Floating storage inventories continue to decline as land based inventories 0
remain well below Q3-20 levels Apr-20 May-20 Jun-20 Jul-20 Aug-20 Sep-20 Oct-20 Nov-20 Dec-20 Jan-21
• Floating storage inventories are down from 107.3 million barrels in May
to 31.7 million barrels in January Refinery Maintenance Schedule – CDU Capacity Offline (mb/d) (2)
• USG gasoline and jet inventories are below the five year avg while
16.0
2021e Avg 2017-2019
diesel is above but has decreased by 8 million barrels since Aug-20 (3)
13.5 13.1
14.0
• Refinery maintenance is expected to be substantially lower than prior years 12.0 11.3
given the significant maintenance completed over the last 12 months 10.2
10.0 8.7
8.6
• Rates are expected to improve given the season winter uptick from heating 8.0
6.5 6.5
6.1 5.8
oil demand, wide NW Europe-Far East naphtha arb and conclusion of 6.0
5.6
refinery maintenance 3.5
4.0
1.7
2.0 0.8
0.0
Jan Feb Mar Apr May Jun Jul
1) Clarksons Shipping Intelligence, February 2021
2) Energy Aspects, February 2021
3) EIA, January 2021
12Asia Has Led the Demand Recovery in Refined Products
• Asia’s ability to reduce COVID outbreaks has led to a strong recovery in economic activity, increased demand for refined products
and consequently higher freight rates for vessels trading East of the Suez canal
COVID Cases (1) MR Avg Spot TCE Earnings ($/day) (2)
West of Suez East of Suez
90,000
$14,000
Total Cases/1M Pop Active Cases/1M Pop
80,000 $12,321
$12,000
70,000
$10,000
60,000
$8,610
$7,790
50,000 $8,000 $7,534
$6,979 $6,932
40,000 $5,974
$6,000
30,000 $4,514
$4,000
20,000
$2,000
10,000
- $0
USA UK Brazil Germany Mexico India Japan S. Korea China Sep-20 Oct-20 Nov-20 Dec-20
1) Worldometers, February 7, 2021
2) Clarksons Shipping Intelligence, February 2021 13West to Follow Asian Demand Recovery with Vaccine Rollout
• Limitations on personal mobility in Europe, North America and South America has led to a slower recovery in demand for refined products
and consequently lower freight rates for vessels trading West of the Suez canal
• However, increasing vaccine doses and declining COVID cases in the West are set to unleash significant pent up demand for refined
products
(1) Refined Product Demand North/South America & Europe (mb/d) (2)
COVID Vaccine Doses Administered (millions)
80.0 Diesel Gasoline Naphtha Jet
US Brazil Mexico UK France Germany Italy 39.4
40.0 38.5 38.3
37.5 36.7
70.0 35.9 36.6
34.7
35.0 33.6 33.7 33.4
60.0
30.0 28.5
50.0
25.0
40.0
20.0
30.0
15.0
20.0
10.0
10.0
5.0
0.0
04-Jan-21
11-Jan-21
18-Jan-21
25-Jan-21
01-Feb-21
08-Feb-21
28-Dec-20
0.0
Q1-19
Q2-19
Q3-19
Q4-19
Q1-20
Q2-20
Q3-20
Q4-20
Q1-21e
Q2-21e
Q3-21e
Q4-21e
1) Bloomberg, February 9, 2021
2) Energy Aspects, February 2021 14LR2 Rates Have Been a Leader in the Tanker Space
• While product and crude tanker rates declined from the conclusion of floating storage contracts and lower exports due the 2 nd wave of
COVID lockdowns, LR2 spot rates outperformed all other tanker classes in Q4-20
• The LR2’s have benefited from increased naphtha demand in Asia which has offset reductions in diesel and gasoline volumes
Q4-20 Average Spot TCE Earnings ($/day) (1) LR2 Cargo Carriage 2019 vs 2021
FY-19 FY-20
$15,857
$15,404 46%
41%
36%
33%
$6,455 $6,432
$5,713
13%
10% 10% 11%
LR2 VLCC Suezmax MR Aframax Diesel Naphtha/Condensate Gasoline Kerosene/Jet
1) Clarksons Shipping Intelligence, February 2021 15Product Tanker Demand Drivers
Increased Volumes Voyage Distance Product Tanker
(Seaborne Trading Activity Demand
Exports) (Ton Mile Demand)
• Oil consumption • Dislocation • Arbitrage opportunities
growth between refinery from price volatility
and consumer
• Refinery margins • Low inventory levels
• Refining capacity
• Refinery expansions have • Growing regional
throughput moved closer to the imbalances from crude
well head and slates, product grades
further away from and refining capacity
the consumer
16Long Term Fundamentals
Oil and Refined Product Demand Expected to Continue to Recover through 2021
• Oil demand expected to continue to recover and the IEA expects oil demand to increase 5.5 mb/d in 2021 to 96.6 mb/d (1)
• Seaborne refined product exports and ton mile demand are estimated to increase 6.1% and 6.4%, respectively (2)
Refining Capacity Closures & Expansions Expected to Increase Product Exports & Ton Miles
• Older and less efficient refineries face a wave of closures due to weak refining margins, tightening environmental rules and overseas competition, prompting
some owners to opt to converting to import terminals or biofuels production facilities
• At the same time, over 1 million barrels of complex refining capacity will come online in the Middle East in 1H-21
Limited Newbuilding Orders & Aging Fleet Extends Limited Fleet Growth
• Limited newbuilding orders have kept the current orderbook near all-time lows
• Including newbuilding deliveries, a significant portion of the product tanker fleet will turn 15 years old over the next three years
Environmental Regulations to Benefit Modern Vessels
• The EU has put pressure on the IMO to accelerate it’s 2030 GHG emission targets and may implement its own ETS system by 2023
• While it’s unclear how the timeline of these plans will accelerate, the focus on reducing GHG emissions in the shipping sector is clear and modern fuel
efficient vessels will be in the best position to benefit from increasing regulation
1) IEA Oil Market Report, February 2021
2) Clarksons Shipping Intelligence, February 2021 17Global Refinery Closures Accelerate
• Older inefficient refineries face a wave of closures due to weak refining margins, tightening environmental rules and overseas competition, prompting some owners to
opt for closure or converting plants for storage or biofuels production
• After closing, the lost production in these regions is likely to be replaced through imports
• At the same time, the Middle East is adding over 1 million barrels of complex and export oriented refining capacity in 1H-21
• Q1-21 – Jazan refinery in Saudi Arabia, 400 kb/d
• Q2-21 - Al Zhour refinery in Kuwait with 615 kb/d
• The combination of refinery closures and additions is expected to increase seaborne volumes of refined products and ton miles
Gross Annual Profit for a 100 kb/d Refinery ($ million/year) (1) Announced Refinery Closures
Operator Location Capacity (kbd) Timing
MPC Martinez, California (USA) 161 2020
MPC Gallup, NM (USA) 26 2020
PBF Paulsboro, NJ (USA) 170 2020
HFC Cheyenne, WY (USA) 52 2020
Shell Convent, LA (USA) 211 2020
North Atlantic Come by Chance, Canada 135 2021
Total Granpuits, France 101 2021
Gunvor Group Antwerp, Belgium 110 2021
Neste Naantali, Finland 55 2021
Galp Port Refinery, Portugal 110 2021
Shell Tabangao, Philippines 110 2020
Refining NZ Marsden Point, New Zealand 40 2021
BP Kwinana Beach, Australia 146 2020
Cosmo Oil Osaka, Japan 115 2021
1) Argus Media, Refinitiv, Energy Aspects February 2021 18Impact of Closing Australia’s Kwinana & Altona Refinery
Australia Refining Capacity
• BP announced that they are closing their 146 kb/d Kwinana refinery in
Australia at the end of 2020 Refinery Owner Capacity (kb/d) Status
Altona Exxon Mobil 90 Closing
• In February 2021 Exxon Mobil announced that they will be closing Geelong Viva Energy 120 Active
their Altona Refinery
Lytton Ampol 128 Active
• Australia already imports more than 50% of it’s refined product Kwinana BP 146 Closing
demand and imports have continued to increase since 2015 Total Refining Capacity 484
• To replace the lost production from the Kwinana and Altona refineries,
Australia Refined Product Imports (kb/d) (1)
Australia will need to import an additional 236 kb of refined product
per day or 86 million barrels of refined product per year
Product Imports Kwinana Altona
900
815 815
• Assuming the lost production is replaced by imports from Saudi 800
90
Arabia and Singapore it would: 700
146
579
• 600 549 564
Require an additional 23 MRs or 11 LR1/LR2s per year 499 507
500
(kb/d)
• Increase seaborne refined product ton mile demand by 2.2% (2) 400
300
200
100
-
2015 2016 2017 2018 2019 Kwinana Altona Post
Closure Closure
1) JODI, February 2021
2) Clarksons Shipping Intelligence, February 2021 (estimates seaborne trade of 2,860.6 million ton miles for refined products in 2020) 19Regional Diesel & Gasoline Balances
FSU
Europe
1.1
(1.3)
North America 0.1
1.2
0.8 Asia
0.1 0.8
Middle East
(0.3)
Africa 0.8
(1.1) (0.2)
(0.8)
Latin America
(1.1)
(1.3)
Diesel surplus / (deficit) in mb/d
Gasoline surplus / (deficit) in mb/d
Source: Energy Aspects, estimates are for FY-21 20Orderbook as % of Fleet Remains Near Historical Low
• Limited newbuilding orders coupled with a low orderbook has kept orderbook as % of fleet near historical lows
Newbuilding Orders Orderbook as % of Fleet
MR LR1 LR2
25.0%
Product Tanker 10K+ Orderbook % Fleet
450 433
5 Yr Avg
400 78 10 Yr Avg
350 20.0%
67
300
255
(# of Vessels)
250 15.0%
62
200 185 179 179 188
21 15 21
25 153
150 42
51 53 24 288 35 118 10.0%
106 112 111 106
95
100 10 11 11 11 193 35 38 81 83
17 33 17 17
64 62 67
57 15 1 6.6%
130 125 25
50 10 113 111 15 2 20
79 68 83 28 14 92 83 22 75
1 58 60 68
44 14 35 53 47 5.0%
3 3
13 17 3
0
2000
2001
2002
2003
2004
2005
2006
2007
2008
2009
2010
2011
2012
2013
2014
2015
2016
2017
2018
2019
2020
2021
Source: Clarksons Research Intelligence, February 2021 21Seaborne Ton Mile Demand to Outpace Supply in 2021
Ton Mile Demand vs Product Tanker Fleet Growth
Product Tanker Net Fleet Growth Seaborne Refined Products Exports
10.0%
8.0%
7.4%
6.0% 6.3% 6.1%
4.8% 5.7% 4.5% 4.7%
4.0% 3.9% 4.2%
2.5%
2.0% 2.6% 1.5% 1.9% 2.4%
1.1% 1.0%
0.0% -0.2%
-1.0%
-2.0%
-4.0%
-5.0%
-6.0%
-7.2%
-8.0%
2013 2014 2015 2016 2017 2018 2019 2020 2021e 2022e 2023e
Clarksons Shipping Intelligence, February 2021
Note: Supply slippage on scheduled newbuilding deliveries of 20% for 2021-2023, Scrapping assumptions for 22021-2023 is 2.0 million dwt per year. 22Significant % of the Fleet Turning 15 Years & Older
• Certain key customers will only employ product tankers 15 years & younger
• This limits trading opportunities for older tonnage and creates a two-tiered market where;
• Owners consider continuing to carry refined products, switching from products to crude, vessel conversion, storage, and scrapping
• There are currently 652 product tanker vessels that are 15 to 19 years old and an additional 957 vessels turning 15 over the next five years
• With only 174 product tanker vessels on order and the potential for new environmental regulation the active product tanker fleet could
experience a continued reduction in supply
Fleet Age Profile Today
1,200 HM/MR LR1/LR2
1,000 957
800 306
(# of Vessels)
652
593
600 154
141
409
400
131 651 257
174 452 498 36
200
52 278
221
122
0
Vessels on Order 0-4 5-9 10-14 15-19 20 & Older
Age (Years)
Source: Clarksons Research Intelligence, February 2021 23MR Vessels Turning 15 Years Old Exceeds Newbuild Deliveries
• Prior to 2018, newbuilding MR vessel deliveries had never exceeded the number of vessels turning 15 years old each year
• During the next four years, 456 MRs will turn 15 years and older which is significantly greater than the total MR orderbook of 108 vessels today
MR Newbuilding Deliveries vs. Vessels Turning 15 Years Old
MR Newbuild Deliveries MR Vessels Turning 15 Years Old
150
100
50 100 93
78 88
75 67 64
59 47 38
22
0
-22 -18 -15
-28 -35
-57
-88 -78 -78
-50 -105
-132 -141
-100
-150
-200
2013 2014 2015 2016 2017 2018 2019 2020 2021 2022 2023 2024
Source: Clarksons Research Intelligence, February 2021 24
Assumes 20% slippage on newbuild MR deliveries.Increasing Environmental Regulations to Benefit Modern Vessels
• The EU has put pressure on the IMO to accelerate it’s 2030 GHG emission targets and implement and may implement its own ETS system by 2023
• It’s unclear how the timeline of these plans will accelerate, but the focus on reducing GHG emissions in the shipping sector is clear
• Modern fuel-efficient vessels will benefit given their lower GHG emissions while older less efficient vessels may undergo retrofits or be scrapped
• Scorpio is well positioned for future regulation as it operates the largest and youngest fleet of scale with an average age of 5.2 years
Scorpio Fleet ECO vs Non-ECO Worldwide Fleet ECO vs Non-ECO
ECO Non-ECO
ECO Non ECO
82%
100% 100% 100% 76%
78% 61%
53%
47%
39%
24%
22% 18%
0% 0% 0%
HM MR LR1 LR2 HM MR LR1 LR2
Source: Clarksons Shipping Intelligence, February 2021
Note: ECO defined as vessels built in 2012 and later 25Appendix
Appendix 1
26Product Tankers in the Oil Supply Chain
• Crude Tankers provide the marine transportation of the crude oil to the refineries.
• Product Tankers provide the marine transportation of the refined products to areas of demand.
• Structural demand drivers in the product tanker industry:
• US has emerged as a refined products powerhouse, becoming the worlds largest product exporter
• Changes in refinery locations, expansion of refining capacity in Asia and Middle East as well as a reduction in OECD refining capacity (Europe &
Australia).
• Changes in consumption demand growth in Latin America, Africa, and non-China/Japan Asia and lack of corresponding growth in refining capacity
• Balance of trade: needs of each particular region- gasoline/diesel trade between U.S./Europe is a prime example of this given significantly different
diesel penetration rates for light vehicles
• Europe imports surplus diesel from the United States, and exports surplus gasoline to the United States.
Exploration & Crude Transportation Refining Products Terminalling &
Production Transportation Distribution
Refined products are moved from Terminals are located closer to
Oil production includes drilling, Crude oil is transported to the Refineries convert the crude oil into
the refinery to the end users via transportation hubs and are the final
extraction, and recovery of oil refinery for processing by crude a wide range of consumable
product tankers, railcars, pipelines staging point for the refined fuel
from underground. tankers, rail cars, and pipelines. products.
and trucks. before the point of sale.
27What is in a Barrel of Crude Oil?
Source: Valero & EIA, December 2019
28Product & Crude Tankers
Tankers
“Dirty” “Clean”
Crude Products
Vessel VLCC Suezmax Aframax Panamax Handysize LR2 LR1 Hmx/MR Handysize
(200,000 + (120,000 - (80,000 - (60,000 - (< 60,000 (80,000- (60,000- (25,000- (Product Tanker Specifications
IMO Classes I, II, & III
IMO Class I Chemical
IMO Class I refers to the transportation of the most hazardous,
Tankers
very acidic, chemicals. The tanks can be stainless steel, epoxy or
marine-line coated.
IMO Class II Chemical &
Product Tankers IMO Class II carries Veg & Palm Oils, Caustic Soda. These tanks
tend to be coated with Epoxy or Stainless steel.
IMO Class III Product Tankers
Typically carry refined either light, refined oil “clean” products or
“dirty” heavy crude or refined oils.
• Product tankers have coated tanks, typically epoxy, making them easy to clean and preventing
cargo contamination and hull corrosion.
• IMO II & III tankers have at least 6 segregations and 12 tanks, i.e. 2 tanks can have a common line
for discharge.
• Oil majors and traders have strict requirements for the transportation of chemicals, FOSFA cargoes
(vegetable oils and chemicals), and refined products.
• Tanks must be completely cleaned before a new product is loaded to prevent contamination.
30Design Features on Scorpio Product Tankers
31Scrubber Fuel Savings
Consumption figures below assume that:
• Scrubbers do not operate during any port activities
• Each voyage has a load and discharge port in an ECA, i.e. scrubber does not operate in
ECA waters
Annual ECO Vessel Fuel Consumption (MT/year) (1)
Sailing (Ballast & Laden) MR LR1 LR2
Non ECA 4,641 5,072 6,019
Waiting/Idle
Non ECA 153 272 347
Less
Additional Consumption for Scrubber -252 -257 -261
Total Non ECA Consumption (MT) 4,542 5,087 6,105
MGO-HSFO Spread ($/MT) $200 $200 $200
Annual Scrubber Savings $908,400 $1,017,450 $1,220,940
Scrubber TCE Savings ($/day) $2,489 $2,788 $3,345
Every $100 change in fuel spread equates to TCE savings
$1,244 $1,394 $1,673
of ($/day)
(1) Based on average Scorpio ECO vessel consumption in 2018. 32Fleet List
Owned & Finance Lease Vessels
Name Year DWT Type Name Year DWT Type Name Year DWT Type
STI Comandante May-14 38,734 HM STI Manhattan Mar-15 49,990 MR STI Elysees Jul-14 109,999 LR2
STI Brixton Jun-14 38,734 HM STI Queens Apr-15 49,990 MR STI Madison Aug-14 109,999 LR2
STI Pimlico Jul-14 38,734 HM STI Osceola Apr-15 49,990 MR STI Park Sep-14 109,999 LR2
STI Hackney Aug-14 38,734 HM STI Notting Hill May-15 49,687 MR STI Orchard Sep-14 109,999 LR2
STI Acton Sep-14 38,734 HM STI Seneca Jun-15 49,990 MR STI Sloane Oct-14 109,999 LR2
STI Fulham Sep-14 38,734 HM STI Westminster Jun-15 49,687 MR STI Broadway Nov-14 109,999 LR2
STI Camden Sep-14 38,734 HM STI Brooklyn Jul-15 49,990 MR STI Condotti Nov-14 109,999 LR2
STI Battersea Oct-14 38,734 HM STI Black Hawk Sep-15 49,990 MR STI Rose Jan-15 109,999 LR2
STI Wembley Oct-14 38,734 HM STI Galata Mar-17 49,990 MR STI Veneto Jan-15 109,999 LR2
STI Finchley Nov-14 38,734 HM STI Bosphorus Apr-17 49,990 MR STI Alexis Jan-15 109,999 LR2
STI Clapham Nov-14 38,734 HM STI Leblon Jul-17 49,990 MR STI Winnie Mar-15 109,999 LR2
STI Poplar Dec-14 38,734 HM STI La Boca Jul-17 49,990 MR STI Oxford Apr-15 109,999 LR2
STI Hammersmith Jan-15 38,734 HM STI San Telmo Sep-17 49,990 MR STI Lauren Apr-15 109,999 LR2
STI Rotherhithe Jan-15 38,734 HM STI Donald C. Trauscht Oct-17 50,000 MR STI Connaught May-15 109,999 LR2
STI Amber Jul-12 49,990 MR STI Esles II Jan-18 50,000 MR STI Spiga Jun-15 109,999 LR2
STI Topaz Aug-12 49,990 MR STI Jardins Jan-18 50,000 MR STI Savile Row Jun-15 109,999 LR2
STI Ruby Sep-12 49,990 MR Marlin Magic Jan-19 47,500 MR STI Kingsway Aug-15 109,999 LR2
STI Garnet Sep-12 49,990 MR Marlin Majestic Jan-19 47,500 MR STI Lombard Aug-15 109,999 LR2
STI Onyx Sep-12 49,990 MR Marlin Mystery Feb-19 47,500 MR STI Carnaby Sep-15 109,999 LR2
STI Fontvieille Jul-13 49,990 MR Marlin Marvel Mar-19 47,500 MR STI Grace Mar-16 109,999 LR2
STI Ville Sep-13 49,990 MR Marlin Magnetic Mar-19 47,500 MR STI Jermyn Jun-16 109,999 LR2
STI Opera Jan-14 49,990 MR Marlin Millennia May-19 47,500 MR STI Selatar Feb-17 109,999 LR2
STI Duchessa Jan-14 49,990 MR Marlin Master Jun-19 47,500 MR STI Rambla Mar-17 109,999 LR2
STI Texas City Mar-14 49,990 MR Marlin Mythic Jul-19 47,500 MR STI Solidarity Nov-15 109,999 LR2
STI Meraux Apr-14 49,990 MR Marlin Marshall Jul-19 47,500 MR STI Stability Jan-16 109,999 LR2
STI San Antonio May-14 49,990 MR Marlin Modest Aug-19 47,500 MR STI Solace Jan-16 109,999 LR2
STI Venere Jun-14 49,990 MR Marlin Maverick Sep-19 47,500 MR STI Symphony Feb-16 109,999 LR2
STI Virtus Jun-14 49,990 MR Marlin Miracle Jan-20 47,500 MR STI Sanctity Mar-16 109,999 LR2
STI Aqua Jul-14 49,990 MR Marlin Maestro Jan-20 47,500 MR STI Steadfast May-16 109,999 LR2
STI Dama Jul-14 49,990 MR Marlin Mighty Mar-20 47,500 MR STI Grace May-16 113,000 LR2
STI Benicia Sep-14 49,990 MR Marlin Maximus Sep-20 47,500 MR STI Gallantry Jun-16 113,000 LR2
STI Regina Sep-14 49,990 MR STI Excel Nov-15 74,000 LR1 STI Supreme Aug-16 109,999 LR2
STI St Charles Sep-14 49,990 MR STI Excelsior Jan-16 74,000 LR1 STI Guard Aug-16 113,000 LR2
STI Mayfair Oct-14 49,990 MR STI Expedite Jan-16 74,000 LR1 STI Guide Oct-16 113,000 LR2
STI Yorkville Oct-14 49,990 MR STI Exceed Feb-16 74,000 LR1 STI Goal Nov-16 113,000 LR2
STI Memphis Nov-14 49,995 MR STI Experience Mar-16 74,000 LR1 STI Guantlet Jan-17 113,000 LR2
STI Milwaukee Nov-14 49,990 MR STI Express May-16 74,000 LR1 STI Gladiator Jan-17 113,000 LR2
STI Battery Dec-14 49,990 MR STI Executive May-16 74,000 LR1 STI Gratitude May-17 113,000 LR2
STI Soho Dec-14 49,990 MR STI Excellence May-16 74,000 LR1 Marlin Lobelia Jan-19 110,000 LR2
STI Tribeca Jan-15 49,990 MR STI Pride Jul-16 74,000 LR1 Marlin Lotus Jan-19 110,000 LR2
STI Gramercy Jan-15 49,990 MR STI Providence Aug-16 74,000 LR1 Marlin Lily Jan-19 110,000 LR2
STI Bronx Feb-15 49,990 MR STI Precision Oct-16 74,000 LR1 Marlin Lavender Feb-19 110,000 LR2
STI Pontiac Mar-15 49,990 MR STI Prestige Nov-16 74,000 LR1
33www.scorpiotankers.com
You can also read