FULL YEAR RESULTS 2019 - Ingenia Lifestyle Plantations, NSW
←
→
Page content transcription
If your browser does not render page correctly, please read the page content below
2019
                                     FULL YEAR
                                     RESULTS
                                     Creating Australia’s best lifestyle and holiday communities

Ingenia Lifestyle Plantations, NSW
Highlights

   FINANCIAL                                                   STRATEGY

   •   Guidance exceeded - third consecutive year              •   Capital recycling - $32 million non-core assets divested
   •   EBIT $61.5 million – up 26% on FY18                     •   Rental base increased by 8% (now 7,775 sites) generating
   •   Underlying EPS 21.0 cents – up 19% on FY18                  stable cash flows
   •   Revenue of $228.7 million – up 21% on FY18              •   Capital partnership established with Sun Communities
   •   Operating cash flow of $59.3 million – up 26% on FY18   •   Eighth Gate funds management platform to be acquired
                                                                   August 2019 - ~$140 million AUM

   OPERATIONS                                                  DEVELOPMENT

   •   Rental revenue continuing to grow –                     •   Sector leading development pipeline – more than 3,700
       up 10% on FY18 to $68.1 million                             home sites secured
   •   Lifestyle average rent up 3% to $168 per week           •   Ten projects under development with two forecast to
   •   High occupancy across Ingenia Gardens portfolio – 91%       commence in FY20

   •   Settled 336 new homes - up 17% on record FY18 (adds
       $2.7 million to annual rental income)

                                                                                                                              2
Delivering strategic initiatives
Building rental base and enhancing capital efficiency – four key initiatives
On balance sheet acquisitions - Three established communities acquired (700+ income producing sites)
1 $73 million invested to expand
rental base
Acquired 330+ potential new home sites (100% Ingenia)
Multiple opportunities under assessment
Builds footprint in key clusters; grows rental base through co-investment
Funds management –
2 $140 million AUM
(1,600 income producing sites)
Diversifies revenue through complementary business
Leverages existing platform – improves ROE
Longer term opportunity to acquire assets
Joint Venture with Sun Communities provides capital efficient way to fund
asset creation (six greenfield sites acquired or under assessment)
3 Capital partnership
(first projects to commence FY20)
Attractive fee streams – enhances project returns
Leverages existing platform – improves ROE
Right to acquire completed asset in place
New record new home settlements FY19 – 336 homes settled
4 Growing new home settlements
($2.7 million pa additional rent)
Continued strong underlying demand as pipeline expands
New rental contracts typically provide for rental growth of CPI plus 2%
3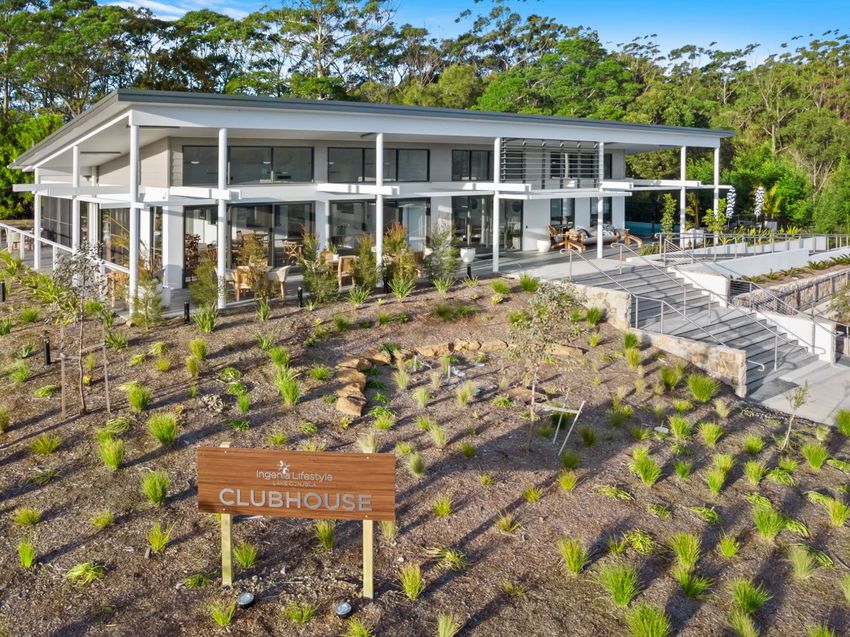
Key competitors
                     •        Ingenia is the largest ASX listed lifestyle and holidays group
                     •        Further consolidation expected as global landlords seek entry/scale

                              Allswell Communities
                         80   (managed from 22 August 2019)

                         70

                         60
No. of communities

                                                                                                                                                                                                                             Other
                         50
                                                                                                                                                                                                                             Tourism Parks

                         40                                                                                                                                                                                                  Rental Villages

                                                                                                                                                                                                                             Mixed Use
                         30
                                                                                                                                                                                                                             Lifestyle
                                                                                                                                                                                                                             Communities
                         20

                         10

                         0
                                Ingenia    Discovery    Hometown   NRMA     Eureka   Palm Lake     Lifestyle Hampshire Living Gems /   Aspen      Eighth      Serenitas/GIC   Halcyon   Secura      Boyuan (ASX: Seachange
                              Communities Holiday Parks                               Resorts    Communities              Gem Life              Gate/Allswell                           Lifestyle      BHL)

                                 Public     Pension     Pension    Mutual   Public    Private      Public        PE       Private/     Public      Fund        Sovereign      Private   Fund          Public     Private
                                                                                                                          Public                                 Fund
                                                                                                                            JV

                                                                                                                                                                                                                               4
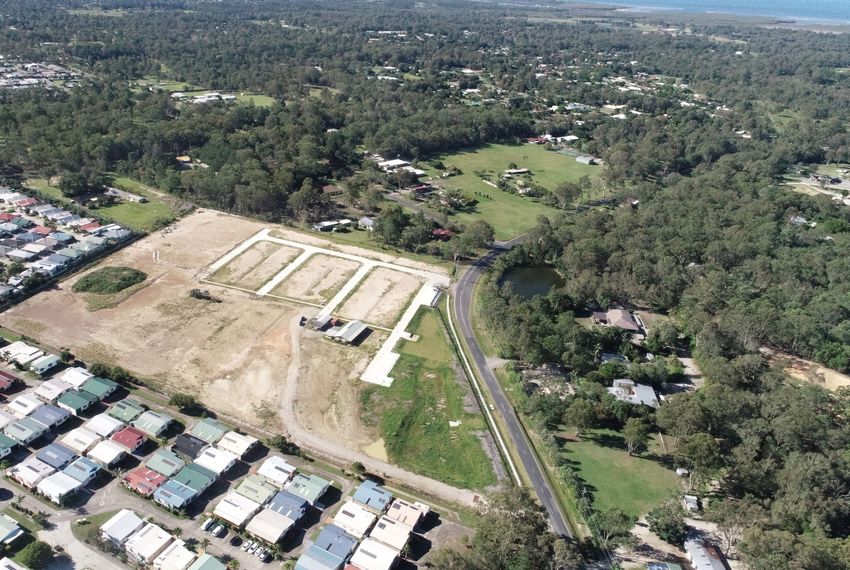
Building the rental base via acquisition
Expansion in key markets - $73 million in new acquisitions

 Ongoing focus on acquisitions growing rental base and expanding footprint
    •    Mixed-use park in Byron Bay, NSW with 269 sites acquired for $11.6 million
    •    Rivershore Holiday Resort with 95 sites acquired for $23.3 million
    •    Aspley Acres (now Brisbane North) acquired for $29.5 million – 350+ existing sites with development upside
    •    Adjacent land at Lara Lifestyle and Chambers Pines - potential to expand existing communities

 Key focus on acquiring existing communities – multiple opportunities under assessment

Ingenia Holidays Rivershore Resort, QLD                                                                               5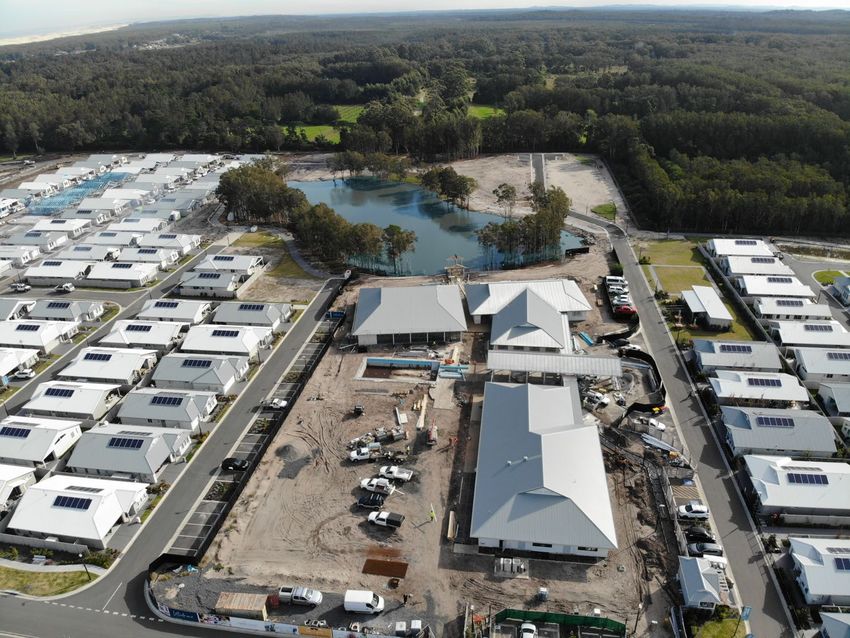
Building the rental base via co-investment
Generating new revenue streams and capital efficiency
Complementary Funds Management broadens footprint, revenue
streams and capital partnerships

•   Acquisition of established funds management business (Eighth Gate
    Capital) to complete August 2019 with opportunity to expand
    ›   Six funds with $140 million in assets under management
    ›   Leverages existing Ingenia management platform

•   Investment of $19.6 million to acquire business and interest in funds

•   Expect to generate >$2 million in fees revenue per annum                     Federation Village Werribee, Werribee, VIC

    ›   Fund and asset management fees
    ›   Project and development management fees plus sales commissions
        (with potential for performance fees)

•   Adds over 1,600 income producing sites (homes and holiday sites)
    to platform
    ›   Assets located in existing clusters in NSW and SE QLD and targeted
        Victorian market – branded Allswell Communities
    ›   Includes 160 home greenfield site in Ballarat, Victoria

•   Ingenia has the right to acquire assets if/when funds’ assets are realised      Tall Timbers, Shoalhaven Heads, NSW

                                                                                                                        6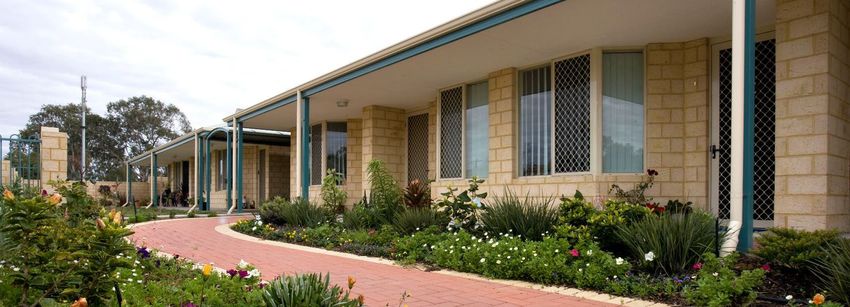
Business Overview
Rental base growing through acquisition and development

                                                     $

                                                                                                                                                                   $1B
                                            Stable rent base
                                            ~$2 million/pw

          Over 7,700
       Income producing                                                                                                                                           Property Portfolio
             sites
                                                                                   Creating Australia’s
                                                                                    Best Lifestyle and
                                                                                  Holiday Communities

        Over 3,700

                                                                                                                                                                   73
   Development sites on
  balance sheet or secured
      10 communities
     under development
                                                                                                                                                                Communities

                                                                                                                                                                                         35   Lifestyle and Holiday Communities
                                                                  Over 5,100 rental
                                 870,000                            and lifestyle                                                                                                        26   Ingenia Gardens Communities
                             ‘room nights’ p.a.                       residents
                              Cabins, caravan                                                                                                                                            10   Allswell Communities (funds)
                                and camping
                                                                                                                                                                                          2   Joint Venture (greenfield)

                 Note: Property portfolio includes balance sheet assets and communities owned by funds and the Group’s Joint Venture with Sun Communities. Excludes assets under option and held for sale.                   7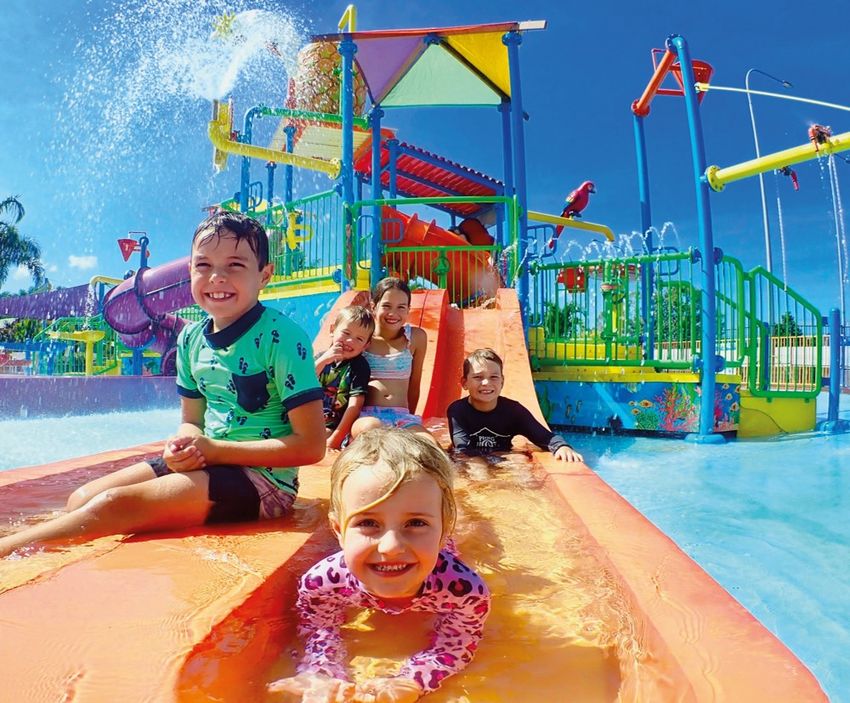
Performance
and
capital
management

      Ingenia Lifestyle Lake Conjola, NSW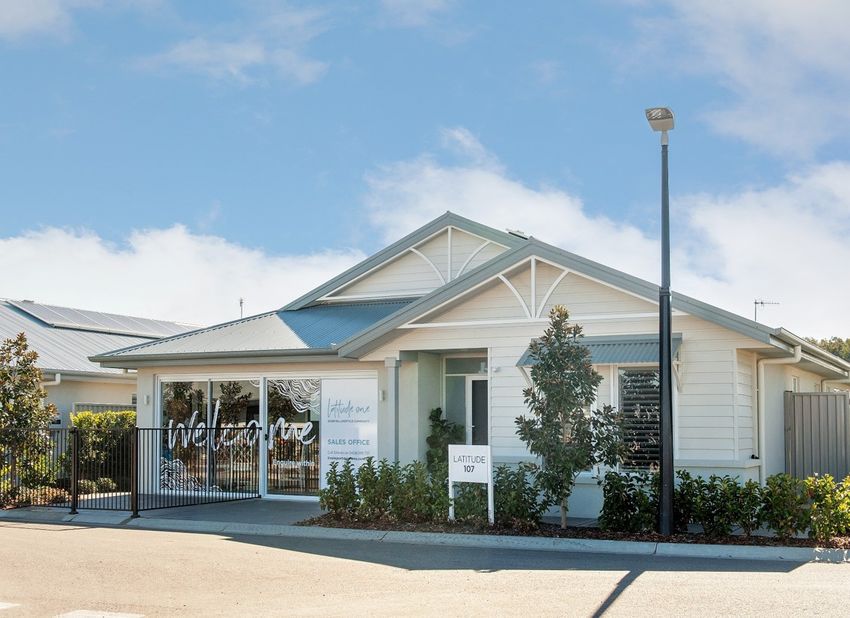
Key financials
Successful integration of new assets delivering increased earnings

KEY FINANCIAL METRICS                          FY19                 FY18
                                                                                                                     Revenue and EBIT growth driven by increasing rents, acquisitions and
Revenue                                      $228.7m              $189.5m                   21%                      accelerating development

EBIT1                                         $61.5m               $48.8m                   26%
                                                                                                                     Statutory profit and statutory EPS impacted by write down on non-core
                                                                                                                     assets, fair value loss on finance derivatives and liabilities, expensing of
Statutory profit                              $29.3m               $34.2m                   14%
                                                                                                                     acquisition costs, commencement of Joint Venture with Sun Communities
                                                                                                                     and realisation of development profits
Statutory EPS                                   13.0c               16.5c                   21%

Underlying profit1                            $47.2m               $36.8m                   28%                      Underlying EPS growth driven by strong asset performance and
                                                                                                                     increased settlements, partially offset by higher tax rate and additional
                                                                                                                     securities on issue
Underlying EPS1                                 21.0c               17.7c                   19%

Operating cash flow                           $59.3m               $47.2m                   26%                      Cash flow driven by increase in settlements and rental income, offset by
                                                                                                                     investment in display homes, new community launches and inventory
Distribution per security                      11.20c              10.75c                  4.2%

                                            30 JUN 19           30 JUN 18                                            Modest growth in distribution as funds reinvested into development
                                                                                                                     pipeline
Net Asset Value (NAV)
                                               $2.65                $2.57                    3%
per security

                   1.   EBIT, underlying profit and underlying EPS are non-IFRS measures which exclude non-operating items such as unrealised fair value gains/(losses) and gains/(losses) on asset sales.   9
Underlying earnings growing as business expands

EBIT                                                       FY19                 FY18                              Expanding rental base – driven by growth in rental rates, acquisitions,
                                                                                                                  additional rental cabins and new home settlements, offset by recent divestments
Lifestyle and Holidays Operations                        $27.4m                $25.3m                  8%

Lifestyle Development                                    $33.4m                $21.0m                 59%
                                                                                                                  Development earnings up substantially as new, large scale high margin
Ingenia Gardens                                          $10.0m                $11.4m                 12%         projects deliver increasing sales and above ground development margins
Fuel, Food & Beverage                                     $0.6m                 $0.4m                 50%
                                                                                                                  Rental growth and high occupancy offset by sale of five communities
Other1                                                    $0.2m               ($0.2m)                             in Tasmania
Portfolio EBIT                                           $71.6m                $57.9m                 24%
Corporate costs                                         ($10.1m)              ($9.1m)                 11%         Corporate costs increase driven by higher insurance premiums and business
                                                                                                                  development costs
EBIT                                                     $61.5m                $48.8m                 26%
1. Other includes remaining interest in Settlers assets and contribution from development Joint Venture.

                                                                                       Historic Performance – EBIT ($m)
 70.0
                                                                                                                                                                                61.5
 60.0
                                                                                                                                                       48.8
 50.0

 40.0
                                                                                                                              32.1
 30.0                                                                                                 24.2
                                                                18.1
 20.0                    12.1
 10.0

    -
                        FY 14                                  FY15                                  FY16                    FY17                      FY18                     FY19
                                                                                                             H1    H2
                                                                                                                                                                                              10
Capital management
Well positioned to fund growth
DEBT METRICS 30 JUN 19 30 JUN 18
Capital position enhanced - Joint Venture and funds
management extend capital partnerships
Loan to value ratio (covenant 2x)
• Limited capital outlay for co-investment in Eighth Gates funds
Net Asset Value per security $2.65 $2.57 management platform with potential to expand
Total debt facility ($m) 350.0 350.0
Drawn debt ($m) 241.0 229.0 Funding growth
Net debt ($m)2 220.8 214.6
1. Growing cash inflows – rent collection and home sales
2. Available unutilised debt within existing facilities
$97m 3.6% 3.3 YRS
3. Capital recycling - $32 million realised from non-core asset
sales - further non-core assets to be sold
DEBT
COST OF 29.8% WT AV DEBT 4. DRP in place
DRAWN LVR
CAPACITY DEBT3 MATURITY
5. Joint Venture with Sun Communities - reduced development
funding requirement whilst preserving option to acquire
1. Gearing ratio calculated as net debt (borrowings less cash) over total tangible assets (total assets less cash and intangible assets).
completed community
2. Excludes finance leases.
3.
4.
All in cost of debt 3.9%, including cost of undrawn available facilities as at 30 June 2019.
Debt capacity reduced for bank guarantees ($12 million).
6. Eighth Gate funds management platform - ability to grow
asset base and revenue streams with minimal capital outlay
11Strategy
Construction of new community clubhouse at
Ingenia Lifestyle Latitude One, Anna Bay, NSWUnderlying demand drivers remain strong
Many seniors will struggle to fund a comfortable retirement
Percentage of total population by age cohort
• There are 7 million people aged 55 or over in Australia 2050
today, representing 27% of the population 2030
75+
2010
65-74
• This will increase to 32% of the population by 2050, 1990
55-64
representing 11 million persons 1970
0% 2% 4% 6% 8% 10% 12% 14%
Superannuation account balances by age
• Many seniors are reliant on the pension and have limited
superannuation or savings 75+
>$100k
65-74 $40k-$100k
• According to ASFA a couple requires $61,522 a year $0-$40k
to fund a comfortable retirement. The age pension is 55-64
only $33,0671
0% 10% 20% 30% 40% 50% 60% 70% 80% 90%
Home Ownership (Age)
• 82% of seniors own their home outright with no mortgage 75 and over
65 to 74
• Downsizing to a land lease community provides a way to 55 to 64
fund a comfortable retirement
0% 20% 40% 60% 80% 100%
• Over 580,000 lower income households aged 55+ are Australian Retirement Funding
Receive
renting pension
64% Government Pension/Allowance ($2.5m) 36% Self Funded ($1.4m)
• Affordable, secure, rental communities are an attractive Don’t receive
pension
option 0% 20% 40% 60% 80% 100%
1. Pension represents base rate and excludes supplements. Data sourced from Australian Superannuation Funds Association (ASFA), Department of Social Services, ABS; INA analysis. 13Strategy focussed on growing rental returns
A large portfolio of rental communities with significant organic, development and acquisition growth optionality
ENHANCING CREATING PARTNERING
Contractual Rent Growth Occupancy Growth Development Development JV (Sun)
• Contracted annual rent increase
across growing resident base • Efficient funding of greenfield
• Creation of new, quality
• Addition of new rental homes at development with option to
• Lifestyle rental contracts masterplanned communities
existing communities acquire communities on
typically CPI +2% pa leveraging inhouse expertise
• Upgrading accommodation in completion
• Rent uplift delivered through • Four greenfield communities
Brisbane based rental assets • Growth in fees as projects
› Re-leasing as residents under development
• Ingenia Care extending average commence
depart • Sector leading pipeline – 3,713
stay • Two projects in place; four under
› Active buy back and potential home sites secured
review
refurbishment program
Expansions Rate Growth Acquisitions Funds Management
• Conversion of lower yielding • Co-investment providing property
sites and vacant land to • Additional and upgraded return (8-12% yield)
generate revenue • Acquired three new
tourism cabins and facilities communities and two land • Ability to grow AUM from base
• Development of new homes parcels in FY19 ($73 million)
across existing communities to • Target rate growth of 2-3% pa of $140m
improve operating margin • Active management to optimise • Multiple opportunities under • Monetises existing platform
rates in peak periods assessment through management fee
› Further 1,998 expansion
sites available generation
14Operations
Ingenia Holidays Rivershore, QLDIngenia Lifestyle and Holidays
Over 95% weighting to capital city and coastal markets
KEY DATA 30 JUN 19 30 JUN 18 • Portfolio enhanced as new communities acquired, non core assets
sold and development continues to accelerate
Total properties 35 35
• Strong growth in rental base in FY19
Permanent sites 3,252 2,702
› Acquisition of 700+ income generating sites
Annual sites 764 908
› 336 new home settlements
Holiday sites 2,383 2,186
› Rollout of 42 new rental and tourism cabins
Development sites1 3,713 3,244
1. Includes all potential development sites (on balance sheet, through JV and funds - under option or secured).
Growth in Rental Sites Portfolio Value (by State)1
8,000
Acquired
7,000 35th community
6,000 39%
5,000
4,000 57%
3,000
Queensland
2,000 Acquired 4%
1st Victoria
1,000 community
New South Wales
-
Jun-13 Jun-14 Jun-15 Jun-16 Jun-17 Jun-18 Jun-19 1. Excludes assets held for sale.
16Ingenia Lifestyle and Holidays
Rental income growing
KEY DATA FY19 FY18 EBIT margin stable
Permanent rental income $25.0m $21.7m • Margin positively impacted by growing rents, offset by greenfield assets
not yet stabilised (Latitude One, Plantations) and decanting at Rouse Hill
Annuals rental income $4.7m $4.8m and Blueys Beach
Tourism rental income $38.0m $34.9m
Permanent rental revenue up 15%
Other rental income $0.4m $0.4m
• New homes – 336 settled and occupied ($2.7 million rent
Total rental income $68.1m $61.8m
per annum)
Other income1 $3.6m $3.3m • New rental homes installed – 42 complete (~$0.6 million rent per annum)
Total income $71.7m $65.1m • Average weekly rent $168 per week (same store growth 3%)
• Average rent increase of 2.9% on review across all land lease
EBIT $27.4m $25.3m communities (more than 2,500 residents)
EBIT margin2 39.3% 39.0%
30 JUN 19 30 JUN 18 Future growth
Book value3 $565.3m $449.9m • Addition of over 1,100 income producing sites FY19
• Rollout of new rental homes across existing communities, providing
immediate yield on investment (70+ planned FY20)
1. Other income represents utility recoveries and non rental services.
2.
3.
Represents margin for stable assets only (excludes greenfield assets, Rouse Hill and Blueys Beach).
Excludes value attributed to development (30 Jun 19: $149.4m; 30 Jun 18: $142.9m) and assets held
• Growth in occupancy and rate across existing communities
for sale at 30 June 2019.
17Ingenia Holidays
Stable returns and growing footprint
Revenue up 9%, driven by acquisitions and investment
• Acquisition of Rivershore Resort and Byron Bay Holiday Park
(370 additional income producing sites)
• Addition of 17 cabins across key tourism assets
(~$900,000 revenue per annum)
Existing assets resilient in softening market
• Room nights sold up 2% (like for like)
• Like for like revenue up 3% and RevPAR increased by 3% -
impacted by competitor discounting
• Online presence continuing to expand, broadening market reach
› Online bookings now over 51% of all cabin bookings
› TripAdvisor rankings promoting asset quality and guest
experience (15 parks achieving Certificate of Excellence)
Continuing to seek growth
• Rollout of additional 15 cabins at key assets to meet demand
(targeting more than 20% yield)
• Capitalising on cross selling opportunities
› Growth in resident Gold Card use and Ingenia resident tours
› Marketing across resident and tourism databases Ingenia Holidays Cairns Coconut, QLD
18Ingenia Gardens (seniors rental)
Strong, stable, government supported rent
KEY DATA FY19 FY18 Continuing to deliver stable returns
Total revenue $24.6m $28.0m • Occupancy maintained at over 90%
EBIT $10.0m $11.4m • Average rent now $342 per week
EBIT margin 40.7% 40.8% › Growth impacted by low pension growth and
weak WA market
30 JUN 19 30 JUN 18
• Average resident tenure 3.1 years
Total properties 26 26
Total units 1,376 1,374
Ingenia Care – a key service and market differentiator
Av. weekly rent1 $342 $338
• Over 650 current residents accessing the service
Occupancy1 90.8% 92.4%
• Average resident tenure for care clients above portfolio average
Book value $132.1m $127.3m (at 3.4 years)
1. Weighted average weekly rent on a Like for Like basis.
Attractive model, with strong demand
• Affordable option for growing seniors population reliant on rental market
• Over 580,000 households aged 55+ rent in the private or public market -
limited new supply as government reduces provision of housing
• Majority of residents supported by government pension and rent assistance
providing stable, low risk revenue
• Exploring options for expansion, including new seniors rental community
Ingenia Gardens Swan View, WA
in Brisbane
19Development First Joint Venture project – greenfield site at Burpengary, QLD
Development
Accelerated growth in challenging market

 KEY DATA                                             FY19                 FY18                                 New home settlements up 17% on prior year
 New home settlements                                   336                  287                       17%      •   Average above ground margin per home over 40%
 Av. new home sales price1                                                                                      •   Higher sales prices, above ground margins and home rents for new
                                                        384                  324                       19%          settlements as first greenfield communities contribute
 ($’000)
 Deposited/Contracted
                                                        223                  166                       34%      EBIT margin up 370 basis points
 (at 30 Jun)
 Gross above ground new
                                                       51.4                 34.8                       48%      Greenfield strategy delivering strong sales
 home development profit ($m)

 Development EBIT ($m)                                 33.4                 21.0                       59%      •   Latitude One and Plantations – 114 settlements with high levels of
                                                                                                                    interest for future stages
 EBIT margin (%)                                      28.1%                24.4%                         4%
                                                                                                                •   New projects to contribute sales in FY20 – Hervey Bay (Ingenia) and
                                                   30 JUN 19            30 JUN 18                                   Burpengary (Joint Venture)

 Book value2                                        $149.4m              $142.9m
                                                                                                                Continuing to secure opportunities
1.   Inclusive of GST.
2.   Book value for development property is based on DCF methodology and will fluctuate through the life of a
     project.                                                                                                   •   Scalable platform with inhouse expertise
                                                                                                                •   Joint Venture with Sun Communities to accelerate development –
                                                                                                                    first projects in place, further four sites being assessed
                                                                                                                •   Expansion land at Lara acquired, potential for 196 homes
                                                                                                                •   Approvals for 184 sites received across Chambers Pines and
                                                                                                                    Hervey Bay

                                                                                                                                                                                         21
Record sales achieved despite market conditions
New record for home sales
(336 new home settlements) delivered FY19
• Record sales, homes prices and margins achieved despite
challenging residential market
• Growing average home sale price driven by new greenfield
projects where ‘pre-release demand’ has been strong
› Key impact of slowing market conditions over FY19
remains extension of days on market and time to settle
on home sales
Ingenia Lifestyle Plantations, NSW
› Expect market conditions and low interest rate
environment to continue to impact sales
Cumulative new home settlements
• Growing market awareness of model (and Ingenia) supporting 1,000 917
Cumulative settlements of new homes
ongoing demand 900
800
• In addition to development profits, the development business 700
has accumulated new rental contracts which currently deliver 600
500
over $7 million in rental revenue per annum
400
300
200
100
0
1H14 2H14 1H15 2H15 1H16 2H16 1H17 2H17 1H18 2H18 1H19 2H19
Note: Excludes settlements from assets which have been divested.
22Continuing to secure future opportunities
Pipeline supporting ongoing development returns
Approved Not Approved Development Size
>200 sites
Far North Coast NSW (JV)
(new, optioned)
$550 Eighth Gate
Forecast Home Sales Price ($'000s)
Hunter/Newcastle (JV)
(new, secured)
Blueys Beach
(expansion)
Fullerton (JV)
(new)
Burpengary (JV)
> $375 (new) Upper Coomera
(new)
Burpengary (JV)
(expansion) Geelong VIC (JV)
(new, optioned) Hervey Bay
(expansion)
> $250
Lara Chambers Pines
Hervey Bay (expansion) Greater Melb (JV) (expansion)
(new) Eighth Gate, VIC (new, optioned)
(new, secured)
Apr-18 Aug-19 Jan-21 May-22 Oct-23 Feb-25 Jun-26
Target first settlement date
Note: Timing and prices are indicative and subject to change. Includes secured and optioned assets. Excludes land at Avina. 23Joint Venture making rapid progress
First settlements anticipated FY20
50:50 Joint Venture with Sun Communities for greenfield
development established November 2018
• Fees include origination, development and asset management fees (with
potential for performance fees)
› $0.8m in origination and management fees received FY19
• First two projects secured and $12.8m capital invested
Optioned land › $1.2m loss at 30 June 19 reflects write off of costs associated with
acquisition costs for the first two projects
First projects secured; future projects under review
• First project at Burpengary, QLD underway
› Purchase of 9.5 ha site with initial infrastructure in place complete May
2019
› Approval for 131 homes (DA lodged for additional 102 homes on adjacent
optioned land)
› First settlements anticipated end FY20
• Fullerton Cove on NSW North Coast acquired for $5.5 million in June 2019
with DA in place (new 119 home community)
Undertaking due diligence on multiple additional greenfield sites
with four under option or conditional contract
24Ingenia in the community
Driving resident and team engagement
Partnership with Ronald McDonald House Charities ©
Australia
• First ever National Family Room Partner, providing support
across all 18 locations
• Cash ($100,000 gifted) and in kind support
Strong sense of engagement from Ingenia team
• “Meals from the Heart” program in NSW, Queensland, Victoria
and Western Australia (seven houses) – now in second year
• Gifted VIP holiday experiences hosted by Ingenia’s holiday parks
allowing site teams to participate
• Community based fundraising activities
Extends resident engagement
• Knitting program across Ingenia Lifestyle and Gardens incorporated
into existing resident engagement programs
• Fund raising and donations of needed supplies providing additional
avenues to contribute
• Opportunity has been embraced by residents
25FY20 focus
Improve performance of existing assets to drive growth in rental
revenue
Execute Joint Venture business plan, delivering opportunities for
capital light growth and additional revenue streams
Continue asset recycling to fund growth
Continue focus on sales and marketing to successfully launch new
projects and deliver new rental contracts
Capitalise on opportunities to expand development pipeline to deliver
new rental contracts and support development Joint Venture growth
Integrate funds management business and deliver performance for
fund investors
Grow investor returns through delivery of FY20
guidance - growth in EBIT of 10% - 15% and underlying
EPS growth of 5% - 10%
1. EBIT and underlying EPS are non-IFRS measures which exclude non operating items such as unrealised fair value First and One Hundredth resident at Ingenia Lifestyle Latitude One
gains/(losses) and gains/(losses) on asset sales.
2. Guidance is subject to no material adverse change in market conditions and timing of key development projects.
26Appendices
Ingenia Holidays White Albatross, NSWAppendix 1
Underlying profit
FY19 FY18
($m) ($m)
Lifestyle and Holidays – Operations 27.4 25.3
Lifestyle Development 33.4 21.0
Ingenia Gardens 10.0 11.4
Fuel, food & beverage 0.6 0.4
Other 0.2 (0.2)
Portfolio EBIT 71.6 57.9
Corporate costs (10.1) (9.1)
EBIT 61.5 48.8
Share of Associate losses (1.2) -
Net finance costs (7.6) (6.1)
Income tax expense (5.5) (5.9)
Underlying profit – Total 47.2 36.8
Statutory adjustments (net of tax) (17.9) (2.6)
Statutory Profit 29.3 34.2
28Appendix 2
EBIT and underlying profit by segment
LIFESTYLE LIFESTYLE INGENIA FUEL, FOOD CORPORATE
($M) TOTAL
OPERATIONS DEVELOPMENT GARDENS AND BEVERAGE AND OTHER
Rental income 68.1 - 21.7 - - 89.8
Manufactured home sales - 119.1 - - - 119.1
Catering income - - 2.6 - - 2.6
Fuel, food and beverage income - - - 12.0 - 12.0
Other income 3.6 - 0.3 - 1.3 5.2
Total segment revenue 71.7 119.1 24.6 12.0 1.3 228.7
Property expenses (17.8) (1.0) (6.8) (0.7) (0.6) (26.9)
Manufactured home cost of sales - (67.1) - - - (67.1)
Employee expenses (20.8) (12.0) (6.5) (2.6) (6.1) (48.0)
Service station expenses - - - (6.2) - (6.2)
All other expenses (5.7) (5.6) (1.3) (1.9) (4.5) (19.0)
Earnings Before Interest and Tax (EBIT) 27.4 33.4 10.0 0.6 (9.9) 61.5
Segment margin (%) 39.3* 28.1 40.7 5.2 NM 26.9
Share of loss of Joint Venture - - - - (1.2) (1.2)
Net finance expense - - - - (7.6) (7.6)
Income tax expense - - - - (5.5) (5.5)
Underlying profit 27.4 33.4 10.0 0.6 (24.2) 47.2
* Stabilised margin excludes assets impacted by development.
29Appendix 3
Reconciliation: underlying profit to statutory profit
Statutory profit decline largely driven by transaction costs and increased sales at high margin developments
• Write-off of stamp duty and transaction costs of $5.4 million
• Fair value adjustment of $7.7 million on investment property value, including write-down of Avina and non-core assets and realisation of
development profits (largely at Latitude One)
• Increase in ‘grossed up’ liability of $3.8 million owed to Latitude One vendor (owns 40% of future rent roll)
• Mark-to-market loss of $2.3 million on interest rate derivatives
• Other of $1.8 million includes loss on divestment/impairment of non-core assets
Underlying NPAT to Statutory NPAT
50 47.2 5.4
45
7.7
40
35 3.8
2.3 29.3
30 3.1
1.8
$m
25
20
15
10
5
0
Underlying NPAT Transaction costs / Valuation of Valuation of Vendor MTM of Derivatives Other Other Tax Benefit Statutory NPAT
Stamp Duty Investment Properties Profit Share
Note: Above figures are on a tax effective basis. 30Appendix 4
Fair value adjustment on high value greenfield projects
Latitude One is generating strong margins and
growing home sale prices
• Latitude One remains on track to deliver pre tax
unlevered project IRR >25%
• Ingenia enjoys risks and rewards of development
stage at Latitude One plus 60% of long-term rent roll
(also collects 7.5% management fee)
• Majority of impairment expected to be recovered over
time
› High quality and margin project currently valued at
a cap rate of 6.30% which should tighten as
project approaches completion in FY20
› Rent is set at $190 per week with annual growth of
CPI plus 2% with no re-letting risk or lease
incentives
› Ingenia owns outright 18 hectares of adjoining
land with development potential for 161 new
homes (subject to Council approval) - current book
value of this land is $1.25 million ($7.8k per site)
which should provide for attractive rental and
development returns
31Appendix 5
Cash flow
FY19 FY18
($M) ($M)
Opening cash at 1 July 14.5 9.6
Rental and other property income 107.4 102.1
Property and other expenses (93.3) (81.4)
Net cash flow associated with lifestyle home development 55.7 34.6
Net borrowing costs paid (8.9) (8.9)
All other operating cash flows (1.6) 0.8
Net cash flows from operating activities 59.3 47.2
Acquisitions of investment properties (78.8) (51.2)
Net proceeds from sale of investments properties 32.2 32.7
Investment in Joint Venture (12.8) -
Capital expenditure and development costs (66.0) (66.1)
Purchase of plant, equipment and intangibles (1.0) (2.8)
Net cash flows from investing activities (126.4) (87.4)
Net proceeds from/(repayment of) borrowings 11.6 62.3
Net proceeds from equity placement 86.2 4.4
Distributions to security holders (24.3) (21.1)
All other financing cash flows (0.7) (0.6)
Net cash flows from financing activities 72.8 45.0
Total cash flows 5.7 4.8
Closing cash at 30 June 20.2 14.5
32Appendix 6
Consolidated balance sheet
30 JUN 19 30 JUN 18
($M) ($M)
Cash 20.2 14.5
Inventories 36.0 30.2
Investment properties 846.8 730.4
Investment in Joint Venture 11.6 -
Assets held for sale 12.8 28.7
Other assets 25.5 22.0
Total assets 952.9 825.8
Borrowings (excluding finance leases) 241.0 229.0
Derivatives 2.5 0.1
Retirement village resident loans 0.3 8.2
Liabilities held for sale 5.7 3.9
Other liabilities 77.7 50.7
Total liabilities 327.2 291.9
Net assets 625.7 533.9
Net asset value per security ($) 2.65 2.57
33Appendix 7
Drivers of change in EBIT
Drivers of change in EBIT FY18 to FY19
70.0
2.0 0.6 2.6
1.4 1.0
6.5 61.5
60.0
5.9
50.0 48.8
$m
40.0
30.0
20.0
10.0
0.0
EBIT June 18 Development sales Development Acquisitions Same store NOI Other Impact of Corporate & BD EBIT June 19
volume margin growth divestments Costs
34Appendix 8
Capitalisation rates have progressively tightened
Lifestyle and Mixed-use Communities
11.50%
10.50%
Crystal Cascades,QLD
Hervey Bay,QLD
Implied cap rate %
9.50%
Highway 1,SA
Grange, Jun16 Capricorn Palms,QLD
8.50%
Green Wattle,QLD Aspley,QLD
7.50% Rivershore,QLD
Grange, Jun19
6.50% Newport,NSW
Gateway Portfolio Bid Sanctuary,NSW Orianna,QLD
Greenpoint,NSW
(Implied cap rate)
5.50%
Jan-16 Aug-16 Mar-17 Sep-17 Apr-18 Oct-18 May-19
Trend Line Trend Line Trend Line
Mixed-use Lifestyle The Grange Poly. (Mixed-use)
(Mixed-use) Poly. (Lifestyle)
(Lifestyle) Linear
(The (The Grange)
Grange)
Ingenia Lifestyle The Grange was acquired in March 2013 (10% cap rate) - trend line shows change in cap rate – both
externally valued and internally assessed over the past six years
35Appendix 9
High quality greenfield projects building momentum
Latitude One, Anna Bay, NSW
• Premium community with extensive facilities and infrastructure
supporting 270 new homes
• Settled 84 homes FY19, average home sale price now $515,000
› Strong demand for future stages
› 59 deposits and contracts in place
• First community facilities to open from August 2019
• Current rent $190 per week – rent growing at CPI plus 2% pa
Ingenia Lifestyle Latitude One, July 2019
Plantations, Coffs Harbour, NSW
• Premium community, with quality facilities and 196
new homes
• First stage of 52 homes now complete - 30 homes settled at an
average home sale price >$445,000
› Strong demand for future stages
› 40 deposits and contracts in place
• Current rent $177 per week – rent growing at CPI plus 2% pa
Ingenia Lifestyle Plantations, July 2019
36Appendix 10
Credit rating of lifestyle communities
Premium Grade office 1 Farrer Place, Sydney
Current independent cap rate 4.63%
Minter Ellison, Grant Samuel, Goldman Sachs,
Tenants (include)
Walker Corporation
Constant, often involving rental voids and leasing
Re-leasing risk
incentives
Rent growth Market driven
Rent paid Typically monthly in advance
Ingenia Lifestyle, The Grange, Morriset NSW
Current independent cap rate 6.3%
Residents 196 home owners – rent land
Nil – existing residents continue to pay land rent
Re-leasing risk
until sell home or remove from site
Rent growth Typically CPI+$2 (per annum)
Fortnightly and underpinned by Government
Rent paid pension and rent assistance. Residents own home
outright with no mortgage
37Contact
Information
Scott Noble Donna Byrne
Chief Financial Officer General Manager Investor Relations
Tel: +61 2 8263 0538 Tel: +61 2 8263 0507
snoble@ingeniacommunities.com.au dbyrne@ingeniacommunities.com.au
Ingenia Communities Group
Level 9, 115 Pitt Street
Sydney NSW 2000
www.ingeniacommunities.com.auDisclaimer
This presentation was prepared by Ingenia Communities Holdings Limited (ACN 154 444 925) The forward looking statements included in this presentation involve subjective judgment and
and Ingenia Communities RE Limited (ACN 154 464 990) as responsible entity for Ingenia analysis and are subject to significant uncertainties, risks and contingencies, many of which are
Communities Fund (ARSN 107 459 576) and Ingenia Communities Management Trust (ARSN outside the control of, and are unknown to, the Group. In particular, they speak only as of the
122 928 410) (together Ingenia Communities Group, INA or the Group). Information contained date of these materials, they assume the success of the Group’s business strategies, and they
in this presentation is current as at 20 August 2019 unless otherwise stated. are subject to significant regulatory, business, competitive and economic uncertainties and
risks. Actual future events may vary materially from forward looking statements and the
This presentation is provided for information purposes only and has been prepared without
assumptions on which those statements are based. Given these uncertainties, readers are
taking account of any particular reader’s financial situation, objectives or needs. Nothing
cautioned not to place undue reliance on such forward looking statements.
contained in this presentation constitutes investment, legal, tax or other advice. Accordingly,
readers should, before acting on any information in this presentation, consider its The Group, or persons associated with it, may have an interest in the securities mentioned in
appropriateness, having regard to their objectives, financial situation and needs, and seek the this presentation, and may earn fees as a result of transactions described in this presentation or
assistance of their financial or other licensed professional adviser before making any transactions in securities in INA.
investment decision. This presentation does not constitute an offer, invitation, solicitation or
This document is not an offer to sell or a solicitation of an offer to subscribe or purchase or a
recommendation with respect to the subscription for, purchase or sale of any security, nor does
recommendation of any securities, including in the United States or any other jurisdiction in
it form the basis of any contract or commitment.
which such an offer would be illegal.
Except as required by law, no representation or warranty, express or implied, is made as to the
fairness, accuracy or completeness of the information, opinions and conclusions, or as to the
reasonableness of any assumption, contained in this presentation. By reading this presentation
and to the extent permitted by law, the reader releases each entity in the Group and its
affiliates, and any of their respective directors, officers, employees, representatives or advisers
from any liability (including, without limitation, in respect of direct, indirect or consequential loss
or damage or loss or damage arising by negligence) arising in relation to any reader relying on
anything contained in or omitted from this presentation.
39You can also read