Canadian supply chain logistics
vulnerability

June 2021
Kevin Jiang
Colin Scarffe
←
→
Page content transcription
If your browser does not render page correctly, please read the page content below
Canadian supply chain logistics vulnerability June 2021 Kevin Jiang Colin Scarffe
Summary Industries in Canada are dependent on road and water transportation. Road transportation is heavily used in all types of industries, but especially in auto manufacturing, both on the import and export side. Reliance on water transportation is widespread for sourcing imports with nearly every industry importing over one-fifth of its imports with this method, but the extent of using water for exports is more limited to certain industries. Air transportation is used intensively for transporting high-value goods such as diamonds, while rail and other transportation modes are not extensively used for most industries. Although Canada has hundreds of border crossings, the vast majority of trade passes through only a small proportion of those crossings. Road crossings are the most vulnerable for most industries (i.e. they use few road ports). However, if road crossing is excluded from the analysis, industries are found to be far less vulnerable to ports (i.e. they used a broader range of ports). Industries with high logistics vulnerability also tend to be concentrated on one trade partner. For example, the auto-sector is very dependent on the United States and also dependent on the Ambassador bridge. The coal industry is dependent on China and the port of Vancouver. 2
Introduction
 The 2020 global pandemic prompted policy makers and businesses around the world to rethink many
aspects of global value chains (GVCs). One aspect is how vulnerable are GVCs to disruptions in foreign
production and demand. The COVID-19 pandemic exemplified how economies could shut down in an instant
causing international disruptions. For example, Canadian imports of bicycles from China decreased nearly 50%
in the first quarter of 2020 as China was forced to put strict stringency measures on its populace to try and slow
the spread of COVID-19. Similarly, the stringency conditions imposed on many economies caused many
downstream demand shocks and was part of the reason why oil prices briefly became negative in April 2020.

 One reason for the existence of GVCs is that it allows firms to source materials at the lowest cost and
sell to the customers beyond their domestic market, thus capturing the advantages of scale economies regardless
of the size of their local market. (Chatterjee & Tsai, 2002) To bring costs down even further, firms are relying less
on inventories—which are costly to hold—and more on purchases directly from production, or so called just-in-
time supplies. (Suranga et al., 2015) (Suraj et al., 2016) A well-known Canadian example is the auto-
manufacturing industry. The sector sources parts from over 700 suppliers to produce more than 2 million vehicles
annually. (Industry Canada, 2019) The industry takes advantage of being able to sell globally to produce as many
vehicles as it does, relies on suppliers to provide the parts that it needs at a competitive price, and are themselves
the suppliers of many just-in-time parts to auto-manufacturers around the world.

 However, being part of a GVC and having just-in-time supplies only works if firms can depend on the
logistics of transportation and ports that make this possible. To phrase another way, without dependable logistics,
Canadian firms and the GVCs of which they are apart would have to hold more inventories which increases costs
and makes Canadian firms less competitive internationally. The changes in competitiveness due to logistics
matter; the World Bank estimates that an improvement in infrastructure from the median country to the country
at the 25th percentile is the equivalent to reducing the distance between two countries by 2,358 km by sea, and
increases trade volumes by 68 percent. (Limao and Venables, 2001) This paper will build on the research from
Boileau & Sydor (2021) by evaluating which Canadian industries are most vulnerable to a shock in the mode of
transportation and/or a disruption at the port of clearance. The first half of this paper will focus on industry reliance
on different modes of transportation. The second half will then add the port dimension and focus on the
intersection of port of entry/exit and the mode of transportation.

 In this study only merchandise trade will be considered. This is partly due to data constraints, and partly
because most services, especially those that can be delivered digitally, are assumed to be minimally affected by
transportation disruptions.1 For both imports (upstream supply) and exports (downstream demand), this paper
uses a customs-basis Canadian merchandise trade dataset from Statistics Canada for 2019 at the most detailed
level of Harmonized System (HS) available, i.e. 10-digit codes for imports and 8-digit codes for exports. This
dataset contains five dimensions that are useful for the study of GVCs: country of origin/destination, province of
origin/destination, product, mode of transportation, and port of entry/exit; although, for our purposes we drop the
country and province dimension.

Mode of transportation

Overview
 We begin by investigating the degree to which Canadian industries rely on different modes of
transportation in their respective GVCs. This includes both the shipment of inputs imported for Canadian

1 In general, mode 1 services—those supplied across borders—and mode 3 services—commercial presence—should
not be affected by transportation or border crossings. Mode 2—consumption abroad—could be affected, and mode 4—
presence of a natural persons—would certainly be affected. However, the data does not exist (as far as we know) to
take these services into account.

 3
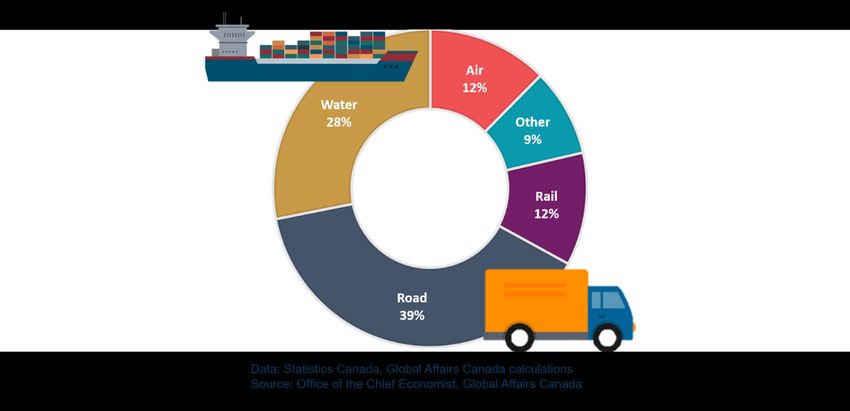
industries to produce their products (upstream supply), as well as the shipment of each industry’s final products
for export outside of Canada (downstream demand). To explore this, we disaggregated merchandise imports
and exports by industry into 5 different modes of transportation: road, water, air, rail, and other. Identifying the
share of Canadian trade of each mode enables us to determine which disruption would have the largest impact
on each Canadian industry. We postulate that although industry supply and usage could have differences across
countries, the type of product transported under each form of transportation usually shares similarities around
the world. Thus, findings in this section could prove useful in informing global trade policy decisions.

 Canadian industries rely heavily on road transportation for both imports and exports, totalling nearly 40%
of transportation for overall Canadian merchandise trade. 2 This is largely due to the significant share of trade the
U.S. represents for Canada, as well as the deeply integrated GVCs between the two countries. Water
transportation trails in second place at 28%, as it is generally the preferred mode of transportation for trade with
countries outside of North America due to its relatively low cost and capacity for transporting bulky goods
compared to the other modes of transportation. Air and rail offer certain advantages over other transportation
modes under specific scenarios and each accounted for roughly 12% of total Canadian merchandise trade.
Lastly, transportation for the remaining 9% of merchandise trade is classified under “other”, which mainly consists
of pipelines and power lines for shipping energy products such as crude oil, natural gas, and electricity.

Figure 1. Canadian merchandise trade by mode of transportation, 2019

Upstream supply

 On the supply side, we focus on the degree to which Canadian industries import goods by different
modes of transportation, including how industries source intermediate inputs.3 For example, although Canada
mainly exports crude oil through pipelines, its supply of goods for production requires companies to utilize many
forms of transportation such as water and road for machinery, equipment, and other intermediate inputs used in
oil production. Any form of transportation disruption may lead to companies adjusting their operations, potentially

2 A manual manipulation was done for non-U.S. and non-Mexico countries that use road and rail to change the mode
to water. Products transported to and from countries outside of North America commonly arrive in the U.S. first by water
and are then transported across the Canada-U.S. border by road or rail.

3 Due to data constraints, this paper only considers direct imports and exports.

 4
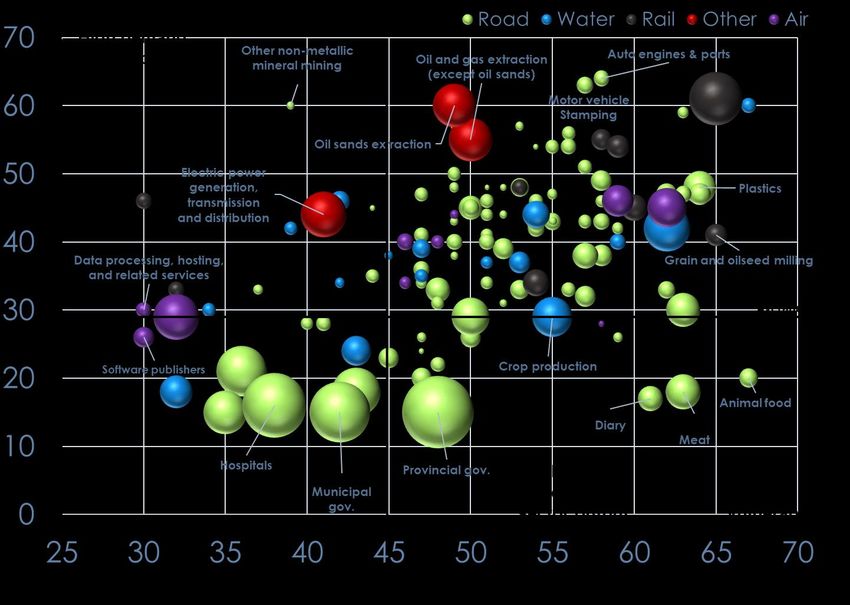
resulting in not only disrupting the oil industry supply chain but also putting additional pressure on GVCs of other
industries.

 In Boileau & Sydor (2021), the authors created upstream supply and downstream demand vulnerability
indices by mapping detailed trade data to the supply and use industries.4 Using a similar approach, we added a
third dimension that shows the primary transportation method for Canadian industries in their imports of goods
(figure 2). In 2019, Canada imported nearly 10,000 unique products at the HS-10 level. These products were
used as inputs into 216 industries,5 with road being the primary form of transportation for 147 industries, followed
by water (60) and air (7). Rail and other were each the main form of transportation for 1 industry.

Figure 2. Upstream and downstream vulnerability by import transportation method

 Previous research found that vulnerability to foreign demand and supply disruptions varies depending
on the type of industry—manufacturing industries are generally more susceptible (upper right corner of figure 2)
and services industries are less vulnerable (closer to the origin). To get a better idea of each industry’s reliance
on different transportation modes, we first categorized Canadian industries into 6 types based on North American
Industry Classification System (NAICS). We then calculated each industry type’s import concentration by method

4
 Supply and use industries refer to the industries found in Statistics Canada’s supply and use tables. See Boileau &
Sydor for more details on the supply and use tables.
5
 The Canadian supply and use tables break down the economy into 233 industries. However, due to lack of data in
some of the accompanying data sets (the input output multipliers, and value-added tables) Boileau & Sydor drop 17
industries, leaving 216 industries in their analysis. We use the same 216 industries for ease of comparison.

 5
of transportation using the Herfindahl–Hirschman Index (HHI).6 Manufacturing industries showed on average the
highest import concentrated due to their high reliance on road transport; followed by agriculture; forestry, fishing
and hunting; and services industries. However, table 1 shows that almost all industries in Canada relied heavily
on road as well as water transportation for sourcing their inputs, resulting in their final import mode concentration
being merely a few percentage points apart. This potentially suggests a similar level of overall vulnerability to
unimodal transportation disruption. We will discuss industry vulnerability in more detail in the second section of
this paper.

Table 1. Industry average import concentration by mode of transportation
 Type of industry HHI Road Water Air Rail Other
 Manufacturing 0.36 46.9% 35.7% 9.4% 6.1% 2.0%
 Agriculture, forestry, fishing and hunting 0.35 43.2% 38.6% 7.8% 7.9% 2.5%
 Services7 0.34 42.4% 37.8% 12.1% 2.7% 5.0%
 Construction 0.34 41.4% 38.6% 8.4% 3.3% 8.3%
 Mining, quarrying, and oil and gas extraction 0.33 39.8% 40.1% 7.6% 5.6% 6.9%
 Utilities 0.30 30.2% 42.4% 7.4% 4.3% 15.7%
 All industries 0.35 43.8% 37.2% 10.5% 4.4% 4.0%

 On top of road being the main form of transportation for the greatest number of industries, industries that
primarily used this mode also had some of the highest import mode concentrations. In other words, those
industries that had road as the main form of transporting imports were also mainly concentrated in just using one
mode of transportation, which could make them especially vulnerable to land crossing closures. This was
especially true in manufacturing as 58 out of 82 manufacturing industries mainly used road for sourcing inputs.
Moreover, the extent of using road for transporting imports reached over 70% for several auto manufacturing
industries. Table 2 below lists the top 10 industries that have the highest import concentration by mode of
transportation. All 10 were in manufacturing, with 4 of the top 5 being in automotive manufacturing. 8 of these
top 10 industries primarily rely on using road. Petroleum refineries and alumina and aluminum production and
processing were the only two in this list that relied primarily on water transportation for its inputs. None of the
industries that primarily used air, rail, or other appeared in the top 10.

Table 2. Industries with highest import mode concentration
 Industry Primary Import share HHI
 mode of mode
 Motor vehicle steering and suspension components (except spring) manufacturing Road 71.5% 0.57
 Motor vehicle transmission and power train parts manufacturing Road 71.8% 0.57
 Petroleum refineries Water 70.0% 0.56
 Motor vehicle seating and interior trim manufacturing Road 70.0% 0.55
 Heavy-duty truck manufacturing Road 69.7% 0.55
 Meat product manufacturing Road 69.7% 0.54
 Fruit and vegetable preserving and specialty food manufacturing Road 67.3% 0.53
 Automobile and light-duty motor vehicle manufacturing Road 68.3% 0.52
 Alumina and aluminum production and processing Water 67.3% 0.52
 Soft drink and ice manufacturing Road 67.1% 0.52

6HHI is a common index for measuring concentration ranging from 0 to 1, with 1 being the most concentrated. HHI =
∑ =1 2 , where is the import share of method and is the number of methods (equal to 5 in this case).

7
 While we do not consider import of services in this study as the mode of delivery for services is drastically different
from that of goods, we do include services-producing industries that import goods in the analysis.

 6
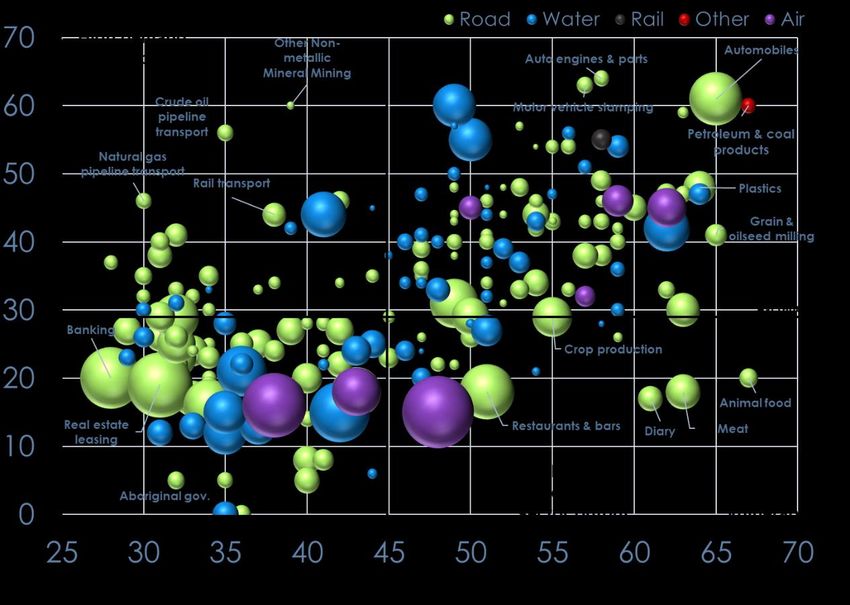
Downstream demand

 A similar exercise was carried out on the export side. One notable difference, however, is that we turn
our focus to trade in total exports rather than in inputs. Consequently, export data was predominantly matched
to non-services industries.8 Figure 3 shows the primary transportation method for exports using the same industry
aggregation.

 Much like the import transportation methods, the export side is dominated by road and water, but the
proportion of industries that mainly used other modes is higher. In 2019, over 5,500 products were exported at
the HS-8 level and matched to 126 Canadian industries. Road was once again the primary from of transportation
for the greatest number of industries at 88, followed by water (16), air (10), rail (9), and other (3).

Figure 3. Upstream and downstream vulnerability by export transportation method

 As with imports, we classified these industries into 6 broad categories based on NAICS codes and then
calculated each type of industry’s export concentration by method of transportation. In contrast to upstream
supply, the demand side shows a wider range of export concentration by mode of transportation across different
types of industries. This was mostly due to a heavy reliance on road for manufacturing industries—roughly two-
thirds of total exports, leading to an HHI of nearly 0.5. Exports from agriculture, forestry, fishing and hunting;

8 Because of the distinction between inputs and final products, we only focus on exports of final goods from 126
industries on the export side. All service industries were included in the supply side analysis as these industries import
goods, however most of these industries do not export goods (being service industries, their final products of export
are usually only services). Telecommunications and motion picture are examples of services industries that still export
final products.

 7
services; construction; and mining, quarrying, and oil and gas extraction industries had approximately the same
levels of export concentration when compared to imports. Utilities industry was the only type that used more
diverse forms of transportation for exporting goods than for importing.

Table 3. Industry average export concentration by mode of transportation
 Type of industry HHI Road Water Air Rail Other
 Manufacturing 0.48 66.5% 14.1% 10.0% 9.3% 0.1%
 Agriculture, forestry, fishing and hunting 0.37 46.7% 36.7% 14.7% 2.0% 0.0%
 Construction 0.37 34.0% 45.9% 0.0% 20.1% 0.0%
 Services 0.36 50.1% 11.9% 30.5% 6.4% 1.2%
 Mining, quarrying, and oil and gas extraction 0.33 21.7% 50.4% 8.1% 8.9% 11.0%
 Utilities 0.25 30.1% 8.5% 9.4% 18.4% 33.6%
 All industries 0.384 56.8% 19.0% 13.2% 8.7% 2.3%

 Diving deeper into the industry level, the higher concentration on the export side is much more apparent.
Each of the top 10 industries with the highest export mode concentration used its primary form of transportation
for over 90% of its final goods exports. This contrasts with around 70% for imports, as indicated in the supply
side analysis. Furthermore, this list is no longer dominated by road but rather with water accounting for 3 of the
top 5 spots. At the top of the list are 4 mining industries: Iron ore; copper, nickel, lead and zinc ore; and coal
mining industries almost exclusively exported their final products by water. By comparison, diamond mining
industry favored air transportation over other methods due in part to the high value of its shipments.

Table 4. Industries with highest export mode concentration
 Industry Primary Export HHI
 mode share of
 mode
 Iron ore mining Water 100.0% 1.00
 Copper, nickel, lead and zinc ore mining Water 99.0% 0.98
 Diamond mining Air 99.0% 0.98
 Coal mining Water 98.2% 0.96
 Heavy-duty truck manufacturing Road 98.2% 0.96
 Bakeries and tortilla manufacturing Road 95.8% 0.92
 Office furniture (including fixtures) manufacturing Road 95.4% 0.91
 Motor vehicle transmission and power train parts manufacturing Road 94.3% 0.89
 Electric power generation, transmission and distribution Other 94.1% 0.89
 Household and institutional furniture and kitchen cabinet manufacturing Road 93.9% 0.88

Other major forms of transportation
 The main form of transportation used in each industry for sourcing inputs and shipping final products is
important, but so are other types of transportation that account for a sizable share of trade. To put this into
perspective, heavy-duty truck manufacturing relies on road for 70% of its imports, but its second most used form
of transportation – water– also accounts for nearly a quarter of its overall imports. Therefore, a disruption to water
transportation could potentially severely impact this industry’s supply chain as well. To investigate this issue
further, we applied a cut-off of 20% for both exports and imports to identify the number of industries that are
potentially vulnerable to transportation disruptions under each mode of transport (tables 5 and 6).

 On the supply side, water now overtakes road as the top form of transportation for sourcing inputs with
214 out of 216 industries in Canada relying on this form of transportation for more than 20% of their imports.
Road follows closely in second place with 211 industries vulnerable to upstream disruptions, lacking 1 industry

 8
each in manufacturing, services, and utilities compared to water. Air came in third place with 27 industries, but it
was only heavily used in manufacturing, services, and 1 mining industry. Finally, only a few industries were
identified as vulnerable under other and rail, potentially suggesting a localized impact in the presence of
disruptions to these two forms of transportation.9

Table 5. Number of industries vulnerable to upstream disruptions by mode of transportation
 Type of industry Number of industries Road Water Air Rail Other

 Agriculture, forestry, fishing and hunting 8 8 8 0 1 0
 Construction 1 1 1 0 0 0
 Manufacturing 82 79 80 13 3 3
 Mining, quarrying, and oil and gas extraction 14 14 14 1 0 1
 Services 108 107 108 13 0 1
 Utilities 3 2 3 0 0 1
 Total 216 211 214 27 4 6

 In contrast to imports, the export side was dominated by road as over 100 industries heavily used this
form of transportation for shipping their final products. This was generally due to the large share of goods that
were sent directly across the border to the United States. Water and air transportation were in distant second
and third places by being heavily used in 35 and 28 industries, respectively, primarily concentrated in
manufacturing. Exports by rail was heavily used by 19 industries. Its increased importance compared to imports
is again likely driven by Canada’s high export concentration to the United States. Finally, 3 industries -oil and gas
extraction (except oil sands), oil sands extraction, and electrical power generation- heavily used other
transportation modes for exports.

Table 6. Number of industries vulnerable to downstream disruptions by mode of transportation
 Type of industry Number of industries Road Water Air Rail Other

 Agriculture, forestry, fishing and hunting 6 4 3 2 0 0
 Construction 1 1 1 0 1 0
 Manufacturing 82 80 17 15 13 0
 Mining, quarrying, and oil and gas extraction 14 5 11 1 2 2
 Services 20 14 3 9 2 0
 Utilities 3 2 0 1 1 1
 Total 126 106 35 28 19 3

9 Note that under these criteria, the count of industries does not directly reflect the potential severity of transportation
disruptions as some forms of transportation may not have any suitable substitutes. As an extreme example, an industry
that imports using all 5 modes of transportation equally (20% each) may seem balanced, but under this scenario would
be considered vulnerable to disruption in any form of transportation. However, in practice this type of balanced mode
composition almost never takes place, as the lowest industry HHI values were considerably higher than 0.2.

 9
Logistics vulnerability
 This section of our analysis will examine how vulnerable are Canadian industries to unexpected logistics
disruptions. Assessing trade by mode of transportation provides insights into how Canada imports and exports
goods; however, few events would lead to an entire mode of transportation needing to shut down for an extended
period. Perhaps the best example of an entire mode shutting down was in the aftermath of September 11th, where
international and domestic flights were cancelled. However, domestic flights resumed the following day, and
international flights resumed September 13th. (Thomson, 2018) It is also difficult to imagine this happening for
another form of transportation.10 Rail blockades were set-up by protesters in early 2020 that shutdown parts of
Canada’s rail transportation, but this more disrupted the domestic transportation of goods rather than the actual
importation and exportation of goods. Given the rareness of entire modes shutting down, looking at mode of
transportation may not be enough to label an industry vulnerable.

 Similarly, considering the port of entry or exit by itself is not enough to classify an industry as vulnerable.
If an industry is completely reliant on a single port of entry, the implications are quite different whether the port of
entry is a marine port, an airport, a train crossing, a pipeline, or a roadway. A marine port likely has few, if any,
substitutes available; an airport may have substitutes but without the required infrastructure in place to get the
goods to where they need to go. A roadway may have close substitutes, but an industry may nonetheless feel
the impacts of the delays—especially considering the importance of just-in-time supplies. For the rest of the
analysis, the vulnerability will be analyzed with respect to the intersection of port of entry/exit and the mode of
transportation; each port-mode combination will be considered a different crossing. The combination of crossing
and mode of transport is what we term logistics.

 To elaborate on the difference between port and crossing, Toronto-Pearson International Airport
processes imports from all 5 modes of transportation. While it only directly imports and exports by air, it also
serves as an important customs office for Canada. Goods may arrive in Canada at a location by any mode, but
may use Toronto-Pearson as the clearance office. However, the mode of transport remains the mode in which
they arrive or exit Canada. Thus, despite Toronto-Pearson being an airport, it becomes a port of entry for all 5
modes of transportation, and we define it as 5 different crossings.

 Defining logistic vulnerability with respect to each port-mode combination (or crossing) might be a point
of contention. For example, if the workers at Toronto-Pearson go on strike, the port will no longer process goods
that arrive by any mode so the impact should not be limited to a single mode. However, we feel as though the
implication on the different functions of the port are sufficiently distinct to warrant separating the modes. Goods
that come by air to Toronto-Pearson will be the most affected and finding a substitute port may be the most
difficult, whereas goods that use Toronto-Pearson simply as a customs office may be able to adjust more easily.
We leave it to future work to examine ports in their totality without separating them into port-mode combinations.

 After defining logistics vulnerability, the level of detail needs to be considered. While the final analysis
will have the vulnerability at the industry level, the inputs and outputs will not be treated as a homogenous good.
Assuming firms acts rationally and do not import products frivolously, each product is essential in the production
process (or at least essential to their cost minimizing behaviour), thus a disruption to one product may disrupt
the entire production process.11 For example, a ventilator requires over 700 parts—if any part is missing, the
ventilator cannot be produced. (Lam, 2020) Thus, the dependency of each product at the HS-1012 level to a
crossing is calculated, and then aggregated (based on share of value) to the industry level.13 Implicitly, the

10 There is a chance that all road and rail borders could be closed, given that they are all linked to the United States. It
may be difficult to disentangle country risk from port and mode risk in some instances, most notably the U.S. which
plays an important role for Canada.
11 Or profit maximizing behaviour on the export side.
12 HS-8 level for exports.
13 A manual manipulation to this process was needed for two industries, oil sands extraction; and oil and gas extraction

(excluding oil sands). The HS-codes are too aggregate to separate these two different types of oil exports. Thus, an
assumption was made that all oil produced in Alberta was oil sands extraction, and all other oil and gas production was
non-oil sands exports.

 10
assumptions being made are that each HS-10 product is homogeneous, and there is no substitutability across
products. The calculations mean that two products each imported through a separate crossing would be just as
dependent as two products going through the same crossing. The reasoning behind this calculation is that each
product is still dependent on a single crossing. This means the product-crossing dependency will not be masked
when aggregating to the industry level.

 To clarify terms, upstream vulnerability will refer to the vulnerability of an industry’s imports, and
downstream vulnerability will refer to an industry’s exports. For both upstream and downstream logistics
vulnerability, the dependency is measured using a concentration index for each product, by mode, which passes
through a given crossing. If a product is delivered using all 5 modes of transportation, then it will have 5
dependency scores; if it only uses a single mode of transportation, it will only have 1 dependency score. Similar
to the previous section, the HHI will be used as the measure of concentration.14 The reason for using a
concentration index is that it considers the distribution of ports for each mode—as opposed to using a measure
such as the maximum share which would only consider the most used crossing.15 Using the HHI, or a
concentration index in general, provides more flexibility and allows for a distinction between various combinations
of concentration that might arise. Additionally, the HHI has an attractive additivity property—essentially the result
of considering all crossings jointly gives the same result as considering crossings by each mode separately.
Thus, the overall score is unchanged whether each product has a single dependency score or five. Lastly, like
most indices, the results are ordinal and not cardinal, thus a normalization will be made by having the 5 indices
for the most vulnerable industry sum to 100.

Results
Before examining the vulnerability indices, a few summary statistics are useful for categorizing Canadian trade.16
Table 7 and 8 have for each crossing type: the share of exports/imports, the number of crossings available, the
share of exports/imports that goes through the most used crossing, and the share of exports/imports that go
through the top 10 most used crossings.

Table 7: Distribution of merchandise exports by crossing (intersection of port & mode)
 Top crossing Proportion
 Share of Number of share of exports in top 10
 Crossing type exports crossings exports crossings
 Air 10.9% 83 56.9% 99.0%
 Other 16.8% 48 69.2% 93.7%
 Rail 16.0% 73 25.4% 95.3%
 Road 36.7% 115 29.8% 89.8%
 Water 19.6% 102 40.0% 89.2%
 Total 100% 421 11.6% 61.3%

14 There are 2 common choices of concentration indices, the Theil index and the HHI. The HHI is more appropriate in
the context due to the fact that the Theil index increases (i.e. shows greater concentration) when more options are
added whereas the HHI decreases (i.e. shows less concentration) when options are added (Scarffe, 2019). In this case,
adding more crossings reduces the dependency of trade on all other ports, thus the index should decrease—making
the HHI the preferred choice.
15 Ultimately the choice between using the maximum share as a measure of concentration, or using the HHI to measure

concentration, does not affect the results. Comparing the concentration when using max-share and using the HHI to
measure concentration produced a correlation greater than 0.95 in each of the 10 indices (the 5 modes of
transportation, for both exports and imports).
16 The only category that has some ambiguity is the other category. Almost all of the value in this category is oil and

natural gas travelling through pipeline, or electricity travelling through power lines. A few other goods fall into the other
category and make up a very small share of value, but increase the number of ports.

 11
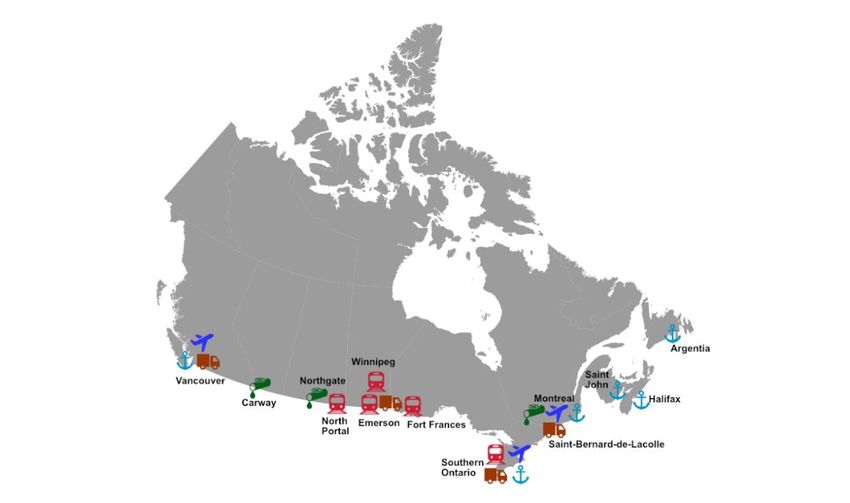
Table 8: Distribution of merchandise imports by crossing (intersection of port & mode)
 Proportion of
 Share of Number of Top crossing imports in top 10
 Crossing type imports crossings share of imports crossings
 Air 13.3% 123 52.0% 97.1%
 Other 2.5% 144 32.6% 89.4%
 Rail 8.7% 82 36.2% 92.1%
 Road 52.6% 200 27.3% 79.8%
 Water 22.8% 82 22.9% 86.0%
 Total 100% 631 14.4% 55.5%

 For both exports and imports, most crossings of exit and entry handle only a negligible amount of
Canadian trade, while the vast majority of Canada’s trade uses only a few crossings. On the export side, the
pipeline in Carway Alberta handles close to 70% of all pipeline/other exports and is the biggest crossing of exit
in Canada, handling 11.6% of all merchandise exports. The road portion of the Ambassador Bridge in Windsor
Ontario is the biggest port of entry and handles 14.4% of Canadian imports, it is also the largest road crossing of
clearance for exports. The rail portion of the Ambassador Bridge is the busiest port of clearance for imports, while
the rail crossing in Sarnia Ontario is the largest for rail exports. For air transportation, the Toronto-Pearson
International Airport handles over half of Canada’s trade by air for both exports and imports. Lastly, the port of
Vancouver is the leading port of exit for water exports, and the port of Toronto is the most important port of entry
for water imports.17

Figure 4. The location of major Canadian ports

Note: Each indicated port is at least 5% of the mode’s imports or exports.

17
 The Port of Toronto being the largest port of entry for water imports may seem incorrect, as it is a small port.
However, while it may only handle a small amount of marine traffic directly, it handles a lot of marine traffic as a
clearance office. Unfortunately, the data does not allow for a separation of the two functions.

 12
Next, product and industry dimensions are added to the analysis. Table 9 (downstream) and table 10
(upstream) have for each crossing type: the number of observations (which is a port-mode-product combination);
the average amount of each product that is exported by a given mode that passes through a crossing (e.g. for
air exports, each airport that a product uses will on average process 6% of a product); the average maximum
crossing for a given product (e.g. for air exports, the most used airport will on average process 18.3% of a
product); the average HHI for each product (mode specific); the average vulnerability across industries; and the
maximum vulnerability by industry.

Table 9: Summary statistics by product and crossing for downstream vulnerability
 Average Average Average Average
 Crossing crossing share max product industry Max industry
 type Observations of product crossing HHI vulnerability vulnerability
 Air 16,987 6.0% 18.3% 0.100 4.0 67.8
 Other 533 2.0% 5.7% 0.034 1.2 90.3
 Rail 4,252 4.6% 13.3% 0.063 2.7 33.0
 Road 37,834 7.8% 33.0% 0.199 20.8 83.0
 Water 14,796 7.7% 18.8% 0.108 9.4 99.9
 Total 74,402 7.1% 43.0% 0.150 38.0 100.0

Table 10: Summary statistics by product and crossing for upstream vulnerability
 Average Average Average Average
 Crossing crossing share max product industry Max industry
 type Observations of product crossing HHI vulnerability vulnerability
 Air 86,304 1.4% 8.0% 0.029 2.6 44.4
 Other 97,944 0.2% 0.8% 0.003 1.5 27.8
 Rail 20,048 1.7% 5.2% 0.019 1.4 24.8
 Road 253,780 2.3% 22.7% 0.109 13.8 50.1
 Water 48,166 5.1% 17.0% 0.072 5.8 33.1
 Total 506,242 2.0% 30.9% 0.068 25.1 80.4

 These statistics support the notion that most Canadian crossings process a negligible amount of
Canadian trade, and a few crossings handle most of the trade. The average crossing-share of exporting an HS-
8 product is only 7%—this means that the effective number of crossings of an HS-8 product is 14.18 Likewise for
imports, the 2% average crossing share means that the average HS-10 product can be expected to be imported
through 50 different crossings. Given the lower limit of zero, a positive skewness leads to the median number of
crossing to be above the mean. In fact, the median number of crossings for an exported product is 23, and for
imports the median is 76.

 However, the statistics from the average and the median are misleading. On average, 43% of an
exported product’s value, and 31% of an imported product’s value, passes through a single crossing. Akin to
looking at the distribution by crossings, although most products will enter or exit through dozens of crossings,

18 Note that the average is calculated using strictly positive values, so crossings with zero value of a product are not
bringing down the average.

 13
most of the value passes through only a couple. For example, the product HS-73181500—Bolts or screws, not
elsewhere specified, iron or steel—is exported through 90 different crossings of exit, however, 90% of the value
passes through just 6 of those crossings. Figure 5 and figure 6 have the total downstream and upstream logistics
vulnerability.

Figure 5: Total downstream vulnerability by industry

 Downstream logistics vulnerability
 100
 Logistics vulnerability

 80

 60 Average, 38.0
 40

 20

 0
 Canadian industries
 Air vulnerability Other vulnerability Rail vulnerability
 Road vulnerability Water vulnerability

Figure 6: Total upstream vulnerability by industry

 Upstream logistics vulnerability
 100
 Upstream vulnerability

 80

 60
 Average, 25.1
 40

 20

 0
 Canadian industries
 Air vulnerability Other vulnerability Rail vulnerability
 Road vulnerability Water vulnerability

 One of the most noticeable differences between these two graphs is that every mode of transportation
tends to play an upstream role in most sectors, whereas downstream sectors tend to be much more unimodal.
This is likely attributable to the fact that industries tend to be classified based on what is produced rather than
what is consumed. For example, other (power lines & pipelines) make a much larger share of exports than
imports, 16.8% vs. 2.5%. The red bars make up almost the entirety of three export sectors whereas the red is
visible, but small, in most import sectors. This is because three sectors are defined on the production of electricity
and oil & gas, and subsequently the downstream vulnerability of only three sectors have power line and pipeline

 14
(or other) vulnerability. However, almost all sectors use some amount of imported electricity or oil & gas, so
almost all sectors have some amount of upstream “other” vulnerability. If industries were defined by their inputs
rather than their outputs, than the above figures would be flipped—the upstream or import logistics would tend
to be unimodal whereas the downstream logistics would be more distributed across modes for each industry.

 Table 11 lists the sectors with the two highest vulnerability scores for each mode of transportation, as
well as the part of the vulnerability score that comes from the specific crossing-type. Figures 7 and 8 compare
the logistics vulnerability with the upstream supply and downstream demand vulnerability found in Boileau and
Sydor.

Table 11: Most vulnerable industries by crossing-type
 Logistics Logistics
 vulnerability vulnerability
 Crossing- (mode (mode
 type Imports specific) Exports specific)

 Non-ferrous metal (except
 80.4 (44.4) Diamond mining 67.9 (67.8)
 aluminum) production & processing
 Air
 Non-ferrous metal (except
 Other miscellaneous
 59.6 (41.6) aluminum) production and 79.9 (59.8)
 manufacturing
 processing
 Petroleum and coal product
 manufacturing (except petroleum 44.2 (27.8) Oil sands extraction 90.9 (90.3)
 Other refineries)
 Electric power generation,
 Coal mining 41.8 (16.9) 34.8 (33.2)
 transmission and distribution
 Resin, synthetic rubber, and
 Automobile and light-duty
 artificial and synthetic fibres and 51.5 (24.8) 49.0 (33.0)
 motor vehicle manufacturing
 filaments manufacturing
 Rail
 Resin, synthetic rubber, and
 Basic chemical manufacturing 48.9 (11.1) artificial and synthetic fibres 39.6 (27.4)
 and filaments manufacturing
 Motor vehicle seating and interior
 54.3 (50.1) Tobacco manufacturing 99.1 (83.0)
 trim manufacturing
 Road
 Motor vehicle steering and Motor vehicle transmission
 suspension components (except 52.3 (49.2) and power train parts 79.6 (79.2)
 spring) manufacturing manufacturing
 Iron and steel mills and ferro-alloy
 47.9 (33.1) Coal mining 100.0 (99.9)
 manufacturing
 Water
 Petroleum refineries 37.1 (29.6) Gold and silver ore mining 89.6 (88.6)

 15
Figure 7: Downstream vulnerability by crossing-type and demand
 Downstream logistics and demand vulnerability
 100 Oil sands extraction
 Coal Mining
 Diamond mining
 Road
 80 Tobacco manufacturing
 Logistics vulnerability

 Water

 60 Rail
 Automobile
 Other
 manufacturing
 40
 Air

 20

 0
 10 20 30 40 50 60 70
 Demand vulnerability
 Note: The logistics vulnerability displayed comes from the given mode only, it is not total logistics vulnerability.

Figure 8: Upstream vulnerability by crossing-type and supply
 Upstream logistics and supply vulnerability
 60 Motor vehicle seating
 Non-ferrous metal
 manufacturing
 production
 50 Road
 Logistics vulnerability

 Iron and Steel
 40 Manurfacturing Water
 Synthetic fibres Rail
 30 manufacturing
 Other
 20 Air

 10 Petroleum and coal
 manufacturing
 0
 20 30 40 50 60 70
 Supply vulnerability
 Note: The logistics vulnerability displayed comes from the given mode only, it is not total logistics vulnerability.

 One takeaway from the graphs is that the majority of output falls below the median vulnerability for both
imports and exports and there is a negative correlation between output and logistics vulnerability for both exports
and imports.19 This is good for the Canadian economy—the bigger the sector, the less likely it is to be vulnerable
to a crossing shutdown. Another feature of both graphs is that there is a tight, statistically significant, correlation
between logistics vulnerability and both demand and supply vulnerability. It seems reasonable that if Canada
sources all its imports from a particular country for a given sector, than most of those imports would come through

19 Significant at the 5% level in both cases.

 16
the same crossing. This is not an a priori feature of the indices as there is nothing that says all imports from a
given country need to pass through a specific crossing. However, given that most of Canada‘s merchandise trade
happens with the United States and most of the international trade happens North-South rather than East-West,
this result seems to fit common Canada-U.S. trade narratives.

 While it might seem like the supply or demand concentration causes the logistics concentration, the
causality can also work in reverse. An example of the logistics concentration causing downstream demand
concentration is the oil sands extraction industry. One of the major difficulties with Canada’s oil sands is that it is
difficult to get the oil from Alberta to the coast of British Columbia. 20 As a result, the oil sands rely on sending
their oil to the United States and this is part of the reason for why Western Canadian Select oil trades at a discount
compared to West Texas Intermediate. While supply or demand concentration may cause the logistics
concentration in many cases, there are exceptions where the logistics concentration causes the country
concentration.

 One feature that appears in tables 9 to 11, and figures 5 to 8 is that downstream logistics vulnerability is
generally higher than upstream logistics vulnerability. Given that the dependency is calculated at the product
level and not the industry level, the classification discussed earlier doesn’t explain why downstream exports tend
to have higher vulnerability scores than upstream imports. It is instead due to a characteristic in Canadian trade
that exports are more concentrated geographically than imports. The ex-ante expectation would be for imports
to be more concentrated, since they have a more detailed level of classification; however, the average weighted
geographic HHI by product is 0.72 for exports, and only 0.57 for imports.21 Given that exports tend to go more to
the same country than imports, it makes sense that exports tend to pass through less ports. This is another case
where the direction of causality matters: is it the logistics causing exports to be more geographically concentrated
than imports, or is it the disparity in geographic concentration between imports and exports that causes the
disparity in logistics vulnerability? To the best of our knowledge, the reason for this is unclear (and likely worthy
of a separate paper), so this study will leave this as an open ended explanation: the logistics vulnerability is
correlated with the geographic concentration of trade.

 The way the vulnerability scores have been presented thus far may not be the most appropriate way of
assessing an industry’s vulnerability. The problem is that the type of crossing likely has a substantial impact when
assessing the severity of the vulnerability to a crossing shut down. As previously mentioned, a road crossing is
the most likely to have available substitutes while the other modes seem less flexible. This is not to say that a
shutdown to the Ambassador Bridge would not cause major issues—it certainly would as other crossings of
clearance would not be able to absorb the close to 30% of the total road trade that the bridge handles, but there
would be some close-by substitutes that could take on some of the lost capacity. However, if the marine port of
Vancouver, Toronto-Pearson airport, or the pipeline in Carway Alberta shut down, finding available substitutes
seem less likely.

 Ideally, there would be a way to quantify the substitutability of each crossing—including road crossings—
and factor that into the vulnerability scores; however, this step is beyond the scope of this paper. As an
alternative, figures 9 and 10 below contain the same information as figure 7 and 8 but using only the non-road
modes of transportation.

20 There is a multitude of reasons, but primarily this is due to environmental concerns.
21 Where the weights are each product’s share of total exports/imports. This also holds for the unweighted average of
HHI’s across products. This is also calculated using the country of export (customs basis) instead of using the country
of origin (Balance of Payments basis) which would result in an even lower concentration for imports.

 17
Figure 9: Vulnerability by downstream by non-road crossing and demand
 Downstream logistics and demand vulnerability
 100

 Gold and silver ore
 80
 Logistics vulnerability

 mining
 Water
 Non-ferrous metal
 production Other
 60 Synthetic fibres
 manufacturing Rail
 Electricity
 40 Air

 20

 0
 10 20 30 40 50 60 70
 Demand vulnerability
 Note: The logistics vulnerability displayed comes from the given mode only, it is not total logistics vulnerability.

Figure 10: Upstream vulnerability by non-road crossing and supply
 Upstream logistics and supply vulnerability
 60

 Miscellaneous
 50
 manufacturing
 Logistics vulnerability

 40 Petroleum refineries
 Coal mining

 30 Water

 Other chemical Rail
 20 manufacturing Other

 10 Air

 0
 20 30 40 50 60 70
 Supply vulnerability
 Note: The logistics vulnerability displayed comes from the given mode only, it is not total logistics vulnerability.

 Once road is eliminated, water becomes the dominant vulnerability concern. On the downstream side,
water has the highest vulnerability score for 58 of the 126 industries (46%); on the upstream side, water has the
highest vulnerability score for 174 of the 216 industries (81%). For both imports and exports, the vulnerability by
crossing decreases significantly for most bubbles. With road included, only 23 of the 126 sectors had a total

 18
downstream score less than 20; once road is eliminated 87 of the sectors have a total score less than 20. 22 The
import side is similar: with road included, 67 of the 216 sectors had a total upstream vulnerability by crossing less
than 20; once road is excluded, that number increases to 198. Thus most sectors, both upstream and
downstream, once road is eliminated are not vulnerable to another type of disruption.

Conclusion
 This chapter has examined the reliance of Canadian industries on different modes of transportation and
the vulnerability of Canadian industries to a shutdown of a border crossing. Overall, industries in Canada were
found to be heavily dependent on road and water transportation for both the supply of their imports and exports
of goods. Road was heavily used in all types of industries, but especially in auto manufacturing as they posted
some of the highest import and export concentrations out of all the industries. Reliance on water transportation
was widespread for sourcing inputs with nearly every industry importing over one-fifth of its inputs with this
method, but the extent of using water for exports was more limited to certain industries like mining. Air
transportation was not common but was used intensively for transporting high-value goods such as diamonds.
Rail and other transportation modes were not extensively used for most industries, potentially indicating a more
localized impact in the presence of a transportation disruption.

 To further investigate Canadian the logistic vulnerability in Canadian GVCs, where and how the goods
crossed the border was added to the analysis. It was found that although Canada has more than 400 crossings
of exit, and over 600 crossings of entry, most trade passes through only a handful of those crossings. The majority
of the output in the Canadian economy has both upstream and downstream logistics vulnerabilities below the
median and a negative correlation exists between size of the industry and logistics vulnerability. Road crossings
was the most vulnerable for the majority of industries and eliminating the road crossings led to most industries
having low vulnerability. Lastly, there is an intimate link between the geographic diversification of trade and the
logistics vulnerability—however, the direction of causality might work in both direction and the reason why exports
are more concentrated than imports is left as an open ended question for future research.

References
Boileau, D., & Sydor, A. (Forthcoming). Vulnerability of Canadian Industries to Disruptions in Global Supply
Chains, Global Affairs Canada.

Chatterjee, L., & Tsai, C. M. (2002). Transportation logistics in global value and supply chains. Center for
Transportation Studies, Boston University.

Industry Canada. (2019, January 10). Canadian automotive industry. Retrieved December 01, 2020, from
https://www.ic.gc.ca/eic/site/auto-auto.nsf/eng/Home

Kherbash, O., & Mocan, M. L. (2015). A review of logistics and transport sector as a factor of globalization.
Procedia Economics and Finance, 27, 42-47.

Lam, Y. (2020, April, 13) Coronavirus: A Resilient Logistics Sector Can Save Lives and Livelihoods. World Bank
Blogs. blogs.worldbank.org/transport/coronavirus-resilient-logistics-sector-can-save-lives-and-livelihoods.

Limao, N., & Venables, A. J. (2001). Infrastructure, geographical disadvantage, transport costs, and trade. The
world bank economic review, 15(3), 451-479.

22There is no economic significance to using 20; however, it is conservatively below the median total vulnerability for
exports and imports of 35 and 25, respectively. Furthermore, once road is eliminated, the logistics vulnerability for the
majority of industries is below 20.

 19
Scarffe, C. (2019). Canada’s Geographic Export Diversity, Global Affairs Canada.

Saranga, H., Mukherji, A., & Shah, J. (2015). Inventory trends in emerging market supply chains: Evidence from
the Indian automotive industry. IIMB Management Review, 27(1), 6-18.

Statistics Canada. Table 36-10-0478-01 Supply and use tables, detail level, provincial and territorial (x 1,000)

Suraj, B. S., Sharma, S. K., & Routroy, S. (2016). Positioning of inventory in supply chain using simulation
modeling. IUP Journal of Supply Chain Management, 13(2), 20.

Thomson, A. (2018, September 13). Timeline: 9/11 and Canada. Retrieved December 01, 2020, from
https://www.cpac.ca/en/cpac-in-focus/timeline-9-11-and-canada/

 20
You can also read