Dar es Salaam Market Research - Cautious investment January 2018 - Cytonn Investments
←
→
Page content transcription
If your browser does not render page correctly, please read the page content below
`

Dar es Salaam Market Research
     Cautious investment
         January 2018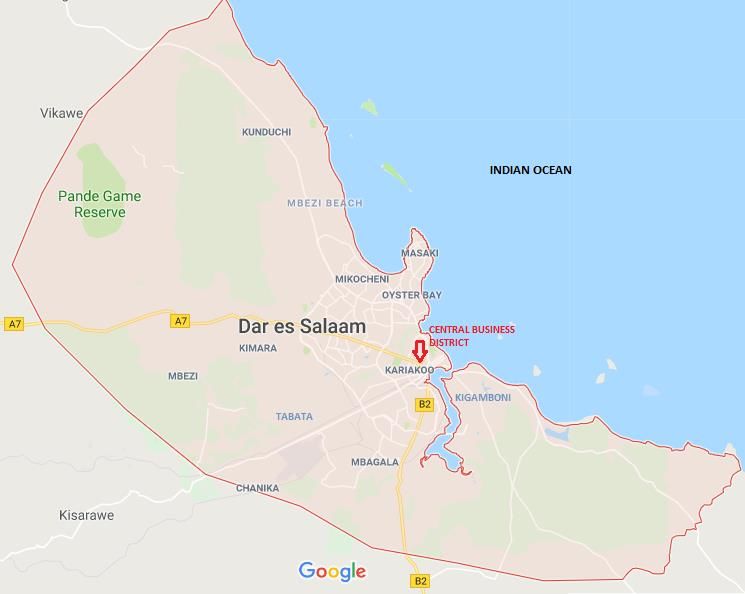
Table of Contents
I.      Introduction

II.     Tanzania Macro-economic Analysis

III.    Overview of Real Estate in Tanzania

IV.     Subject Area: Dar es Salaam

V.      Residential Research

VI.     Commercial Office Sector Research

VII.    Retail Sector Research

VIII.   Land Research

IX.     Hospitality Research

X.      Summary

                                              2
I. Introduction

3
Introduction
The research focuses on real estate in Dar es Salaam, Tanzania

• This study aims to provide insight into the Dar es Salaam real estate market and its surroundings, specifically for
  residential development, commercial sector, land and hospitality sectors

• The objective of this study is to carry out a market survey in the subject area and provide an opinion of the following;

      •   Market selling price
      •   Current market rentals
      •   Comment on occupancy and sales uptake
      •   Comment on market trends and provide the appropriate recommendations for investment

• The survey was based on information supplied to us by;

      •   Professional experience in real estate matters in Dar es Salaam
      •   Observations and various comparable properties
      •   Interviews with real estate practitioners in Tanzania
      •   Secondary Sources e.g. Tanzania National Bureau of Statistics, Ministry of Natural Resources and Tourism

• We have analyzed the data we collected and presented in the form of:

      • Tables
      • Photographs
      • Qualitative data as narrative

• We have used the analyzed data to draw up conclusions and make recommendations on the highest and best use of the
  subject property and to provide guidance for similar investments in this market
• The exchange rates used are 1 USD= Tshs 2,233, 1 USD=103.4 Kshs, 2017 average

                                                             4
Executive Summary
Real Estate sector in Dar Es Salaam has attractive rental yields with average yields of 5.2%, 6.4% and 9.3% for
residential, office and retail sectors, respectively
• We, in January and February 2018, carried out market research in Dar Es Salaam which is Tanzania’s main economic hub
and the second largest port city in Eastern Africa after Mombasa. The research focused on the real estate performance in
the residential, hospitality and commercial sectors thus providing us with a general overview of the market
• In terms of performance, the average dollarized rental yield across all themes was 6.9% with 5.2%, 6.4% and 9.3%, for
residential, office and retail sectors, respectively
• The retail sector recorded the most attractive yields of 9.4%, 2.5% points higher than the consolidated real estate yields,
driven by foreign retailers and increasing consumerism. The opportunity for retail is in community malls in prime areas
such as Masaki and Upanga with occupancies of above 90.0% and yields of 10.9% and 10.3%, respectively
• The residential market has average yields of 5.2% but characterised by a negative price growth by 4.2% due to slowed
uptake. However, the sector has pockets of value in detached unit sales for the low end segment which has the highest
uptake at 53.7% and in rental apartments for the mid end segment which has the highest yields at 7.8%
• The office sector performance was subdued most attributable to an increasing office stock with stagnated demand as
multi-nationals scale back operations and government bodies transfer operations to Dodoma. Grade A office space had
the highest yields with an average of 8.6% against the office market’s 6.4%, which we attribute to the high recorded
occupancy rates averaging at 92.9% against the market’s 72.1%
• The hospitality sector has retained an average room occupancy of 63.9% over the last 5-years and is expected to grow
further driven by leisure travel and the governments’ commitment to improve infrastructure, one of the main challenges
in the sector
• The opportunity in the sector is in:
➢ Low-end detached units for sale and mid-end apartments for rent
➢ High quality retail outlets in parts of Dar es Salaam such as Upanga, Masaki and Oysterbay
➢ Luxury hotels which have low supply
5Dar es Salaam Real Estate Investment- “Cautious Investment”
We see an opportunity for investment in low-end, mid-end residential, retail sector and hospitality while investors
should hold out on the commercial office sector and high-end residential where performance has slowed
Value Area Summary Effect
• Positive demographics such as a population growth • Continued efforts by government bodies such as
rate of 3.1% and urbanisation at 5.0% have NSSF, NHC in provision of housing with priority for
resulted in residential, land and retail real estate the low-income segments of the population
Demand demand mainly • The formal retail sector has grown with at least 0.9
• Increasing supply, high cost of credit and transfer MN SQFT to be complete in the next 5 years
of government operations to Dodoma has resulted • The commercial office sector has seen an increase
in subdued demand for office space in increase in vacant office space stock
• The retail sector has the highest yields at 9.4%
• The retail sector maintained relatively high rental
compared to office sector at 6.4% and the
rates and occupancy at USD 20.0 per SQM and
residential sector at 5.2%
87.1%, respectively
• The real estate sector is dominated by government
Returns • The declined performance in residential and office
bodies who retail flat rates thus minimal
sector has resulted has caused a slow down in the
appreciation
contribution to GDP from real estate and
• Subdued demand in the private sector has led to
construction by 1.0% and 1.4% points, respectively
an overall 4.2% depreciation
• The opportunity is in the retail sector and the • We expected continued investment in retail,
Opportunity hospitality sector due to sustained demand hospitality, the mid-end and low-end residential
& • There are also pockets of value in the residential sector
Outlook sector in rentals for the mid-end sector and sales • We expect a slow-down in investment in office and
in the low-end sector the high-end residential sector
We expect reduced activity in the commercial office sector and high-end residential sector given the
increasing supply stock against subdued performance with developers shifting their focus to retail and
housing for rent in the mid-end segment and for sale in the low-end sector.
6II. Tanzania Macro-economic Analysis 7
Tanzania Macro-economic Analysis: Country Profile
Tanzania, located in East Africa has an estimated population of 56.9 mn as at 2017
                Tanzania Demographics and Systems
Political System:           Multi-Party Democracy
Capital:                    Dodoma
Other common cities:        Dar es Salaam, Arusha, Mwanza
Current President:         H.E John Pombe Magufuli (from 2015)

Population (2017):         56.9 mn

Popn. Growth Rate:         3.1%

Urban Population:          32.3% of total population
Urbanization:              5.0%
Currency                   Tanzania Shilling
National Language:         Kiswahili
Other Languages:           English
Main Exports:              Minerals, coffee, cotton, cashew nuts
GDP (2017):                USD 51.2 bn

GDP per Capita (2017):     USD 1,032
                           Christian (61.4%), Muslim (35.2%) &
Religious Groups:
                           Others (2.0%)
Country size:              947,303 sq. km.

Immediate Neighbors:       Kenya, Uganda, Rwanda, Burundi, DRC

 Source - African Development Bank Group, World Bank               8
Tanzania Macro-economic Analysis
Tanzania’s GDP is expected to grow by 6.7% in 2018 driven mainly by infrastructural development
Factor Details
• Tanzania has had one of the fastest growing economies with GDP growth averaging at 6.6% annually since 2012 driven
mainly by growth in mining, construction, financial services, information and communication sectors
• The main contributor to GDP growth is the services sector accounting for 42% of GDP compared to agriculture, forestry and
fishing at 31% and Industrial and Construction sectors at 27%
• In 2017, however, GDP growth slowed down during H1 at 6.8% growth compared to a 7.7% growth during the same period
GDP Growth in 2016 and was estimated at 6.6% by the IMF for the full year, attributed to reduced government spending amid
government policy reforms to curtail corruption and wasteful spending
• According to the AfDB, however, growth is expected to remain strong at 6.7% in 2018 and 6.9% in 2019 driven by
infrastructural development and a tightening trade deficit with drop in imports
• The Tanzania Shilling remained relatively stable in 2017 trading at Tshs 2,233 to the dollar on average albeit depreciating
against the dollar by 2.5% y/y in 2017 compared to a 1.0% decline in 2016
Currency • The Tshs is expected to go through gradual depreciation in Q1 2018 due to increased pressure from imports. However,
overall, the currency is expected to remain steady given the governments’ measures to reduce importation and boost
exports
• Interest rates in Tanzania have averaged at 16.1% over the last 5 years with 2017 recording 16.6% average
• The Bank of Tanzania kept the monetary policy rate at 12.0% during the first half of 2017 but lowered it to 9% to boost
Interest Rates credit growth after it fell from 24.8% in 2015 to 7.2% in 2016 and to 0.3% in August 2017
• This has however not improved credit growth as there has been a rise in risk premium associated with more non-
performing loans. Currently bank lending rates range from 17.0%-21.0%
• Inflation in Tanzania has remained relatively low averaging at 5.4% over the last 3 years near the government’s medium-
term target of 5.0%.
Inflation • Inflation as at January 2018 stood at 4.0% mainly due to a slowdown in housing and utilities prices
Source - ADB Group, World Bank, Trading Economics 9III. Overview of Real Estate in Tanzania
10Overview of Real Estate in Tanzania
Real estate has yields of 5.2%, 6.4% and 9.4% for residential, office and retail sectors, respectively
• The real estate sector contributed to 3.8% of Tanzania’s GDP in H1 2017, a decline from 4.0% contribution during
the same period in 2016. The sector grew by 2.3% compared to 2.4% growth during the same period in 2016
Macro-economic • The construction sector contributed to 11.1% of Tanzania’s GDP in H1 2017, compared to 10.9% contribution in
Contribution
2016. The sector grew by 8.6% compared to 10.0% growth during the same period in 2016
• The slowed growth in real estate and construction activity has been due to tight liquidity, reduced credit growth,
inadequate infrastructure and slowed real estate uptake mainly in the high end market in the last 2 years
• The real estate sector has rental yields averaging at 5.2%, 6.4% and 9.4% in the residential, office and retail
sectors, respectively
Returns • The market has witnessed a decline in the residential and office sector since 2015 due to implementation of
policies that have resulted in lower purchasing power of residents and scaling back of multinationals who were a
significant market for real estate
• Tanzania’s real estate market is dominated by individual home-builders and the public sector through the National
Housing Corporation, Tanzania Building Agency and pension bodies such as NSSF and Watumishi Housing
Key Players
• The private sector which caters for approximately 3.9% of the supply, is still at nascent stages and comprises of
players such as Avic, Nevada Properties, Estim, Group 4 and Quality Group
• The outlook is positive for the retail sector driven by demand by international retailers but negative in the office
sector due to increasing supply and the scaling back of multi-nationals
Market Outlook
• The outlook for residential sector is neutral given the subdued performance in the high-end sector while demand
remains high in the low-end sector
11IV. Subject Area, Dar es Salaam 12
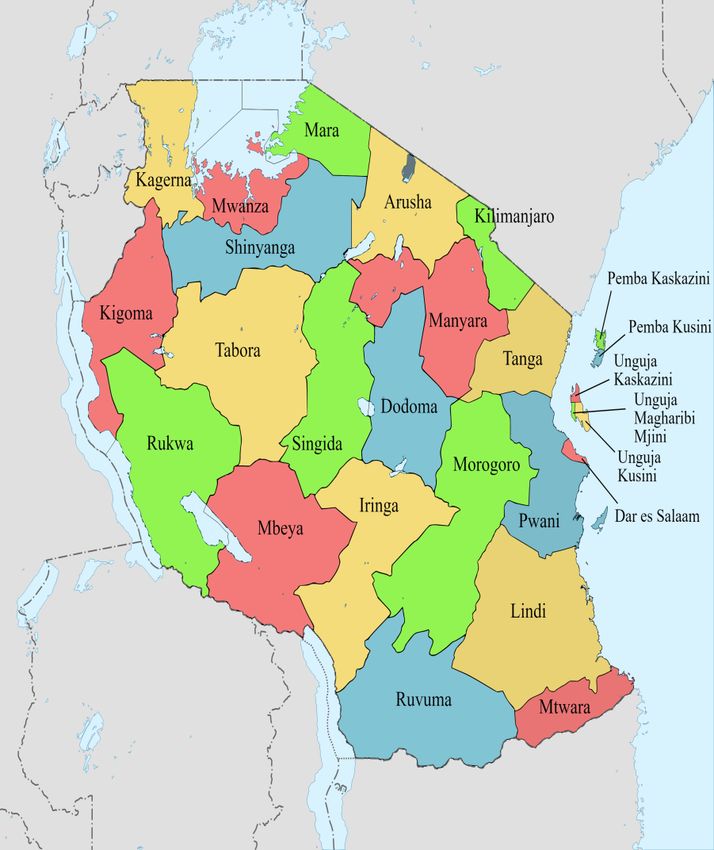
Subject Area: Dar es Salaam
Dar es Salaam is the main commercial city of Tanzania, one of the East African Countries

                                                13
Subject Area: Dar es Salaam
Dar es Salaam comprises of areas such as Mbezi, Mikocheni, Ilala, Kigamboni, Masaki and Kariakoo
14Subject Area: Dar es Salaam, Overview
Dar es Salaam has a population density of 3,661 persons per sqkm
• Dar es Salaam is the largest city and main commercial hub of Tanzania
• It was the capital city of Tanzania before Dodoma became the capital in 1996
• It has an estimated population of 5.1 Mn persons as at 2018 and a density of 3,661 persons per sqkm
Services
• For road travel, Daresalaam is served by main highways such as Ali Hassan Mwinyi, Nyerere, Bagamoyo, Morogoro and Kilwa
roads which are in a good state of repair
• In addition to the local bus transport, the government, in 2016, implemented Phase 1 of Mass Rapid Transit system to cater
for the transport needs of the growing population, stretching from Kimara to Kivukoni with 5 terminals and 29 stations
• Dar es salaam hosts the country’s main sea port handling approximately 90% of the country’s cargo
• Residents rely on ferry services and the newly constructed Kigamboni bridge to access Kigamboni area
• It is served by the Julius Nyerere International Airport area for air travel
• The Dar es Salaam Water & Sewerage Corporation (DAWASCO) is the main provider of water and sewerage disposal services
in Dar es Salaam
• The city is served with electricity from the Tanzania Electric Supply Company Ltd
• It is also well served with telecommunication lines with the main mobile service providers being Airtel, Vodacom & Tigo
Economic Services
• The main economic activities are in the financial, manufacturing, transport, trade and tourism sectors
• The town is the main educational center of Tanzania with schools at the primary, secondary and tertiary levels including the
University of Dar es Salaam and Brae burn group of Schools
15V. Residential Research 16
Residential Research: Overview
The residential sector in Dar es Salaam is dominated by the individual-home builders and the National Housing
Corporation as the main developer
• The residential sector is dominated by individual home builders and the public sector either through the National Housing
  Corporation or the Tanzania Building Agency (TBA) who cater for Tanzanians or government employees

                                                     Key Players in the Residential Sector
                            Players                                                           Contribution
   2012        1            Individual Unsurveyed Dwellings                                     70.00%

               2            Individual Surveyed Dwellings                                       13.50%

               3            National Housing Corporation                                         5.10%

               4            Real Estate Developers                                               3.90%

               5            Central Government                                                   3.00%
   201         6            Pension Institutions such as NSSF                                    2.40%
   3           7            Local Government                                                     2.10%
  Source; Ndunduma, 2009

   • We have collected information on housing in both public and private sectors, analyses and summarised the findings
   • For the purposes of this research, we have divided Dar es Salaam into the following segments;
         • High End- Areas such as Oyster Bay, Masaki, Morocco and Msasani
         • Mid End- Areas such as Mbezi, Kunduchi, Kinondoni, Mikocheni, Mwenge, Upanga, Kariakoo and Kisutu
         • Low End- Areas such as Mbagala and satellite locations such as Kigamboni and Bunju

                                                                  17
Residential Research: Factors Driving the Sector
Positive demographics, government initiatives, infrastructural development and multi-nationals are the
main drivers of the sector
Key Drivers
• Demographics • Tanzania has a population of 57 Mn people growing at 3.1%, compared to the global average of 1.2%. This translates to a
density of 60.5 people per Sqkm (Kenya has 87 people per Sqkm)
• 32.3% of its population is urban and growing at 5.0% annually compared to the global average of 2.1%, thus creating
demand for housing
2012
• According to the National Housing Corporation 2010, Tanzania has a housing deficit of 3 mn units, growing at 200,000 units
annually showing the increasing housing requirement
• Government
• The government through institutions such as the National Housing Corporation, the Tanzania Building Authority and
Initiatives
pension bodies such as NSSF are actively involved in development, selling and renting of houses for the Tanzania residents
201 in order to address the housing shortage thus boosting the growth of the sector
3
• Entry of • The discovery of gas in 2015 and the presence of a sea port has attracted multi-national companies in the transport,
Multinationals
manufacturing and mining sectors, who demand for institutional grade real estate including housing
• Investors therefore develop houses in the upper and mid-end segment of the market, furnish them and rent out to
expatriates
• Infrastructural • The government has invested in infrastructure through construction of roads to areas such as Kigamboni, construction of
Development the Kigamboni bridge, implementation of the Bus Rapid Transit system and ongoing construction of a standard gauge
railway to ease accessibility, thus boosting real estate growth in out of town areas
18Residential Research: Challenges Facing the Sector
The main challenges are relatively high financing costs, unfavourable government policies and undeveloped
infrastructure in some areas
Key Challenges
• Financing Costs • Costs of borrowing in Tanzania are relatively high ranging from 17%-21% per annum limiting the uptake of mortgages
• The Mortgage to GDP ratio stands at 0.53% as at 2016 compared to Kenya at 2.7% as at 2016 and Uganda at 0.9%
• Taxation • The government imposes 18% VAT on all property purchases which increases the cost of buying a house, limiting
2012
affordability, compared to countries such as Kenya where VAT is not imposed on properties
• Undeveloped • Various parts of Dar es Salaam such as Kigamboni lack requisite infrastructure such as water connection, sewers,
Infrastructure electricity and proper road access hindering growth of real estate as developers have to incur extra costs to provide these
services
201
3
• Foreign Exchange • Currency volatility especially between 2015 and 2017 has resulted in depreciation of the Tanzania Shilling, causing
Volatility renters to pay more rent as properties were initially charged in USD
• Recently, however, property managers are required to value their properties in Tshs to protect tenants’ interests
• Government • The implementation of austerity measures such as a strict new tax regime by the new government since 2015 has
Policies resulted in reduced spending which has led to low purchasing power of real estate consumers
• It has also resulted in closure of firms, and scaling back of multi-national firms who are a main market for high and mid
end real estate. This has forced stakeholders to reduce rents and prices and thus lower returns
19A. Residential Research 20
Residential Research: High End
Detached units in the high-end market have higher yields due to high rental charges
Apartments

                   Unit Plinth      Price        Price   Price per SM   Rent per SM   Occupancy   Annual Uptake       Rental
Typology                 (SM)      (USD)        (Tshs)          (USD)         (USD)          %                %      Yield %
1 Bed                      75                                                  4.7       100.0%                        4.0%
2 Bed                    168     266,667      580.7m            1,377          6.4        90.6%          23.3%         4.9%

    2012
3 Bed                    228     254,050      567.4m            1,402          6.3        87.4%          20.0%         4.7%
4 Bed                    256     370,375      827.2m            1,403          6.8        92.7%          16.7%         5.2%
Average                                                         1,394          6.0       92.7%           20.0%         4.7%
Detached

                   Unit Plinth      Price        Price   Price per SM   Rent per SM   Occupancy                       Rental
Typology                  SM)      (USD)        (Tshs)          (USD)         (USD)          %                       Yield %
2 Bed                    216                                                   8.1        83.3%                        7.6%
3 Bed                    323                                                   8.9        71.1%                        8.2%
4 Bed                    430                                                   8.0        91.7%                        9.1%
5 Bed                    560     600,000     1,340.1m           1,071          5.6       100.0%                        6.3%
Average                                                         1,071          7.7       86.5%                         7.8%

• The high-end market comprises of developments in areas such as Masaki, Msasani, Oyster Bay, Morocco and parts of
   Kisutu
• In this sector, detached units have the highest yields at 7.8% as they are relatively lower in supply thus able to charge
   premium rents

                                                           21
Residential Research: Mid End
Apartments in the mid-end segment have higher yields of 7.8% compared to detached at 3.4%
Apartments
Unit Plinth Price Price Price per SM Rent per SM Occupancy Annual Rental
Typology (SM) (USD) (Tshs) (USD) (USD) % Uptake % Yield %
2 Bed 73 134,648 300.7m 1,750 10.5 82.2% 18.3% 8.7%
3 Bed 136 143,097 319.6m 1,026 6.9 81.0% 25.6% 6.9%
2012
4 Bed 181 151,231 337.8m 835 5.4 75.0% 18.5% 7.8%
Average 1,204 7.6 79.4% 20.8% 7.8%
Detached
Unit Plinth Price Price Price per SM Rent per SM Occupancy Annual Rental
Typology (SM) (USD) (Tshs) (USD) (USD) % Uptake % Yield %
2 Bed 110 136,500 304.9m 1,281 27.8% 3.2%
3 Bed 171 224,814 502.1m 1,303 4.3 75.0% 13.0% 2.8%
4 Bed 327 311,848 696.5m 1,143 4.9 67.5% 18.4% 4.2%
Average 1,243 4.6 71.2% 19.7% 3.4%
• The mid-end sector comprises of developments in Mbezi Beach, Kawe, Mikocheni, Mwenge, Upanga and parts of Kisutu
• In this sector, apartments have the highest yields at 7.8% and annualized uptake at 20.8% compared to detached units
with a yield of 3.4% and annual uptake of 19.7% driven by demand from the growing middle class who seek quality
developments with relatively affordable prices/rents
22Residential Research: Low End
Detached units in the low end segment have relatively high uptake at 53.7% annually
Apartments
Unit Plinth Price Price Price per SM Rent per SM Annual Rental
Typology (SM) (USD) (Tshs) (USD) (USD) Uptake % %
2 Bed 76 30,331 67.7m 402 1.5 8.3% 3.2%
3 Bed 101 57,028 127.4m 379 1.6 8.3% 3.5%
Average 390 1.6 8.3% 3.3%
2012
Detached
Unit Plinth Price Price Price per SM Rent per SM Occupancy Annual Rental
Typology (SM) (USD) (Tshs) (USD) (USD) % Uptake % Yield %
2 Bed 61 23,477 52.4m 361 1.6 70.0% 66.7% 4.1%
3 Bed 104 43,242 96.6m 414 1.9 70.0% 40.7% 3.8%
Average 388 1.7 70.0% 53.7% 3.9%
• The low-end market comprises of developments in satellite areas such as Kigamboni and Bunju
• In the low-end sector, apartments have relatively slow uptake at 8.3% annually compared to detached units with 53.7%
due to preference to own-compound houses
• Rentals in the low-end sector are relatively low ranging from USD 1.5-USD 1.9 per SQM indicating low demand and thus is
more suited for a buyer intending to live in, as opposed to an investor
23Residential Research Summary
The residential sector has yields of 5.2% with 80.0% occupancy
Annual Rental Price Total
Segment Type Price per SM Rent per SM Occupancy Uptake Yield Appreciation Returns
High End Apartments 1,394 6.0 92.7% 20.0% 4.7% (6.2)% (1.5)%
High End Detached 1,071 7.7 86.5% 7.8% (6.2)% 1.6%
Mid End Apartments 1,204 7.6 79.4% 20.8% 7.8% (9.2)% (1.4)%
Mid End Detached 1,243 4.6 71.2% 19.7% 3.4% (9.2)% (5.8)%
2012 Apartments
Low End 390 1.6 8.3% 3.3% 1.4% 4.8%
Low End Detached 388 1.7 70.0% 53.7% 3.9% 1.4% 5.4%
Average 948 4.9 80.0% 24.5% 5.2% (4.2)% 0.5%
• The residential market in Tanzania has an average rental yield of 5.2%
• Detached units in the high end sector have the highest yields at 7.8% as they charge a premium on rent due to the relatively
low supply given the increasing land prices in their locations
• Apartments in the mid end sector have the highest yields at 7.8% due to their relative affordability for the growing middle class
• Detached units in the low-end sector have a relatively high annual uptake of 53.7% due to their relative affordability. They,
however, have low yields of 3.9% and are thus more suitable for prospective residents as opposed to investors
• The Dar es Salaam real estate sales sector is dominated by public bodies such as NHC and other pension bodies projects who
retain flat prices throughout the sales period thus minimal price appreciation
• In the private sector ddue to the reduced purchasing power in the market, prices have either stagnated or declined indicating
that the market is more suitable for investors who are building to rent as opposed to selling. The average price depreciation in
the market is 4.2% per annum
24VI. Commercial Office Sector 25
Commercial Office Sector: Overview
Fractional sales of office space is a new trend with prices ranging from USD 2,000- 2,400 per SQM

• The Commercial office sector in Tanzania has been on a steady growth path especially as Dar es salaam evolves into one
  of the leading economic hubs in Eastern Africa
• The growth has been supported by an influx of foreign investors in the area from Kenya, South Africa, UK, India and the
  Netherlands mainly in the financial services, gas and tourism sectors
• According to Cytonn Research, office stock in Dar es Salaam stands at approximately 350,000-450,000 SQM, and another
  100,000-150,000 SQM expected to be delivered in 2018/19. Major developments under construction currently include
  Morocco Square, Noble Victoria, Mzizima Towers, 711 and MNF Square

OFFICE SALES
• Fractional sales of office space is a new trend in the market, albeit, with slow uptake mainly due to the high prices
• Sale prices in Dar es Salaam range from USD 2,000- USD 2,400 per SQM which is relatively high compared to Kenya’s
  USD 1,350 per SQM
• For office yield calculations, we used a price of USD 2,400, 2,200 and 2,000 for grades A, B and C,
  respectively

                                                            26
Commercial Office Sector: Key Office Nodes
The key commercial office nodes in Dar es Salaam are the CBD, Masaki, Oysterbay and Kinondoni
KINONDONI
High supply Low to Medium supply
27Commercial Office Sector: Overview
Main Office nodes are CBD, Kinondoni, Masaki, Oysterbay, Mikocheni and Mwenge
CLASSIFICATION
We used the following criteria to classify the office buildings in Dar es Salaam:
A-grade
• These are buildings located in prime locations and have high quality facilities, mechanical and electrical installations
These properties also offer ample parking space and good security. As a result, they attract high end clientele resulting
in high rental rates
B-Grade
• These are properties that have are 10-20 years, have standard finishes, necessary amenities such as security, lifts and
good ample parking space
C-grade
• These are offices in less attractive locations and are older than 20 years. They also lack requisite amenities such as
ample parking space, CCTV and other services such as proper maintenance, landscaping and security
• For the purposes of this research, we classified the primary office nodes in Dar Es Salaam into:
i. CBD; which for the purposes of these research comprises of Upanga, Kisutu, Kivukoni, Ilala and Posta
ii. Kinondoni; comprising of areas along Ali Hassan Mwinyi Road, Bagamoyo Road to the Mwenge intersection
iii. Masaki & Oysterbay
iv. Mwenge & Mikocheni
28Commercial Office Sector: Factors Driving the Sector
Foreign Direct investment and growth of SMEs has led to demand for office space
• Tanzania has been one of the fastest growing countries in Sub-Saharan Africa with a relatively high rate of
Stable
Economic GDP growth averaging at 6.6% between 2012 and 2016. This along with the relatively stable political
Growth climate has made it a suitable investment location
• Foreign direct investments have been on the rise in Tanzania especially in the telecommunications
industry, energy infrastructure as we all as natural gas, resulting in growing demand for grade A & B office
High FDI
spaces. According to EY, the country was the leading FDI recipient in the East Africa region in 2016, with
USD 1.4 bn compared to Kenya’s USD 1.1 bn and Uganda’s USD 541 mn
• Growth of SMEs, especially in the technology, communication and financial sectors, has contributed to a
growing demand for office space
Growth of
SMEs • According to World Bank, Tanzania has more than 30 mn enterprises, contributing 27% of the country’s
GDP. Measures such as the USD 150 mn programme by AFDB is expected to grow local enterprises thus
raising the demand for affordable office space
• Infrastructural development has given impetus to the commercial real estate sector in the region. This is
Infrastructure
largely due to enhanced accessibility in other regions leading to rapid development along major routes
development
such as Bagamoyo, Sam Nujoma and Ali Mwinyi Roads
• Pension funds such as Government Employees Provisional fund (GEPF), Local Authority Pensions Fund
(LAPF) and Public Service Pension Fund (PSPF) have been at the forefront in supplying commercial office
Domestic
funds spaces as they are mandated to invest 30% of their funds in the real estate sector as per Bank of
Tanzania’s guidelines
29Commercial Office Sector: Challenges Facing the Sector
Increasing office stock and the transfer of government operations to Dodoma are straining the performance
of the sector
• Previously, the discovery of natural gas and increased foreign investments resulted in increased office
Increasing stock in Dar es Salaam leading to an estimated office stock of 400,000 SQM. However, recently, effective
Supply
demand has stagnated and is not sufficient to take up the growing supply which is expected to increase
by at least 125,000 SQM in 2018/19
• Frequent congestion and traffic snarl-ups in the Posta, Kisutu and Ilala areas have become a challenge to
investors in these areas as firms are now pushing businesses to other decentralized nodes
Accessibility/ • In addition, some locations such as Mwenge lack the requisite infrastructure hindering growth as opposed
Infrastructure
to areas that are more accessible such as the Kinondoni node which is also served by a BTR station and
thus has higher demand
• Dar Es Salaam has high rental rates with averages of USD 16.1 per SQM, compared to other countries
such as Kenya and Uganda, whose average rental rates are USD 9.8 and 15, respectively. This is partly
attributed to distortion driven by high demand in some areas such as Kinondoni and Masaki as well as the
Rental Rates introduction of VAT on property rents in 2015
• Developers also face high financing costs, especially with high interests rates of up to 26%, which is
passed down to the clients
Transfer of • The transfer of political headquarters and government ministries such as The Ministry of Tourism to
government
operations City Dodoma has resulted in reduced demand for office space in the former capital city leading to a rise in
to Dodoma vacancy rates
30A. Comparables 31
Office Sector Performance by Node - Summary
Kinondoni was the best performing node with rental yields of 7.3%

                      Monthly Rent    Monthly Rent    Monthly Rent Service Charge Service Charge
                         Per SQM         Per SQFT        Per SQFT        per SQM        per SQFT       Occupancy        Rental
Node                         (USD)          (Kshs)           (Tshs)         (USD)          (Kshs)             %        Yield %
Kinondoni                      15.8            161         35,288.4            1.9              18          79.0%        7.3%
Masaki/Oyster Bay              20.4            211         45,562.2            2.6              25          66.3%        7.2%
CBD                            15.9            167         35,511.7            2.3              22          76.0%        6.3%
Mwenge/Mikocheni               11.9            123         26,577.9            2.2              21          60.1%        4.3%
Average                        16.0           165.5        35,288.4            2.2              22          70.4%        6.3%

•     Kinondoni is the best performing node with average rental yields of 7.3%, 1.0% points higher than the market
      average of 6.3%, attributable to good infrastructure, proximity to key upscale neighbourhoods such as Masaki,
      Oysterbay and Msasani Peninsula as well as its proximity to the CBD and the fact that firms are increasingly relocating
      here away from the congestion of the city centre thus raising its occupancy rates
•     Mwenge area has the lowest yields at 4.3% being the node with most grade C office stock thus the lowest rents. In
      addition, firms are increasingly moving to more prime nodes such as Kinondoni thus resulting in lower occupancies at
      60.1%

                                                             32
Office Sector Performance by Grade - Summary
Grade A offices are the best performing with average rental yields of 8.6%
Monthly Rent Monthly Rent Monthly Rent Rental
Grade SQM (USD) Per SQFT (Kshs) Per SQFT (Tshs) Occupancy Yield
A 17.0 193 37,968.5 92.9% 8.6%
B 16.0 186 35,735.0 70.7% 6.7%
C 12.0 135 26,801.3 68.4% 5.2%
Average 15.0 167 33,501.6 72.1% 6.4%
• Grade A offices have the most attractive yields in the market with average yields of 8.6%, 2.2% points higher than the
market average of 6.4%. They also have the highest occupancy rates indicating demand for the same as the incoming
foreign investors demand for top notch quality office stock and the short supply of the same in the market
33VII. Retail Sector 34
Retail Sector: Overview
Tanzania’s retail market has a deal pipeline of at least 84,000 SQM of retail space
• Tanzania’s formal retail activity is centered in Dar es Salaam, the main economic hub of the country
•   As per JLL Dar es Salaam Report 2017, current retail stock stands at 153,000 SQM. The main premium malls are
    Mlimani City Mall, Aura Mall and Mkuki mall
• At least 84,000 SQM is expected to be complete in the next 5 years with malls such as Peninsula Plaza in Masaki, AICC
    Shopping mall and Ngorongoro Towers in Arusha as well as shopping plazas in the upcoming MNF Square and Morocco
    Square in Dar es Salaam
• Other malls in the country include Aim Mall in Arusha and Rock City Mall in Mwanza, measuring 15,454 SQM and 5,000
    SQM, respectively
Classification
• For research and analysis, we classified malls into three categories based on the sizes in square feet and number of
    anchor tenants as shown below:

Type                                                                              Size (SQFT)            No. of Anchors

Regional Center/ Destination                                                          >300,000                        2+

Community Center                                                              100,001 - 299,000                       0-2

Neighborhood Center                                                           50,000 - 100,000                        0-1

                                                             35
Retail Sector: Factors Driving Growth in Dar Es Salaam
Positive demographic dividend and a widening middle class has led to demand for retail space
• Tanzania has one of the highest urbanization rates in the world at 5.0% p.a, compared to a global
average of 2.1% p.a. Additionally, Dar Es Salaam has a relatively high population density at 3,661
persons per SQKM, compared to Kigali and Accra at 1,780 and 2,685, respectively and a generally
Demographics
higher urban population at 32.3% compared to Nairobi’s 26.5% leading to demand for retail stores
such as shopping outlets as well as entertainment joints. Notable outlets include KFC, Sub-Way,
Century Cinemax, Manix stores, Splash, among others
• The growing middle class has led to emergence of prime residential neighborhoods as well as a
Increased growing consumer class which has led to demand for retail outlets across the region. The stable
Consumerism economy, growing at a 5-year average of 6.6% since 2012, has sustained the rate of consumerism
• Wholesale and retail trade has been one of the top drivers of the stable economic growth which has
Foreign given impetus to foreign investors into the sector, such as Game, Splash stores, Choppies, Mr Price,
Investment
Max, Spurr and Century Cinemax
• Tanzania’s internet penetration has gained traction increasing from 12% in 2011 to 36% in 2015,
E-commerce according to the Tanzania Investment Centre thus leading to e-commerce gaining momentum. Main
online shopping sites include Kivuko, Kupatana, Jumia, Kikuu among others
36Performance Summary by Location
Masaki and Oysterbay had the highest yields in the retail sector with an average of 10.9%
Monthly Rent Monthly Rent Monthly Rent Occupancy Rental
Location Per SQM (USD) Per SQFT (Kshs) Per SQFT (Tshs) Rate Yield
Masaki & Oysterbay 20.0 206.7 44,668.8 96.1% 10.9%
Upanga 19.8 205.1 44,222.1 91.9% 10.3%
CBD 17.0 171.6 37,968.5 71.1% 6.9%
Average 18.9 194.5 42,212.0 86.4% 9.4%
• The Masaki and Upanga regions offer the highest retail yields to investors with 10.9%. This is attributable to the high
upper mid end populations as well as expatriates that reside in the neighborhood which drives demand for retail space
37Performance Summary by Classification
Retail sector has average rental yields of 9.3%
Monthly Rent
Monthly Rent Monthly Rent Occupancy Rental
Type Per SQM (USD) Per SQFT (Kshs) Per SQFT (Tshs) Rate Yield
Community 14.7 151.5 32,831.6 85.7% 7.5%
Neighborhood 19.7 204.1 43,998.8 87.0% 9.8%
Regional 39.6 409.8 88,444.2 95.0% 11.1%
Average 19.4 201.1 43,328.7 87.1% 9.4%
• The regional mall has the highest returns in terms of yield with an average of 11.1%, this is due to the high rental rates
it attracts averaging at USD 39-40 per SQM as well as high occupancy rates of 95%
38VIII. Land Sector 39
Land Sector: Overview
Land in Tanzania is owned by the government with leases available to nationals only
Land Ownership
• In Tanzania, all land is owned by the government, and leases are available to nationals only
• Land is divided into 3 categories; general land, village land and reserved land. The Land Act provides for rights of
  occupancy for between 33 years and 99 years for general land and reserved land
• The Village Land Act recognizes the rights of villages to land held collectively by village residents under customary law
• Non-Tanzanians are not allowed to own land, unless for investment purposes
• Under the TIC (Tanzania Investment Centre), a foreigner can be allocated land designated for investment purposes and
  which is already listed, or can look for desirable land owned by a Tanzanian national, and after agreeing on the
  acquisition of such land with the owner, the owner will submit the existing title deed to the Ministry of Lands whereby it
  will be re-issued as a land designated for investment purposes under the name of TIC and thereafter derivative rights
  issued to the investor (foreign entity)
Land Use and Zoning
• The Ministry of Land in Tanzania is mandated to administer land and human settlement
• Zoning regulations are provided by the municipal councils of locations
• In Oysterbay and Masaki areas, for example, the Kinondoni Municipal Council has provided allowance for 1 to 6 floors
  depending on the proximity to the ocean

                                                             40
Land Sector: Prices
The average price per acre in prime residential areas around the CBD is USD 3.4 mn
CBD
Location Year Size Price (USD) Price per SQM Price per Acre (USD) Price per Acre (Kshs) Price per Acre (Tshs)
Upanga 2017 4000 2,238,699 560 2,238,699 231,481,481 5,000,000,000
Upanga 2017 300 250,000 833 3,333,333 344,666,667 7,444,800,000
Upanga East 1700 850,706 500 2,001,660 206,971,678 4,470,588,235
Kivukoni 2018 2900 3,000,000 1,034 4,137,931 427,862,069 9,241,820,690
Average 732 2,927,906 302,745,474 6,539,302,231
Oysterbay& Masaki
Location Year Size Price (USD) Price per SQM Price per Acre (USD) Price per Acre (Kshs) Price per Acre (Tshs)
Masaki 2017 1700 1,700,000 1,000 4,000,000 413,600,000 8,933,760,000
Msasani 2017 1777 1,400,000 788 3,151,379 325,852,560 7,038,415,307
Masaki 2017 800 773,694 967 3,868,472 400,000,000 8,640,000,000
Masaki 2017 2000 1,934,236 967 3,868,472 400,000,000 8,640,000,000
Average 931 3,722,081 384,863,140 8,313,043,827
Victoria
Location Year Size Price (USD) Price per SQM Price per Acre (USD) Price per Acre (Kshs) Price per Acre (Tshs)
Victoria 2016 2800 3,000,000 1,071 4,285,714 443,142,857 9,571,885,714.29
Grand Average 858 3,431,740 354,841,924 7,664,585,550
• For purposes of this research, CBD includes areas like Kisutu, Kivukoni and Upanga. These are the major middle class areas and are
dense with residential apartments, Mixed-Use Developments and commercial properties
• Oysterbay and Masaki are the prime neighbourhoods with high end residential and commercial properties. The price per acre has
increased approximately by a CAGR of 5.6%
• Victoria, is located along the old Bagamoyo Road, one of the major arterial routes and is a major commercial office node also
doubling up as an upper mid end residential area
• Land has the highest price in areas like Victoria, Masaki and Upanga which are mid to high end income areas, have good
infrastructure and are also in close proximity to the coastline and other amenities
41Land Sector: Prices
The average price per acre in areas outside the city is USD 963,508
Bagamoyo Road
Location Year Size Price (USD) Price per SQM Price per Acre (USD) Price per Acre (Kshs) Price per Acre (Tshs)
Mbezi 2017 372 150,000 403 1,612,903 166,774,194 3,602,322,580
Mikocheni 2018 4400 2,978,723 676.98 2,707,930 280,000,000 6,048,000,000
Ali Mwinyi Rd, Mwenge 2017 18000 6,500,000 361 1,444,444 149,355,556 3,226,080,000
Kawe 2017 11200 3,000,000 268 1,071,429 110,785,714 2,392,971,428
Bagamoyo Road 2017 1600 400,000 250 1,000,000 103,400,000 2,233,440,000
Average 392 1,567,341 162,063,093 3,500,562,802
Goba, Mbezi Beach
Location Year Size Price (USD) Price per SQM Price per Acre (USD) Price per Acre (Kshs) Price per Acre (Tshs)
Bunju B 2017 1617 22500 14 22,500 2,326,500 50,252,400
Bagamoyo Rd 2017 * 17,014 4 17,014 1,759,259 38,000,000
Goba, Mbezi Beach 2017 2881 55,000 19 76,362 7,895,869 170,550,781
Average 31,505 12 38,625 3,993,876 86,267,727
Kurasini
Location Year Size Price (USD) Price per SQM Price per Acre (USD) Price per Acre (Kshs) Price per Acre (Tshs)
Kurasini 2017 3350 800,000 239 955,224 98,770,149 2,133,435,223
Kurasini 2017 2090 380,000 182 727,273 75,200,000 1,624,320,000
Average 210 841,248 86,985,075 1,878,877,612
Grand Average 1,430,324 242 963,508 99,626,724 2,151,937,241
• Bagamoyo Road is the major arterial route connecting Mwenge to the city centre and is dotted with grade b and c
office building while Mbezi Beach is one of the leading tourist areas evidenced by the concentrated hotel facilities such
as White Sands, Ramada Resort, Seascape Hotel among others
• In areas around the outskirts of the city centre is USD 963,508 with areas far from the city centre going for as low as
USD 38,625
42IX. Hospitality Sector 43
Hospitality Sector : Trend Analysis
 International arrivals have been growing at an 8.2% CAGR creating demand for hospitality services
                                          Hospitality Sector Performance (Tanzania)
 Factor                                                      2011      2012           2013    2014    2015       2016      2017f 2016/17F
 Accommodation and food services contribution to GDP         1.6%       1.6%          1.5%     1.5%    1.4%      1.4%       1.3%   (0.1)%
 Growth of GDP from Accommodation and food services          4.1%       6.7%          2.8%     2.2%    2.3%      3.7%       2.0%   (1.7)%
 International Visitor arrivals ('000)                        867      1,077          1,096   1,140   1,137      1,284     1,389    8.2%
 Earnings in USD Mns                                        1,353      1,713          1,853   2,006   1,902      2,132     2,300    7.9%

 Hotel Bed Occupancy                                                                          32.9%   30.7%     27.4%      27.8%    0.4%
 Hotel Room Occupancy                                                                         71.0%   66.0%     58.9%      59.8%    0.9%

 • The hospitality sector is growing as seen through the growth in international arrivals by a 6-year CAGR of CAGR of 9.9% while
    earnings have grown by 11.2% during the same period
 • The sector, however, declined in 2015 evidenced by the reduction in international visitor arrivals and reduction in bed occupancy
    from 32.9% to 30.7% . This is because 2015 was an election year in Tanzania and may have resulted in security concerns due to the
    annulment of elections in Zanzibar. In addition, there may have been a spill-over effect of reduced tourist arrivals to Africa due to
    terrorism activities in Kenya and the Ebola pandemic in West Africa that resulted in issuance of negative travel advisories
 • The performance remained low in 2016 due to increased room supply through opening of hotels such as Ramada Encore and
    introduction of VAT to tourism services making Tanzania a more expensive tourism destination
 • The sector however recorded slight improvement in performance in 2017 especially during Q1 and is expected to sustain growth due
    to political stability and government efforts to improve infrastructure

Source: Ministry of Natural Resources and Tourism                       44
Hospitality Sector: Key Drivers
Travel tourism and security are the main drivers of hospitality in Tanzania
Factor Characteristics
• Holiday travelers are they main drivers of Tanzania’s hospitality sector accounting for
78.0% of international arrivals over the last 5-years attracted mostly by key attractions
Travel Tourism
such as wildlife, coastal beaches and mountain climbing. Between 2012 and 2016,
holiday travelers increased by 2.7% to 0.9 mn from 0.8 mn
• Tanzania has enjoyed political and social security in the last few years making it a
Security preferred destination in East Africa compared to countries such as Kenya that suffered
a set back between 2013 and 2015 due to terrorism and negative travel advisories
• The tourism board launched an e-marketing campaign focused on increasing tourism
from markets such as the US, Germany, Italy and the UK
Marketing
• The Board also signed agreements to partner with Mauritius and travel companies in
Germany to increase tourist arrivals to the region
• The Government has been increasing focus on improvement of infrastructure to ease
accessibility and availability of services. These include the construction of Kigamboni
Infrastructure
Bridge easing access to the South Beach, construction of Terminal 3 at Julius Nyerere
Airport to increase the capacity of passengers it can handle
45Hospitality Sector: Challenges
Poor infrastructure at national parks and imposition of VAT on tourism services are the key challenges
Factor Characteristics
• According to the International Visitors Exit Survey report by the TBS, 40% of
Infrastructure international visitors expressed concerns on the conditions of roads and other
infrastructure especially to National Parks and traffic jams to and from the airport
• The Tanzania government in 2016 imposed taxes on tourism services as a means of
Increased Cost of Tourism due to increasing revenues from the sector. This resulted in a drop in the number of tourists
VAT charges visiting due to the increased cost of tourism. However, this may reverse should the
funds be utilized for infrastructural development as intended
• Zanzibar has in the past experienced political instability, e.g. in 2015/16 when the
Political Instability country held a presidential election rerun due to disputed elections, which resulted in
increased caution among tourists leading to a 0.26% decline in international arrivals
46Hospitality Sector: Rooms Supply
Daresalaam region has the highest hotel room supply in Tanzania
Hotel Rooms Regional Distribution
35%
31% 31%
30%
25%
20%
15% 12%
10% 7%
6% 5%
5% 4%
2% 2%
0%
Daresalaam Arusha Dodoma Kilimanjaro Mwanza Tanga Pwani Kigoma Others
• In terms of room supply, Dar es salaam has the highest market share at 31% compared to other regions such as Arusha
and Dodoma at 12% and 7%, respectively
• This is due to its location adjacent to the Indian Ocean, which makes it a key destination for tourists. In addition,
Daresalaam is the main commercial city of Tanzania making it the main address for business travellers
• According to the Ministry of Natural Resources, it has 291 hotels out of a total of 1,424 in the country as at 2016
Source: Ministry of Natural Resources and Tourism 47Hospitality Sector: Performance
Despite a slight decline in 2016, the sector recorded improvement in 2017 reaching 59.8% occupancy
Hotel Room Occupancy 2014-2017 Hotel Bed Occupancy 2014-2017
80.0% 35.0% 32.9%
71.0% 30.7%
70.0% 66.0% 27.8%
30.0% 27.4%
58.9% 59.8%
60.0%
25.0%
50.0%
20.0%
40.0%
15.0%
30.0%
10.0%
20.0%
10.0% 5.0%
0.0% 0.0%
2014 2015 2016 2017f 2014 2015 2016 2017f
• The sector recorded a decline in occupancy in 2016 due to the implementation of unfavourable policies as well as the
increase in room supply through opening of hotels such as Ramada Encore, Hyatt and Ramada Resort in 2015 and 2016
• The slight improvement in 2017 mainly during Q1 indicates sustained demand for hospitality services and is expected to
continue given the governments’ commitment to improve infrastructure, one of the main challenges facing the sector
Source: Ministry of Natural Resources and Tourism, JLL,STR 48X. Summary & Conclusion 49
Summary
The retail sector has the highest yields at 9.4% due to relatively high occupancy and rates
                                      Rent per SQM            Price per SQM              Occupancy                   Rental
Theme                                         (USD)                   (USD)                    Rates                  Yield

Retail Sector                                    20.0                   2,200                   87.1%                  9.4%

Office Sector                                    15.0                   2,200                   72.1%                  6.4%

Residential Sector                                5.3                     902                   79.4%                  5.2%
Hospitality Sector                                                                              59.8%
Average                                                                                        74.6%                  7.0%

• The retail sector has higher returns to investors with an average rental yield of 9.4% compared to commercial office’s
   6.4% and the residential sector at 5.2%. This is due to the high occupancy rates of 87.1%, indicating demand for retail
   space
• The performance of the office sector has recorded increasing vacancy rates due to the exit of multi-nationals, migration
   of government offices to Dodoma and the increasing spaces supply thus relatively lower yields at 6.4% with 72.1%
   occupancy
• The residential sector has seen reduction in rents and prices due to reduced spending power, thus has yields of 5.2% as
   at 2017 and occupancy of 79.4%

  Source: Cytonn Research 2018
                                                            50
Summary
The real estate sector in Dar es Salaam is underperforming compared to other Sub-Saharan cities
Sub-Saharan Africa Cities Dollarized Rental Yields Comparison
14.0% 12.6%
12.0% 10.6% 10.7%
9.9% 10.2%
9.3% 9.4% 9.6% 9.5%
10.0%
7.6%
8.1%
8.0% 6.8% 6.4%
5.2% 5.6%
6.0%
4.0%
2.0%
0.0%
Residential Office Retail
Dar es Salaam Nairobi Kampala Accra Kigali
• In comparison with other cities in Sub-Saharan Africa, Dar es Salaam has low residential and office yields at 5.2% and
6.4%, respectively attributable to the shrinking demand resulting in reduced rents mainly in the residential and office
sector
• The retail sector, however, has relatively competitive yields at 9.4% compared to Kenya’s and Accra’s at 9.6% and 9.5%,
respectively
Source: Cytonn Research 2018 51Recommendation
Our outlook is positive for the retail sector due to sustained demand, negative in the office sector
with expected increase in vacancy rates, and neutral on residential where there are pockets of value
Theme Performance (2017/18) Recommendation/Outlook Area of Focus Outlook
• The office sector has average • The office market is on a declining • Affordable offices/co-working
rental yields of 6.4% with average trend and vacancy rates are likely to stations
occupancy rates of 72.1%. The increase due to i) increasing supply ii) • Investors should seek
Commercial
sector has been largely firms increasingly taking up smaller opportunities in other regions
Office
constrained by increased office office spaces iii) migration of such as Arusha, Dodoma and
stock against stagnated demand government offices to Dodoma Mwanza
• The retail sector has the highest • The formal retail sector is gaining • Good quality community
rental yield at 9.5%, with average traction, with demand being driven by malls in prime areas such as
occupancy rates of 87.1% foreign retailers looking to set up shop Masaki and Upanga, which
Retail
in the region, and consumer’s are densely populated
preference for international brands • Growing cities; Dodoma,
Arusha and Mwanza
• The sector has relatively low • The best performing segment for • Mid-end apartments in areas
rental yields of 5.5% with average rentals is the mid-end apartments with such as Mbezi, Kawe and
occupancy of 79.4%. The sector 7.4% yields and for sales being low-end Mwenge for rent
Residential has been constrained by tight detached units with 54.0% annual • Low-mid end detached units
Sector liquidity in the market and uptake. Demand remains strong for in satellite areas such as
reduced purchasing power low-end affordable housing Kigamboni
• Growing markets such as
Dodoma
• The sector has been growing • Despite the slight decline recorded in • Luxury hotel class
with international arrivals and 2016, the sector is expected to recover developments which have
Hospitality
earnings growing with a 6-yr driven by growth in leisure tourism and low supply in Dar es Salaam
Sector
CAGR of 9.9% and 11.2%, government efforts to improve
respectively infrastructure
52Q&A 53
You can also read