March 2019 November 2016 - AWS
←
→
Page content transcription
If your browser does not render page correctly, please read the page content below

November 2016
March 2019

                        PAGE 0
Disclaimer
This presentation is for informational purposes only and does not constitute an offer to sell, a solicitation of any offer to buy, or a recommendation to purchase any securities of or any
of its affiliates (as such term is defined under the U.S. federal securities laws). The presentation shall not constitute a solicitation of a proxy, consent or authorization with respect to
any securities. This presentation shall also not constitute an offer to sell or the solicitation of an offer to buy any securities, nor shall there be any sale of securities in any jurisdictions
in which such offer, solicitation or sale would be unlawful prior to registration or qualification under the securities laws of any such jurisdiction. No offering of securities shall be made
except by means of a prospectus meeting the requirements of Section 10 of the Securities Act of 1933, as amended.

Forward-Looking Statements
The statements in this presentation that are not historical facts are “forward-looking statements” within the meaning of the safe harbor provisions of the United States Private Securities
Litigation Reform Act of 1995. Forward-looking statements may be identified by the use of words such as “anticipate”, “believe”, “expect”, “estimate”, “project”, “budget”, “forecast”,
“intend”, “plan”, “may”, “will”, “could”, “should”, “predicts”, “potential”, “continue”, and other similar expressions that predict or indicate future events or trends or that are not statements
of historical matters. Such forward-looking statements are based on current expectations, estimates and projections about the industry and markets in which Yatra operates. Yatra’s
beliefs and assumptions are made by its management and are not predictions or guarantees of actual performance. Accordingly, actual results and performance may materially differ
from results or performance expressed or implied by the forward-looking statements. No representation is made as to the reasonableness of the assumptions made within or the
accuracy or completeness of any forward-looking statements or other information contained herein. Factors that could cause future results and performance to differ from the forward-
looking statements include but are not limited to: (1) Yatra’s history of operating losses; (2) competition in the Indian travel industry; (3) declines or disruptions in the Indian economy;
(4) risks relating to any unforeseen liabilities of Yatra;(5) risks related Yatra's recent acquisition of a majority stake in Air Travel Bureau Limited ("ATB") and its ability to complete the
acquisition of ATB's remaining outstanding shares; (6) future capital expenditures, expenses, revenues, earnings, synergies, economic performance, indebtedness, financial condition,
losses and future prospects; businesses and management strategies and the expansion and growth of the operations of Yatra; (7) the limited liquidity and trading of Yatra’s securities;
(8) changes in applicable laws or regulations; (9) the possibility that Yatra may be adversely affected by other economic, business, and/or competitive factors; and (10) other risks and
uncertainties indicated from time to time in Yatra’s filings with the Securities and Exchange Commission (the “SEC”).
Yatra cautions that the foregoing list of factors is not exclusive. Additional information concerning these and other risk factors is contained in Yatra’s most recent filings with the SEC.
All subsequent written and oral forward looking statements or other matters are expressly qualified in their entirety by the cautionary statements above. Yatra cautions readers not to
place undue reliance upon forward looking statements, which speak only as of the date made. Yatra undertakes no obligation to update or revise any forward-looking statements,
whether as a result of new information, future events or otherwise, except as required by law.

Non-IFRS Financial Measures
In addition to the IFRS financial measures, this presentation includes certain non-IFRS financial measures, including Adjusted Revenue, Adjusted EBITDA (Loss), Net Revenue
Margin and Gross Bookings. The non-IFRS measures have limitations as analytical tools and you should not consider them in isolation or as a substitute for an analysis of our results
under IFRS as issued by the IAB. The Company considers these non-IFRS financial measures to be important because they provide useful measures of the operating performance of
the Company, exclusive of unusual events or factors that do not directly affect what we consider to be our core operating performance, and are used by the Company's management
for that purpose. All non-IFRS financial measures are reconciled to their directly comparable IFRS financial measures. These reconciliations are presented in the Appendix at the end
of this presentation.

Industry and Market Data
Industry and market data used in this presentation have been obtained from industry publications and sources as well as from research reports prepared for other purposes. While
Yatra believes such information to be reliable, it has not independently verified the data obtained from these sources.

Other
All years are calendar years unless otherwise noted as “fiscal year” or “FY”.

Yatra Online, Inc.’s financial and operating results for the three months ended Dec 31, 2018 and twelve months ended March 31, 2018 include the financial and operating results of
ATB, for three months and eight months, respectively, in which we acquired a majority stake on August 4, 2017. Accordingly, the reported results for twelve months ended March 31,
2018 which are inclusive of the impact of consolidation of the ATB, may not be comparable with twelve month ended March 31, 2017.

                                                                                                                                                                                               PAGE 1
Key Highlights

   q Yatra is one of the most well recognized “home-grown” Indian Internet brands and the
           largest Corporate Travel Services provider in India.

   q We are well-positioned to benefit from India’s massive and growing travel market that is
           quickly moving online

   q We have a differentiated go-to-market strategy providing an attractive method for end-user
           acquisition across India’s most frequent and highest spending travelers

           ‒      For consumers, our company is synonymous with online travel, serving both leisure and
                  business travelers

           ‒      Our B2E business is India’s largest corporate travel platform

   q Proven and consistent growth driven by disciplined, metrics-focused, execution

           ‒      Adjusted Revenue grew 17% in Q3FY19 over Q3FY181,2

1. Adjusted Revenue as per unaudited results
2. Refer to Appendix for definitions and reconciliations of non-IFRS measures                         PAGE 2
Yatra – A Comprehensive Online Travel Platform
We are India’s 2nd largest B2C OTA and the leader in corporate travel1

                                      Gross Bookings2                                                                                       Adjusted Revenue 2,3
                                        (INR billion)                                                                                           (INR million)

                 CAGR                                                                                                                                                                             2,331
                                           92.5                                                                                CAGR                        7,408                         17%
                  25%                                                  10%                                                                                                       2,000
                                                                                    26.4                                        33%                          697                                  400
                                           13.4
                                                                23.9                                                                                                              192
                        68.0                                                        3.2                                               5,203                1,697                                  483
       58.9                                                      3.5                                                                                                              437
                         10.4                                                                                    4,208                 399
        9.6                                                                                                       270                 1,147
                                                                                                                 1,061
                                           79.2
                                                                                   23.2                                                                    5,013
                         57.6                                   20.4                                                                                                             1,370           1,448
      49.3                                                                                                                            3,657
                                                                                                                 2,877

      FY16              FY17               FY18               Q3FY18             Q3FY19                           FY16                 FY17                 FY18                Q3FY18          Q3FY19

                                     Air             Hotels                                                                           Air            Hotels              Others (Inc. Other Income)

     9.2mm                             77mm                                108k+                                    72%                                82%                               800
     cumulative                            Visits5                        hotels in                        of transactions                            of traffic                     large
     customers4                                                        1,300+ cities6                       from repeat                                 from                       corporate
                                                                                                             customers5                               mobile7                     customers8
1.   Management estimates
2.   Numbers for FY18 include ATB performance for 8 months; Q3FY18 and Q3FY19 include ATB performance for 3 months
3.   FY numbers are as per audited results; Quarterly numbers are as per unaudited results; Refer to Appendix for definitions and reconciliations of non-IFRS measures
4.   Cumulative as of Dec 31, 2018; does not include data for B2B2C businesses
5.   Data for the three months ended Dec 2018 for flagship brand Yatra.com only and excludes data from B2E and B2B2C businesses
6.   As of Dec 31, 2018
7.   Data for the three months ended Dec 31, 2018
8.   Approximate count as of Jan 31, 2018 and includes corporate customers of ATB                                                                                                                       PAGE 3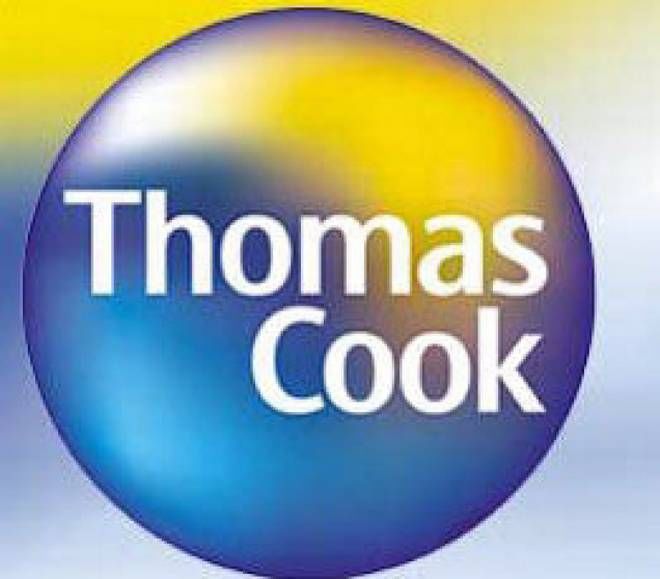
Our Differentiated Go-To-Market Strategy
 While other Indian OTAs focus mainly on the B2C segment, we deliver a full suite of leisure
 and corporate offering that enables us to target travelers holistically

                                                                                 The                    Platform

                  1 B2C                                                                              2 B2E                                                          3         B2B2C
                                                                               Focus on the “right demographics”                                 Leverage our platform to profitably
 Leverage our brand and business
                                                                               - the business traveler, India’s main                            gain scale and address tier 2 and tier
footprint to grow our B2C business
                                                                                         consuming class                                                     3 markets

                   ~$19Bn                                                                            ~$32Bn                                                         ~62%
          Consumer travel industry                                                           Corporate travel industry                                          Offline consumer
                market1                                                                              market4                                                     travel market7

                     ~38%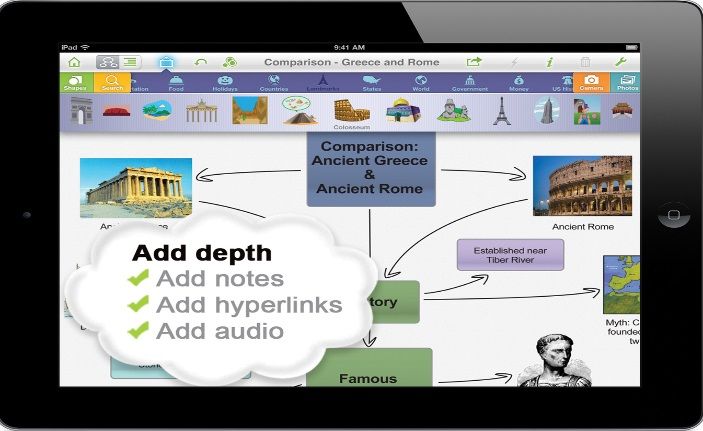
Our Opportunity
The “Big Picture” – Still Early Days

                                                                                         China                            India                    China 2016
            GDP per capita (USD)                                                  2005         $1,7661             2016           $1,7171            $8,1161

            Organized retail penetration                                          1999         ~10%2               2016            ~9%3                  20%4

            Online shoppers                                                       2010         185m5               2016           130m6                  521m6

            Spend per online buyer (USD)                                          2007           $1352             2016           $1086              $1,7177

            Internet penetration                                                  2008           23%2              2016            30%3                  53%7

            Smartphone penetration                                                2010           13%2              2016            19%6                  68%8

      Revenues9                                                   GDP per capita1         Revenues9                                                 GDP per capita1
                                                                                  Revenue
      5,000                                                                  10
                                                                                   CAGR:
                                                                                          800                                                                  10 Revenue
                                                                                                                                                                    CAGR:
       4,000                                                                        8    48%                                                                         8   105%
                                                                                                  600
       3,000                                                                        6                                                       IPO                      6
                     IPO                                                                          400
       2,000                                                                        4                                                                                4
       1,000                                                                        2             200
                                                                                                                                                                     2
             0                                                                      0               0                                                                0
                 2002       2005        2008        2011        2014        2017                            2010     2011     2012        2013    2014     2015 10

                                              China GDP per capita (USD ‘000)                            Ctrip and Qunar revenues (USD million)

1. Source: CountryEconomy.com
2. Source: Credit Suisse Equity Research. India Internet Primer #2, August 2015
3. Source: RedSeer, July and October 2017
4. Source: Business Standard, February 2015
5. Source: BBC, August 2011
6. Source: Statista, 2018
7. Source: E Marketer, February and April 2017
8. Source: Pew Research Centre. Represents % of adults who report owning a smartphone
9. Source: FactSet and company filings
10. Qunar.com was acquired by Ocean Management on October 2016
                                                                                                                                                                                PAGE 6
India is The Fastest Growing Global Economy
Economy driven by a young population with a median age of 28 years1
                                                       India’s GDP growth is expected to top other economies1
                                                            (GDP Annual % change, average 2017E – 2020E)
                                                              7.6%
                                                                              6.4%

                                                                                              2.0%    1.7%        1.6%

                                                              India           China            U.S.   Brazil      Russia

                            Internet users2 (million)                                                              Smartphone penetration rate3

     53%
                                                                                                                                                      69%
     739
    739
                                                 xx%      % of Population
                    34%                                                                                                              52%      55%
                                                                                                                             50%
                   462
                                   88%                                                                              38%
                                   287
                                                  66%             94%            76%
                                                                                                           22%
                                                  139             118            110

  China            India           US            Brazil         Japan          Russia                     India     Brazil   Japan   China   Russia   US

1. Source: Phocuswright, International Monetary Fund, World Economic Outlook Database, October 2017
2. Source: Internetworldstats.com (June 2017)
3. Source: newzoo Global Mobile Market Report (April 2017)                                                                                                  PAGE 7
Overall travel market in India estimated at ~INR 3,400 Bn
(~$51Bn) in FY17; corporate travel accounts for ~60-65%
                India Travel Market –By Gross Bookings                                               Split by Customer Segment
                                   (INR billion)1                5,760                                            (%)1
                                                                ($85 bn)            Category
                             CAGR 14%                             2%                 CAGR
                                                        5,030    14%
                                                         2%                Others    12%                   35-            39-
                                          4,400         14%      10%                                       40%
                                            2%                                                                            43%
           3,390          3,860
                                           14%          11%                Cab       14%
          ($51Bn)           2%                                   21%
            2%             14%             12%
            14%                                         22%
                           13%                                             Rail
            14%                            22%                                        5%
                            22%
            23%                                                                                            60-            57-
                                                                 53%
                                                                           Hotels    12%                   65%            61%
                                                        51%
                                           50%
            47%            48%
                                                                           Air       18%

           2017            2018            2019         2021     2022                                      2017           2021

       Key Drivers                                                                                         Corporate      Leisure

       • Infrastructure development: Govt. is planning to build 150 new airports by 2020
       • Economic growth: India’s projected 7-8% GDP growth to improve per capita & disposable income
       • Favorable demographics: Urban middle class, with growing wealth & increasing travel needs to reach 450 Mn mark by 2030
       • Policy initiatives: E-Visa scheme to expand from 43 to 150 countries
       • Price-competitive destination: India remains an affordable tourism destination and its relevance as a business travel
         destination is increasing

1) Source: Research done by Strategy& for the company                                                                               PAGE 8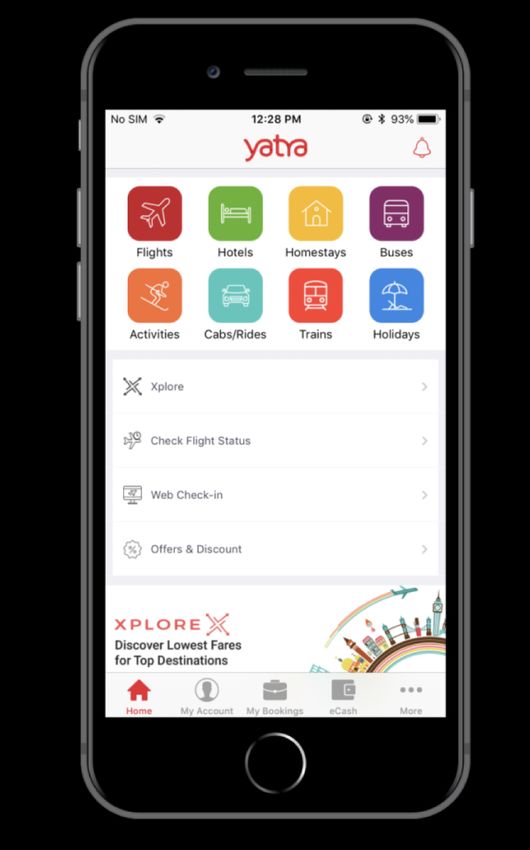
Corporate travel market in India is ~INR 2,150 Bn
  (~$32Bn) growing at 12% CAGR
            India Corp Travel Market Gross Bookings (INR billion)1                 Market split by product1
                                                                                                                       Margin %
                                                                3,430
                            CAGR:12%                                                        5-                Others    >10%
                                                        3,050   ($51Bn)                    10%
                                          2,690
                                                                                           25-
                         2,360                                                             35%
        2,150
                                                                                                              Hotels    5-12%
       ($32Bn)

                                                                                           50-
                                                                                           60%                Air       4-6%

         2017             2018            2019          2020     2021                      2017

                          • GDP growth: IMF projected ~7% growth rate in GDP, implying higher business activity, and related travel
      Demand
       side               • GST implementation: ~10mil companies in India with registered GSTIN - greater scope for organized TMCs
                          • Growth in MICE: High margin (~20%) & high demand frequency; expected growth in off-sites, dealer meets

                           • Improved hotel supply for corporates: Increase in number of chain hotels and some OTT players such as
       Supply
                             Treebo focusing on the corporate market have organized hotel supply
        side
                           • Improved connectivity: 22% more airport pairs to operate in 2018; ~200 new railway lines in progress

        New                • Growth in leisure travel at corporate rates:
Highly fragmented market shifting towards online &
organized segment – Top 13k companies account for 28% of volume
Corporate Travel Market – Travel Spend >INR 10 mil1 Corporate Travel Market – Type of Player
~INR 2,150 Bn ~INR 650 Bn (%)
($9.5Bn) Major Players
($32Bn)
Industry – Travel
spend % of revenue
28%
Highly
28% IT – 3.0%
fragmented Supplier Large
market Engineering – 1.1% Direct, TMCs,
9% Pharma – 1.9% 30% 10%
Energy - 0.2%
1% 8% Finance - 0.4%
2%
1% Auto - 0.6% Small
6%
69% BPO/ITeS – 3.5% Travel
5% Agents,
4% Telecom – 0.6% 60%
2017 4% Others – 0.6%
Travel Spend (in INR) 3%
>50 mil 10-30 mil 30-50 mil 32% 2017
INR 10 mil, IT has 28% share followed by Engineering & Pharma
• ~1,900 companies across these eight industries account for ~70% share
• IT, BPO/ITeS, & Pharma industries have higher travel spend as % of revenue (between 2-3%)
• Direct bookings are primarily for air travel (SMEs) & hotel bookings (SMEs and corporates)
• Yatra has the largest share amongst the organised players
1) Source: Research done by Strategy& for the company PAGE 10Consumer Market shifting towards online with OTA share
growing the fastest
Consumer Travel Market – Online v/s Offline1 Market split by Channel1
CAGR %
Offline 6%
61% 55%
Offline Online Offline Online
61% 39% 55% 45%
OTA 16%
23%
18%
Supplier Direct 9%
21% 21% -Online
2017 2021
2017 2021
Market split by Channel and Product1
47% 48% 43%
51%
67% Offline
77%
2%
1% 97% 96%
OTA
32% 34%
51% 56%
27% Supplier Direct -
18% Online
17% 19%
5% 5% 0%
3% 0%
4%
2017 2021 2017 2021 2017 2021 2017 2021
Air Hotels Rail Car Rental
1) Phocuswright; Online Travel in India: 10th Edition (2017) PAGE 11India Air Travel – Significant Growth and Corresponding
Investments
Demographics, government policy, and an improved investment environment are driving
travel related growth, especially in Tier 2 and Tier 3 cities1
Airplanes / Airlines Air Passenger Growth
India air travel passengers by year3
Current Airline fleet and orders2
(million)
172 430 164.6 Y-o-Y
Dom Intl
120 225
11%
140.2 25.5
58 205
120.0 23.0
37 128
176
20.1
21 56
19%
18 42 139.1
117.2
5 7 99.9
3 18
3
1
CY16 CY17 CY18
Current: 614
On Order: 1,111
1. Tiers based on Indian Government House Rent Allowance (HRA) categories
2. Source: Company reports and press articles
3. Source: Directorate General of Civil Aviation PAGE 12India Hotel Market – Strong Growth and Shift to Online
Booking
Indian lodging market continues to grow1 Online hotel bookings – still “early days”
(USD billion) (Online percentage of gross bookings, 2017E)1
Total Hotel Bookings Total Online Bookings
CAGR 11.7
10%
52%
49%
7.9
CAGR
20% 23%
3.8
1.8
2017E 2021E 2017E 2021E Hotel Rail Air
1. Source: Phocuswright PAGE 13The Corporate Traveler Market – Our Perspective
A market opportunity that is ~1.7x larger than the leisure market, is the world’s fastest growing
and enables us to serve the most attractive consumers
India’s Corporate Travel Industry Growth Rate of Top 15 Corporate Travel
($ billion)1 Markets (2016-2020)2
Consumer Corporate
51 12%
GR
CA %
12 Top 15 Global
Average 6% Average
.7x 8% 8%
~1 32 7% 5%
6% 6%
5% 5% 5% 5% 5%
4%
19 3% 3% 3%
a
e
a
A
in
l
n
K
s
y
a
ly
na
ea
l ia
zi
di
nd
si
ad
an
pa
nc
U
S
Ita
pa
ra
tra
hi
or
us
In
U
rl a
a
m
Ja
an
B
C
S
.K
us
Fr
R
er
he
C
S
2017E 2017E 2020E
A
G
et
N
India’s Urban Population by Income Class3
Socio-economic Segment and Size (mm) Annual Income
A1 5 $30,000–35,000
A2 21 $10,000–15,000
A3 32 $4,000–5,000
B1 36 $3,000–3,500
B2 43 $2,500–3,000
C1 54 $2,000–2,500
C2 49 $1,500–2,000
D 108 $1,000–1,500
E 72 >$1,000
1. Strategy& analysis
2. KPMG & FCM Travel Report accessed from Travelbizmonitor.com
3. Urban population estimate of 420 million per Internet and Mobile Association of India (IAMI). Socio-economic classification (SEC) breakdown per the Market Research Society of India. Distribution of SEC A1-E segments
per MRSI applied to IAMI estimate of 420 million users to arrive to socio-economic segment size. Approximations based on Income not directly correlated to socio segmentation hence proxies of income distribution used
to estimate the approximate avg. income. PAGE 14Yatra Business Overview
Our Differentiated Approach – A Common Platform
Seamlessly Linking All Channels, Products, and
Customers
Rewards program connecting business and leisure travelers

      Multi-channel                                                                                                                        Complete
     customer access                                                                                                                       offerings

       Direct-to-consumer
                                                                                                                                                 Air
              “B2C”                                                                                                                      8 Domestic carriers
              ~77m visits1 ;
                                                                                                                                      300+ International carriers
            ~9.2m customers2

                                                                                                                                       Hotels & Lodging
       Corporate travelers                                                                                                             108K+ Indian properties4
                                                                                                                                       plus growing homestays
            “B2E”
      Corporate customers have
         ~4.2m employees3

                                                                                                                                       Holiday packages

            Travel agents
              “B2B2C”
          ~23,000+ registered                                                                                                         Rail, bus, activities,
          agents across India4                                                                                                               others

1.   Data for the three months ended Dec 31, 2018 for flagship brand Yatra.com only and excludes data from B2E and B2B2C businesses
2.   Cumulative as of Dec 31, 2018; does not include data for B2B2C businesses
3.   Approximate count as of Dec 31, 2018 and includes the employees of corporate customers of ATB
4.   Approximate count as of Dec 31, 2018                                                                                                                           PAGE 16
We Are One of The Leading Consumer Brands in
India
Our foundation is built on customers’ trust and loyalty
National Tourism Award 3 times
• Strong and improving direct and organic I
traffic dynamics – up 10% in Q3FY19
versus Q3FY182 L
• Strong overall traffic– total visits l
Most Trusted Travel Brand 2 times 1 77mm in Q3FY19 L
• Overall customer growth3 24% –
9.2mm cumulative customers4
1. Awarded by The Economic Times for the year 2015 and 2016
2. For flagship brand Yatra.com only
3. YOY Growth in customer base from Q3FY18 to Q3FY19 and does not include data for B2B2C businesses
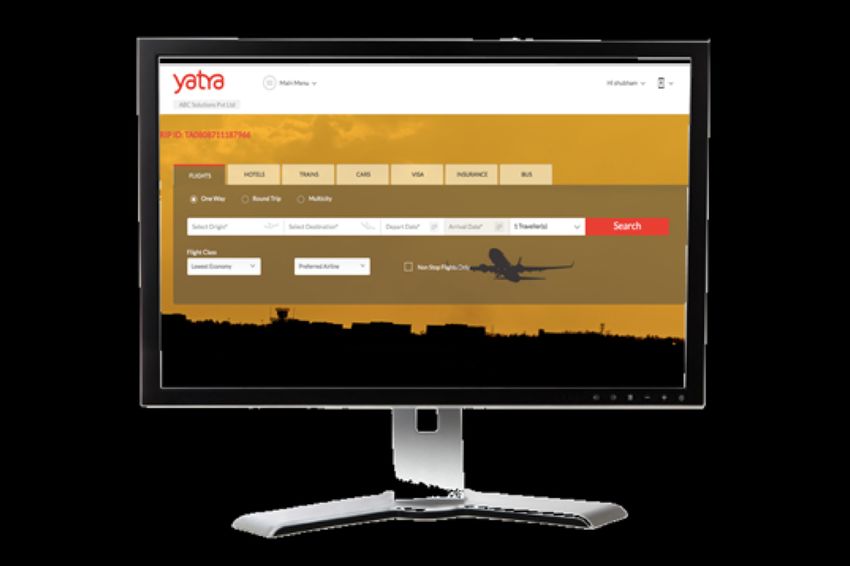
4. Approximate cumulative customers as of Dec 31, 2018 and does not include data for B2B2C businesses PAGE 17Innovation – A Comprehensive Mobile and Web Offering
Only travel app in India with voice enabled flight search and book process
“YUVA” – Voice & text AI
- customers can book on
the go
(Google Assistant)
“Travel Talk” –
Share Personal
experiences
A suite of offerings across Mobile & Desktop platforms
PAGE 18We are Delivering a “Mobile-First” Experience!1
Our common technology platform supports a user-friendly, multi-app environment
Yatra’s native app downloads (million)2 16.9
16.1
15.3
14.1
12.7
10.6
9.7
8.8
6.9 7.6
5.4 6.1
4.3
3.3
1.4 2.0
0.6
Jun -14 Sep -14 De c-14 Mar-1 5 Jun -15 Sep -15 De c-15 Mar-1 6 Jun -16 Sep -16 De c-16 Mar-1 7 Jun -17 Sep -17 De c-17 Mar-1 8 Jun -18 Sep -18 De c-18
Traffic Mix – PC vs. mobile3
82%4
18%4
Mobile Desktop
Jun -14 Sep -14 De c-14 Mar-1 5 Jun -15 Sep -15 De c-15 Mar-1 6 Jun -16 Sep -16 De c-16 Mar-1 7 Jun -17 Sep -17 De c-17 Mar-1 8 Jun -18 Sep -18 De c-18
47% Air bookings and 47% Hotel bookings made using Mobile5
1. Relates to B2C
2. Includes Yatra main app
3. Data for flagship brand Yatra.com only
4. Data for three months ended Dec 2018
5. % of Online Bookings for the period Oct’18- Dec’18 for flagship brand Yatra.com only and excludes data from B2E and B2B2C businesses
PAGE 19Choice – We Have a Differentiated Strategy in Hotels
We believe Yatra has India’s largest hotel inventory, especially in the key “budget” category
in Tier 2 and Tier 3 cities
Yatra’s 108k+ units by market segment1,2,3 Key elements of Yatra’s hotel strategy
l Target segment: Focus on Tier 2 and Tier 3 cities
101k+ hotels
l Marketing: Avoid creating “artificial” demand through
discounting; building supply that better matches consumer
Yatra's budget hotels
price points
Competition
~55k hotels2 74.5k Yatra's mid-segment
hotels
l Marketplace strategy: Rolling out a marketplace in Hotels
Yatra's premium
hotels
& Packages to leverage Yatra’s extensive network
l Investment in on-the-ground presence and a dedicated
30.6k
technology platform to support suppliers
3.1k
l Demand: Growth from cross selling to customers, deeper
Largest penetration in “budget” category penetration in the B2E segment
1. Management estimates, as of Dec 31, 2018
2. Management estimates from company websites, press articles, and filings
3. Includes ~13,500 homestay accommodations
PAGE 20Our Loyalty Program
Rewarding customers & driving conversion of corporate travelers to our consumer offerings
• Over ~4.7 million registered
• Specifically for frequent travelers
eCash customers1
• ~73,000 enrolled members1 since
• Earn and Burn across products 72% transactions
launch in Feb’18
on Yatra platform
from repeat
customers2 in • Special Member benefits
• Helps drive cross sell and Q3FY19 § Free cancellation up to Rs.10,000
stickiness per year
§ Spend linked rewards
• In a fragmented supplier
§ Dedicated priority service desk
environment acts as a strong
value add
1. Approximate count as of Dec 31, 2018
2. Data for the period Oct’18- Dec’18 for flagship brand Yatra.com only and excludes data from B2E and B2B2C businesses PAGE 21Yatra for Business – Largest Corporate Travel Platform
in India
l Over 8,000 large corporations
Large Market
l Over 100,000 SMEs
Opportunity l 60%+ of India’s travel spend
l Largest player in the country
Market Leader l ~800 large corporate customers1
l ~14,000 SME customers in 9 months since launch2
l Comprehensive Self Book Platform
Differentiated l Integrates seamlessly into ERP/ HRIS systems of customers
Offering
l Manages complex approval processes and ensures tight policy compliance
l Opportunity to manage customers’ hotel and lodging programs
Multiple Revenue l Opportunity to provide expense management solutions
Opportunities
l Other services like insurance, car rental, forex, travel visas etc.
Cross Sell – l 4.2mm people employed by organizations – supporting household of ~17mm travelers3
‘Bleisure’ l Using eCash to drive cross sell
1. Approximate count as of Jan 31, 2018 and includes corporate customers of ATB
2. Approximate count as of Dec 31, 2018
3. Assumes a family size of 4; 4.2 mm people employed by corporate customers of Yatra and ATB as of 30 Dec 2018 PAGE 22Yatra for Business – Comprehensive Self Book Platform
1 Available across devices and platforms – leveraging “Consumer” UX
2 Enhanced capability to manage complex approval processes and enforce
policy compliance
3 Tightly Integrates with Corporate’s ERP and HRIS systems
PAGE 23Yatra ‘SMART’ – Lodging Services at Standardized
Pricing
Target 150,000 rooms across 6,000 properties in 300+ cities primarily focused towards
corporates
Service Offerings
‘SMART’ Features
Hotel Amenities
• Standardized pricing INR 999/-
onwards (1499/-, 1999/-, 2499 / ,
2999/-) • Physical Audit process – service
• Money back guarantee level control
• Priority helpline • Special rates for Yatra SMART
• GST compliant voucher corporates Free Cancellation Complementary Wifi
• Alliance vouchers • 1,000+ Hotels with internal Yatra
‘SMART’ branding1
• Properties not associated with
other budget chains Hot / Cold Shower AC / backup Bottled Water
DTH
Security/ CCTV Restaurant / Room Service
1. Proposed to be done
PAGE 24New Business Travel Opportunity – Expense
Management Solutions
Ensuring seamless reporting, approval and disbursals of travel expenses
Expense Management Solutions
1 Tie up with
2 Multi year Exclusive Tie up for India
3 Integrated within the Yatra App/ Employee
Desktop
Expense Report
Disbursal
4 Deep Integration with client systems
5 Differentiated Product offering - make
in-roads into non-Yatra customers
Finance Manager
PAGE 25B2B2C – Building an O2O Platform
As the largest Omni channel travel company in India with an agent base of 23,000+ covering 500+ cities and towns
across India, we are uniquely positioned to capitalize on the O2O market opportunity
~25mil Online Shoppers
on Yatra/Month1
2.0% to 5.0%
Online Buyers2
Connecting
Non-online
Buyers to 20,000+
Local Agents
83 percent of Indians
and 90 percent in
smaller towns -- prefer
cash as a method of
payment3
Helps connect
customers
with agents
in their neighborhood
1. Approximate shopper visits as of Dec 2018 2. According to management estimates 3. Press articles PAGE 26The Path Forward – Investing in Sustainable Growth
Technology Brand
l Voice enabled booking l Further strengthen brand,
l AI based tools for customer especially in Tier 2,Tier 3 cities
service l Promote ‘Yatra for Business’
l Corporate self booking platform brand
l Employee transport management l Drive high quality app downloads
app
Sustainable Growth
Category 4
Loyalty Y4B Yatra for Business
l Multi tier Loyalty Program l Expand SME footprint
§ Continue to drive eCash adoption and l Scale up expense management
use cases e.g. Partnership with Ola solution
§ Expand platinum customer base
PAGE 27Our Team – A Track Record of Innovation
Years in
Name and title Background Shared Experience
travel industry
Dhruv Shringi l Experience: Ebookers.com, Ford Motors, 15
Co-Founder and Arthur Anderson
CEO l Education: MBA - INSEAD, Chartered Accountant Travel
Industry
Manish Amin l Experience: Ebookers.com 32
Co-Founder & l Education: Btech National and Business Management –
CIO and CTO South Thames College, London
Online
Product
Alok Vaish l Experience: HSIL Ltd., Deutsche Bank 11
CFO l Education: MBA - Darden School of Business,
Chartered Accountant
Internet
Sharat Dhall l Experience: Trip Advisor India, Hindustan Unilever 11 Technologies
COO – B2C l Education: MBA - XLRI Jamshedpur, BITS Pilani
Akash Poddar l Experience: Travel Boutique Online, Triburg Sportswear, 11 Operational
COO – B2B2C Indorama Synthetics Discipline
l Education: MBA - Thunderbird School of Management
Sunny Sodhi l Experience: Carlson Wagonlit, HRG Sita 22
COO – B2E l Education: Bcom (Hons) Delhi University, Diploma in Public Company
Hotel Management and Tourism Experience
PAGE 28Yatra Financial
OverviewRecapping Our Q3 FY19 Results
Delivered strong growth across all key parameters, mobile traffic exceeded desktop traffic1
15% ~32% 19%
Growth in mobile app Growth in Hotel Room Nights
Growth in net transactions2
install base5 Booked
26% ~47% 8%
Growth in transacting Growth in Air Passengers
Air Bookings from Mobile6
customers3 Booked
17% ~47% (36)%
Hotel Bookings from Mobile6 Growth in holiday
Growth in Adjusted Revenue4
packages passengers travelled
1. Growth rates represent YoY growth from Q3FY18 to Q3FY19
2. Excludes Cab transactions
3. Data for B2C and B2E business
4. Quarterly adjusted revenue is as per unaudited results; Refer to Appendix for definitions and reconciliations of non-IFRS measures
5. For Yatra main app
6. % of Online Bookings for flagship brand Yatra.com only and excludes data from B2E and B2B2C businesses PAGE 30Our Financial Performance – Strong Growth
Our growth has been driven by consistent bookings growth
l Adjusted Revenue1 grew by 16.6% in Q3FY19
l Adjusted EBITDA1 losses of INR 154.3 million ($2.2 million)2
Gross Bookings1 Adjusted Revenue 1
(INR billion) (INR million)
10% 26.4 7,408
92.5 2,331
CAGR 17%
CAGR 23.9 33%
25%
68.0 5,203 2,000
58.9
4,208
FY16 FY17 FY18 Q3FY18 Q3FY19 FY16 FY17 FY18 Q3FY18 Q3FY19
1. Quarterly numbers for Adjusted Revenue and adjusted EBITDA are as per unaudited results; FY numbers for Adjusted Revenue and Adjusted EBITDA are as per audited results; Refer to Appendix for
definitions and reconciliations of non-IFRS measures; Numbers for FY18 include ATB performance for 8 months; Q3FY18 and Q3FY19 include ATB performance for 3 months
2. Converted into U.S. dollars at the exchange rate of 69.58 INR per USD
PAGE 31Our Air Bookings Business
Gross Bookings1,2 Air Passengers Booked1,2
(INR million) (‘000s)
79,156
CAGR 27% CAGR 25% 8,875
57,562 6,869
49,269 5,698
13% 23,190 8%
20,449 2,308 2,487
FY16 FY17 FY18 Q3FY18 Q3FY19 FY16 FY17 FY18 Q3FY18 Q3FY19
Adjusted Revenue1,2
(INR million)
5,013
CAGR 32%
3,657
2,877
6%
1,370 1,448
FY16 FY17 FY18 Q3FY18 Q3FY19
1. Numbers for FY18 include ATB performance for 8 months; Q3FY18 and Q3FY19 include ATB performance for 3 months
2. Quarterly numbers as per unaudited results; FY numbers as per audited results; Refer to Appendix for definitions and reconciliations of non-IFRS measures
PAGE 32Hotels and Packages Business – Steady Growth
Gross Bookings1,2 Room Nights Booked1,2
(INR million) (‘000s)
13,386
CAGR 18% 2,098
CAGR 36%
10,436
9,614
1,383
1,139
(8%)
19%
3,488 3,210 600
504
FY16 FY17 FY18 Q3FY18 Q3FY19 FY16 FY17 FY18 Q3FY18 Q3FY19
Adjusted Revenue 1,2
(INR million)
1,697
CAGR 26%
1,147
1,061
10%
437 483
FY16 FY17 FY18 Q3FY18 Q3FY19
1. Numbers for FY18 include ATB performance for 8 months; Q3FY18 and Q3FY19 include ATB performance for 3 months
2. Quarterly numbers as per unaudited results; FY numbers as per audited results; Refer to Appendix for definitions and reconciliations of non-IFRS measures
PAGE 33Track record of healthy Take Rates
Our take rate is driven by overall business mix, industry trends, and the expansion of our
hotels and packages business
Total Net Revenue Margin1,2,3,4
Change in
7.6% 7.9% Business mix
7.1% 6.9% 6.6%
FY16 FY17 FY18 Q3FY18 Q3FY19
Hotels and Packages Net Revenue Margin1,2,3 Air Ticketing Net Revenue Margin1,2,3
15.1% Q3FY19 Mix1,2,5
12.7%
12.5%
11.0% 11.0% Others Change in
17%
8%Others
Business mix
Hotels Air
& Ticketing 6.4% 6.3% 6.7%
H&P
Packages 5.8% 6.2%
68%
25%
21%
Air 62%
FY16 FY17 FY18 Q3FY18 Q3FY19
FY16 FY17 FY18 Q3FY18 Q3FY19
1. Refer to Appendix for definitions and reconciliations of non-IFRS measures
2. Net revenue Margin and Adjusted Revenue are as per unaudited results for quarterly numbers and as per audited results for FY numbers; Numbers for FY18 include ATB performance for 8 months; Q3FY18 and
Q3FY19 include ATB performance for 3 months
3. Net Revenue Margin refers to Adjusted Revenue divided by Gross Bookings
4. This excludes the effect of Gross Bookings and Adjusted Revenue associated with others segment
5. Q3FY19 mix of Adjusted Revenue PAGE 34Change in business mix and marketing efficiency
driving operating leverage
Major operating expenses1 (INR Million, % of Adjusted Revenue)
Improvement: 60%
Adjusted EBITDA (Loss) – INR Mil (388) (154)
Improvement: 66%
Adjusted EBITDA Margin (19%) (7%)
39%
Other Operating 34%
Expenses2
Marketing and 52%
consumer promotion3 48%
29% 24%
4
Personnel Expenses
Q3FY18 Q3FY19
1. 3 months numbers are as per unaudited results and include ATB performance for 3 months
2. Excludes one time expenses in relation to Re-measurement of contingent consideration
3. Includes Customer promotional expenses
4. Excludes Employee share based compensation expenses
PAGE 35In Conclusion
Targeting a Massive and Proven
Rapidly Growing Market Track Record of
Execution
ü ü
17% YoY
Growth1
Widely Recognized
ü ü ü India’s
Indian Consumer Brand Leading Multi-
Channel OTA
Market-Leading3
Corporate Travel
Provider
Economic Times Brand Equity’s
Most Trusted Brand2 Addressing Highly
Desirable Customer
Corporate Travel Represents A Base
~2x Larger Opportunity Than
The Consumer Market3
1. Q3FY18 versus Q3FY19 Adjusted Revenue
2. The Economic Times Brand Equity’s Most Trusted Brand Survey 2016
3. According to management estimates
PAGE 36Appendix
Basis of Financial Presentation and Use of
Non-IFRS Measures
The historical financial information regarding Yatra included in this investor presentation reflects Yatra’s fiscal year end of March 31, and has been derived from
audited financial statements of Yatra and its subsidiaries that were prepared in accordance with International Financial Reporting Standards, or IFRS as issued by
IASB, on a consolidated basis.
This presentation presents the metrics Adjusted Revenue, Adjusted EBITDA Losses, and Net Revenue Margin, which are non-IFRS measures. The presentation of
these non-IFRS measures, which are defined below, is not meant to be considered in isolation or as a substitute for Yatra’s consolidated financial results prepared
in accordance with IFRS as issued by the IASB and included in the previous filings with SEC. The non-IFRS financial metrics may not be comparable to similarly
titled measures reported by other companies due to potential differences in the method of calculation. A reconciliation of these non-IFRS measures to the most
comparable IFRS metric is set forth in this Appendix.
Description of Adjusted Revenue : As certain parts of Yatra’s revenue are recognized on a “net” basis and other parts of revenue are recognized on a “gross”
basis, Yatra evaluates its financial performance based on Adjusted Revenue, which is a non-IFRS measure. Adjusted Revenue represents revenue and other
income after deducting service costs and adding back expenses related to consumer promotions and loyalty program costs that had been reduced from revenue
due to the adoption of new accounting standard, IFRS 15, effective from April 1, 2018.
Yatra believes that Adjusted Revenue provides investors with useful supplemental information about the financial performance of Yatra’s business and more
accurately reflects the value addition of the travel services that Yatra provides to its customers. The presentation of this non-IFRS information is not meant to be
considered in isolation or as a substitute for Yatra’s consolidated financial results prepared in accordance with IFRS as issued by the IASB. Yatra’s Adjusted
Revenue may not be comparable to similarly titled measures reported by other companies due to potential differences in the method of calculation. This Appendix
reconciles Yatra’s revenue, which is an IFRS measure, to Adjusted Revenue, which is a non-IFRS measure.
Description of Adjusted EBITDA: In addition to referring to Adjusted Revenue, we also refer to Adjusted EBITDA (Loss). We use financial statements that
exclude employee share-based compensation cost, listing and related expenses, depreciation and amortization and change in fair value of warrants for our internal
management reporting, budgeting and decision making purposes, including comparing our operating results to that of our competitors. Because of varying available
valuation methodologies and subjective assumptions that companies can use when adopting IFRS 2 “Share based payment”, management believes that providing
non-IFRS financial measures that exclude such expenses allows investors to make additional comparisons between our operating results and those of other
companies. Accordingly, we believe that adjusted EBITDA (loss) is useful in measuring the results of our company and provide investors and analysts a more
accurate representation of our operating results. However, the presentation of these non-IFRS measures are not meant to be considered in isolation or as a
substitute for our consolidated financial results prepared in accordance with IFRS as issued by the IASB. These non-IFRS measures may not be comparable to
similarly titled measures reported by other companies due to potential differences in the method of calculation. The IFRS measures most directly comparable to
adjusted EBITDA (loss) is Profit/(loss) for the period as per IFRS. A limitation of using Adjusted EBITDA (Loss) as against using the measures in accordance with
IFRS as issued by the IASB are that these non-IFRS financial measures exclude share-based compensation cost, listing and related expenses, depreciation and
amortization, change in fair value of warrants, Share of loss of joint venture, Finance income, Finance costs and Income-Tax. Management compensates for this
limitation by providing specific information on the IFRS amounts excluded from Profit/(loss) for the period as per IFRS.
Description of Net Revenue Margin: Net Revenue Margin is defined as Adjusted Revenue as a percentage of Gross Bookings and represent the commissions,
fees, incentive payments and other amounts earned in our business. We follow Net Revenue Margin trends closely across our various lines of business to gain
insight into the performance of our various businesses.
Description of Gross Bookings: This presentation also uses the operating metric “Gross Bookings” which represents the total amount paid by our customers for
the travel services and products booked through us, including taxes, fees and other charges, and are net of cancellations and refunds.
All years are calendar years unless otherwise noted as “fiscal year” or “FY”.

                                                                                                                                                                 PAGE 38
Reconciliation of Non-IFRS Measures-
Adjusted Revenue
Air ticketing
Amount in INR million
Fiscal Year Ended Mar’31, 3 Months Ended Dec’ 31,
2016 2017 2018 2017 2018
Revenue 2,877 3,657 5,013 1,370 842
Customer promotional expenses - - - - 606
Service cost - - - - -
Adjusted Revenue 2,877 3,657 5,013 1,370 1,448
Hotel and Packages
Revenue 5,225 5,326 6,628 1,840 1080
Customer promotional expenses - - - - 340
Service cost (4,164) (4,179) (4,931) (1,403) (936)
Adjusted Revenue 1,061 1,147 1,697 437 483
Others
Revenue 243 373 607 150 283
Customer promotional expenses - - - - 15
Service cost - - - - -
Adjusted Revenue 243 373 607 150 298
Total
Revenue 8,345 9,357 12,249 3,360 2,205
Customer promotional expenses - - - - 961
Service cost (4,164) (4,179) (4,931) (1,403) (936)
Other Income 27 25 90 42 102
Adjusted Revenue 4,208 5,203 7,408 2,000 2,331
Notes- 3 months numbers are as per unaudited results; FY numbers are as per audited results; Numbers for FY18 include ATB performance for 8 months; Q3FY18 and Q3FY19 include ATB performance for
3 months PAGE 39Reconciliation of Non-IFRS Measures- Adjusted EBITDA (Loss)1 INR million FY16 FY17 FY18 Q3FY18 Q3FY19 Profit/(loss) for the period as per IFRS (1,243) (5,937) (4,052) (232) (138) Employee share-based compensation costs 19 587 730 132 34 Depreciation and Amortization 234 276 426 111 138 Share of loss of joint venture 12 9 11 4 3 Finance income (95) (139) (92) (17) (12) Finance costs 112 150 153 71 62 Change in fair value of warrants 3 (230) 563 (938) (529) Listing and related expense 0 4,243 0 - - Remeasurement of contingent consideration 0 0 294 - - Income-Tax 7 41 57 18 12 Adjusted EBITDA (Loss) (952) (1,001) (1,910) (388) (154) Notes- 3 months numbers are as per unaudited results; FY numbers are as per audited results; Numbers for FY18 include ATB performance for 8 months; Q3FY18 and Q3FY19 include ATB performance for 3 months PAGE 40
You can also read