Strategies at points of entry to reduce importation risk of COVID-19 cases and reopen travel - Oxford Academic Journals
←
→
Page content transcription
If your browser does not render page correctly, please read the page content below
Journal of Travel Medicine, 2020, 1–8
                                                                                                                                           doi: 10.1093/jtm/taaa141
                                                                                                                                                    Original Article

Original Article

Strategies at points of entry to reduce importation

                                                                                                                                                                          Downloaded from https://academic.oup.com/jtm/advance-article/doi/10.1093/jtm/taaa141/5897021 by guest on 26 October 2020
risk of COVID-19 cases and reopen travel
Borame L Dickens , PhD1, Joel R Koo, BSc1, Jue Tao Lim, MSc1, Haoyang Sun, BSc1,
Hannah E Clapham, PhD1, Annelies Wilder-Smith MD2,3 , and Alex R Cook, PhD1,*
1 Saw Swee Hock School of Public Health, National University of Singapore and National University Health System, 1E Kent

Ridge Rd, Singapore 117549, 2 Department of Disease Control, London School of Hygiene & Tropical Medicine, Keppel St,
Bloomsbury, London WC1E 7HT, UK and 3 Heidelberg Institute of Global Health, University of Heidelberg, Im Neuenheimer
Feld 365, R. 004, 69120 Heidelberg, Germany

*To whom correspondence should be addressed. Email: ephcar@nus.edu.sg
Submitted 28 July 2020; Revised 13 August 2020; Editorial Decision 20 August 2020; Accepted 20 August 2020

Abstract
Background: With more countries exiting lockdown, public health safety requires screening measures at inter-
national travel entry points that can prevent the reintroduction or importation of the severe acute respiratory
syndrome-related coronavirus-2. Here, we estimate the number of cases captured, quarantining days averted and
secondary cases expected to occur with screening interventions.
Methods: To estimate active case exportation risk from 153 countries with recorded coronavirus disease-2019
cases and deaths, we created a simple data-driven framework to calculate the number of infectious and upcoming
infectious individuals out of 100 000 000 potential travellers from each country, and assessed six importation risk
reduction strategies; Strategy 1 (S1) has no screening on entry, S2 tests all travellers and isolates test-positives
where those who test negative at 7 days are permitted entry, S3 the equivalent but for a 14 day period, S4
quarantines all travellers for 7 days where all are subsequently permitted entry, S5 the equivalent for 14 days and
S6 the testing of all travellers and prevention of entry for those who test positive.
Results: The average reduction in case importation across countries relative to S1 is 90.2% for S2, 91.7% for S3,
55.4% for S4, 91.2% for S5 and 77.2% for S6. An average of 79.6% of infected travellers are infectious upon arrival.
For the top 100 exporting countries, an 88.2% average reduction in secondary cases is expected through S2 with the
7-day isolation of test-positives, increasing to 92.1% for S3 for 14-day isolation. A substantially smaller reduction of
30.0% is expected for 7-day all traveller quarantining, increasing to 84.3% for 14-day all traveller quarantining.
Conclusions: The testing and isolation of test-positives should be implemented provided good testing practices are
in place. If testing is not feasible, quarantining for a minimum of 14 days is recommended with strict adherence
measures in place.
Key words: Lockdown, travel restrictions, border measures, SARS-CoV-2, quarantine, isolation, air passengers

Introduction
                                                                                       originated, had a major positive impact on reducing further
The coronavirus disease-2019 (COVID-19) pandemic has                                   spread within China and beyond11,12 where a clear correlation
resulted in a global cessation of almost all cross-border travel                       was observed pre-lockdown between travel volume and
where the public health implications and economic impact are                           subsequent seeding of epidemics elsewhere.10 The accompanying
unprecedented relative to other emerging infectious disease epi-                       travel restrictions during lockdown have contributed towards
demics.1–10 The lockdown in Wuhan, China, where severe acute                           epidemic containment with estimations in early February of
respiratory syndrome–related coronavirus-2 (SARS-CoV-2)                                a 77% reduction in imported cases from mainland China to

© International Society of Travel Medicine 2020.
This is an Open Access article distributed under the terms of the Creative Commons Attribution Non-Commercial License (http://creativecommons.org/licenses/by-nc/4.0/),
which permits non-commercial re-use, distribution, and reproduction in any medium, provided the original work is properly cited. For commercial re-use, please contact
journals.permissions@oup.com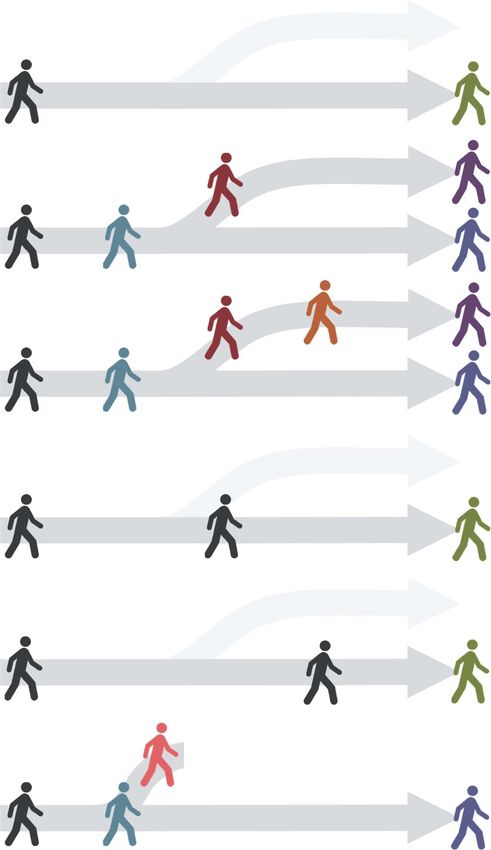
2                                                                                                             Journal of Travel Medicine

other countries13 an 81.3% reduction in case exportation on            Methods
average.14 In Australia, modelling showed that a full travel ban       To estimate the number of arrivals from 153 countries with
reduced cases by 86%, whilst the impact of a partial lifting of the    recorded COVID-19 cases and deaths, we created a simple data-
ban was minimal,15 demonstrating the need for strict compliance        driven framework that calculates the number of infected people
of no entry at borders. This however is unsustainable in the           travelling based on the modelled time of infection and time dif-
medium to long term as the SARS-CoV-2 outbreak continues               ference to entry. As countries have different epidemic trajectories,
to spread globally, making travel bans a delay strategy and not        they pose different risks of case exportation and are assessed
preventative, which has been previously observed by the World          separately. At arrival points, the effects of six strategies are
Health Organization who did not recommend their long-term              explored in their efficacy to preventing the importation of cases.
use for global pandemics due to the severe economic impacts

                                                                                                                                               Downloaded from https://academic.oup.com/jtm/advance-article/doi/10.1093/jtm/taaa141/5897021 by guest on 26 October 2020
caused.16,17 Pressure is thus increasing on countries to lift travel
restrictions and implement alternative control measures at their
                                                                       Simulating the number of infected individuals
borders, which includes screening.18,19
    Many countries are additionally emerging from lockdowns,           We simulate arrivals from a country of origin, C, calculating
which have successfully suppressed outbreaks or reduced the            risks per 100 000 travellers in 1000 simulations to accommo-
epidemic size in multiple countries,20 and to avoid further lock-      date uncertain travel volumes. The conditional distribution of
downs from recurring or new outbreaks, the risk of case impor-         importation at different stages of infection is obtained from
tation or exportation should be minimized. Case exportation            these 100 000 000 simulated travellers. Those who were infected
risk has been previously explored which identified Thailand,           but not yet recovered were extracted for further modelling. The
Japan, South Korea and Singapore as high-risk countries for case       amount of secondary transmission over their infected lifespan
importation from mainland China due to high traffic volumes            was then apportioned into transmission potential before arrival,
in the early phase of the epidemic21 but the global epidemic           during quarantine or isolation if any, and in the community.
has and continues to rapidly evolve. Several studies have since        Quarantine and isolation measures were assumed to take place in
shown that a 3–6% proportion of air passengers were SARS-              a designated healthcare facility or centre where transmission risk
CoV-2 positive during the height of the COVID-19 outbreaks in          is reduced to negligible levels, or at home with strict adherence
Europe22,23 where the infectiousness24 and high estimated asymp-       where any family members present are also expected to follow
tomatic rates25,26 of SARS-CoV-2 have now left few countries or        the same measures.
territories unaffected. Heterogeneity in the efficacy of ongoing           We assumed travellers were administered a polymerase chain
control measures,20 adherence and public perceptions of risk27         reaction (PCR) test upon arrival and estimated the likelihood
and implementation times28,29 have however caused remarkably           of identifying each positive infection using a binomial distri-
different outbreaks and by extension exportation risks. Gaining        bution where the probability of detection was a function of
understanding of importation risk therefore requires ongoing           their time from illness onset (symptom onset for those who are
global and country-specific assessments to identify which coun-        symptomatic and time of expected symptom onset for those who
tries are at high risk of case exportation.                            are asymptomatic) using data from Xiao et al.31 (Fig. 1a). PCR
    Especially critical for high-risk countries, screening measures    sensitivity was assumed to be 85% for 2 days pre-illness onset,
can be utilized to ensure infected travellers are no longer            similar to sensitivity 2 days post-illness onset, and infections
infectious when they enter the local population, thereby               were undetectable at any earlier point during the incubation
ensuring public safety whilst encouraging economic growth and          period. Asymptomatic individuals were assumed to follow the
protecting livelihoods. For countries with strained capacities         same detection profile as symptomatic individuals.
in healthcare resources and limited incoming travel, such as               For a country of origin C and travel dateT assumed to be
those identified by Gilbert in the African continent,30 screening      23rd July 2020, we simulated the incidence of infection among
measures can be highly beneficial, if successfully implemented,        100 000 000 travellers that (i) occurred prior to T, (i) were not
on the wider healthcare system by identifying imported cases           admitted to hospital, and (iii) did not become non-infectious
and preventing ongoing community spread. Additionally, for             prior to T. To obtain estimates of the daily number of infections
countries with relatively suppressed epidemics from lockdown           in C, we utilized daily incidence and death data being published
or post-lockdown strategies in place, identifying cases on entry       by the Center for Systems Science and Engineering at Johns
saves the need for more immense contact tracing efforts which          Hopkins University32 across 153 countries from 22nd January
are both time-consuming and expensive, and reduces the risk of         to 6th August 2020.
continued virus reintroduction.                                            To estimate condition (1), we first simulated the time of
    Such implementation of present or future screening at entry        infection (tiIC ) for each individual i reported to have died at time
points requires the exploration of different strategies with corre-    tiDC in country C using estimates from Linton et al.18 of the
sponding estimates of their relative success in capturing infec-       distribution of time of illness onset to death (ωi for individual
tions to be informative to policymakers. We therefore outline          i) and incubation period (bi ) using the following relationship:
a method to quantify the risk of case exportation from 153
countries or territories per 100 000 travellers in 1000 simula-                               tiIC = tiDC − ωi − bi ,
tions under six risk-mitigation strategies. In these strategies, we
explore the use of isolation of test-positives and quarantining of     where ωi and bi were given log-normal distributions with mean
all travellers for 7 and 14 days, and estimate the number of cases     and standard deviation 20.2d and 11.6d for ωi and 5.6d and
captured, quarantining days averted and secondary cases which          3.9d for bi (Fig. 1b, c). All cases, regardless of symptom profile,
occur from missed importations allowed entry.                          were assumed to have the same illness onset and incubation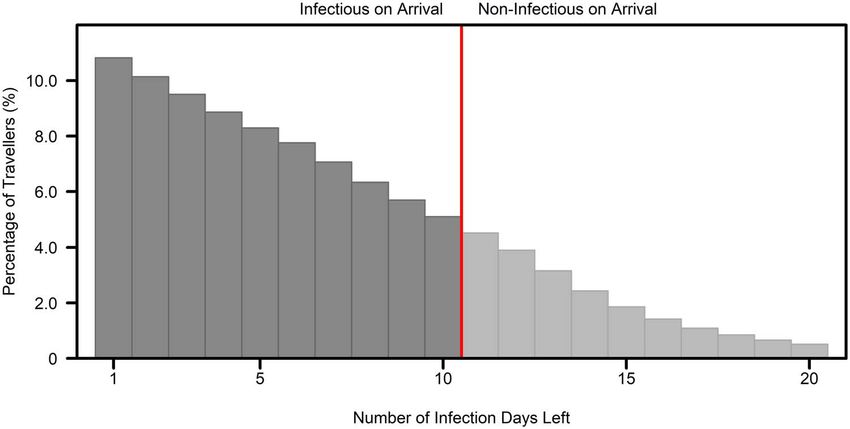
Journal of Travel Medicine                                                                                                                            3

                                                                                                                                                           Downloaded from https://academic.oup.com/jtm/advance-article/doi/10.1093/jtm/taaa141/5897021 by guest on 26 October 2020
Figure 1. (a) The sensitivity of the PCR test over time. (b) The distributions used to estimate the number of infection days from illness onset to death
and (c) from infection time to illness onset. (d) The distribution used for time to admission for cases that are hospitalised in the country of origin

period distributions where asymptomatic individuals did not                    (2) Screening of all incoming travellers on arrival and 7-day
show symptoms.                                                                     isolation for test-positive travellers, with release into the
    For condition (2), we used {tiIC } to estimate the number of                   community only with a negative test thereafter,
symptomatic and asymptomatic incident infections each day,                     (3) Screening with 14-day isolation of test-positives followed by
assuming the case and infection fatality ratio (CFR and IFR)                       a negative test,
estimates derived by Russell et al.33 at 1.2% and 0.6% to be                   (4) No screening of travellers but a 7-day mandatory quaran-
similar to those in each country of origin. Hence, we approxi-                     tine for all,
mated the total number of incident infections in country C in two              (5) No screening but 14 days of quarantine and
categories, symptomatic (SC                            C
                           t ) and asymptomatic (At ), at time                 (6) Screening of all passengers and entry prohibited for those
t as.                                                                              testing positive.

                                                                                  Strategy 1 serves as a baseline of no testing or quarantining
                           ∼    1   IC
                                                                              where all individuals enter unconfirmed as to whether they are
                      SC
                       t   =       I ti = t ,
                               CFR                                            infected (Fig. 2). Strategy 2 assumes that testing occurs upon
                                    i
                                                                              entry where individuals testing positive are isolated for 7 days
and.                                                                          and those who test negative are allowed entry. Those who test
                                                                         positive are only allowed entry once they are confirmed to be
                  ∼        1     1
               AC
                t =           −       I tiIC = t.                             negative with a subsequent test on day 7. Strategy 3 is the
                          IFR   CFR
                                          i                                   equivalent of Strategy 2 but isolation occurs over 14 days for
                                                                              individuals testing positive who then receive a second test on day
for I(), the indicator function. A symptomatic patient may visit
                                                                              14. For Strategy 4, all individuals are quarantined for 7 days, and
a healthcare facility, determined by the simulated date of i’s
                                                                              for 14 days in Strategy 5. For Strategy 6, all travellers are tested
hospital admission (tiHC ), also based on estimates from Linton
                                                                              and individuals testing positive are denied entry.
et al.34 with a corresponding log-normal distribution (Fig. 1d).
                                                                                  We summated the number of travellers at the point of entry
A random subset of the simulated symptomatic population was
                                                                              or release from isolation or quarantine who were infectious or
then removed each day based on the country’s reported case
                                                                              infected (and infectious later), depending on the strategy. We also
count, leaving the remaining as mildly symptomatic and able to
                                                                              calculated the number of quarantine days, defined as days spent
travel at T.
                                                                              at a quarantine facility or similar setting with minimal risk of
    For condition (3), we compared the date of entry T to the
                                                                              infection to others) in all strategies, and measured the differences
date of clearance defined as the simulated reported date or first
                                                                              between Strategy 2 and 4, and Strategy 3 and 5, representing the
day of symptoms with an additional 10-day infectious period.
                                                                              time spent in a facility between isolation and quarantine methods
Based on the control strategies, a proportion of infected people
                                                                              for 7 and 14 days. The number of secondary cases was lastly
are expected to clear infection whilst under isolation or quaran-
                                                                              calculated for each individual as the proportion of infectious days
tining, or will be permitted entry whilst infectious or infected and
                                                                              remaining out of the total 10 days of potentially active infection
not infectious yet.
                                                                              after the Strategy was implemented (release at day of entry, 7 days
                                                                              or 14 days) multiplied by 2, which is the assumed R0 .
Proposed Strategies
The six strategies are explored (Fig. 2) as follows:                          Results
(1) No screening—entry is allowed for all incoming travellers                 The 10 countries with the highest risk are presented where
    from the source country,                                                  notable epidemics or surges in cases are being reported (Fig. 3; a
4 Journal of Travel Medicine
Downloaded from https://academic.oup.com/jtm/advance-article/doi/10.1093/jtm/taaa141/5897021 by guest on 26 October 2020
Figure 2. Depiction of scenarios (S1–S6) and outcomes, which are labelled and colour coded. Individuals who land or receive no testing measures
in Strategy 1, 4 and 5 are displayed as (1) in dark grey. Individuals who land and are tested in Strategy 2, 3 and 6 are presented as (2) in blue and
those who are tested positive and quarantined for at least 7 days are shown as (3) in red. For Strategy 3, individuals who are tested and remain
quarantined until 14 days are represented as (4) in orange. For Strategy 6, individuals who are denied entry when tested upon landing are presented
as (5) in pink. Dark grey routes represent active pathways on arrival and light grey signify inactive routes where no testing is conducted. A dotted
line signifies the denial of entry up to that timepoint or complete denial of entry for Strategy 6. For Strategy 4 and 5, quarantine measures are in
place at 7 days and 14 days, respectively, and for Strategy 2 and 3, isolation measures are in place for those who test positive. At the end time point,
individuals who tested positive and have been cleared (purple), tested negative (dark blue) and are unconfirmed (green) are presentedJournal of Travel Medicine 5
Downloaded from https://academic.oup.com/jtm/advance-article/doi/10.1093/jtm/taaa141/5897021 by guest on 26 October 2020
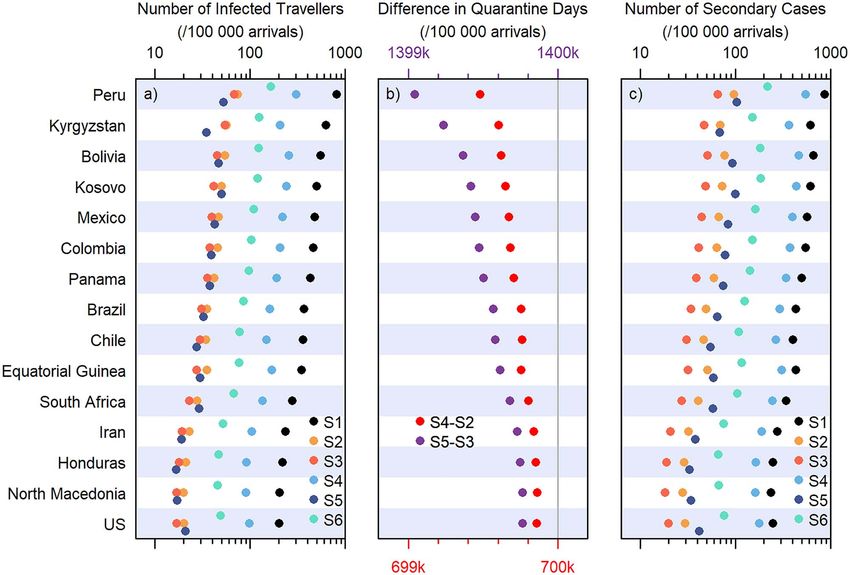
Figure 3. (a) The estimated number of infected travellers per 100 000 arrivals from countries of origin on a logarithmic scale, (b) the differences in
quarantine days between Strategy 2 (7 day isolation) and Strategy 4 (7 day quarantine), and Strategy 3 (14 day isolation) and Strategy 5 (14 day
quarantine) and (c) the number of secondary cases estimated to occur as individuals are permitted entry according to the travellers’ infectious time
remaining
complete list of all countries is available in Appendix 1 in Supple- infectious time remaining, 24.9% from 4 to 6 days, 24.2% from
mentary data available at JTM online). Relative to allowing all 7 to 10 days, and the remaining becoming infectious on arrival.
travellers in unchecked (Strategy 1; Fig. 3a), testing and isolating If transmissibility is similar for travellers and the general public,
reduces case importation numbers by an average of 90.2% for then for an R0 of 2 in July 2020, a no-screening or quarantine
7 days (Strategy 2) and by 91.7% for 14 days of isolation for policy would lead to 250 secondary cases per 100 000 travellers
test-positives (Strategy 3). Declining to test and using quarantine from the USA, 433 from Brazil and 105 from the UK, but as
instead reduces case importation by 55.4% for 7 days (Strategy few as two from Japan and five from Germany (Figure 3c and
4) and by 91.2% for 14 days of quarantine (Strategy 5). Pro- Appendix 1 in Supplementary data available at JTM online). For
hibiting test positives from entry with no quarantining reduces testing and 7-day isolation (Strategy 2) in the top 100 exporting
transmission by 77.2% (Strategy 6). The testing and isolation of countries, on average an 88.2% (86.9–89.4%) reduction in
positive individuals for 7 days substantially reduces importation secondary cases in the destination country is expected; this would
risk, and the requirement of a negative test prior to release from increase to 92.1% (91.5–92.8%) for 14-day quarantine. For 7-
isolation increases the effectiveness compared to quarantine of day quarantine without testing, a smaller reduction of 30.0%
the same length without testing. At 14-day quarantining, the (24.1–40.5%) is expected. For 14-day quarantine without test-
effects of testing and/or quarantining are comparable as the ing, an 84.3% (78.4–88.8%) reduction is estimated, which is
substantial majority of travellers are no longer infectious. The lower in efficacy than with testing, as an average of 6.4% of
isolation of test-positive travellers rather than quarantining all travellers become infectious 14 days or more after arrival that
100 000 travellers for 14 days however notably reduces total may be captured through testing at Day 14 (Strategy 3).
quarantine days for Brazil’s travellers by 1 399 564 days per
100 000, 1 399 897 days for the UK and 1 399 763 days for the
USA (Fig. 3b and Appendix 1 in Supplementary data available at
Discussion
JTM online), which brings economic savings whilst minimizing Our results support a policy of testing arriving passengers from
importation risk. countries with ongoing transmission, followed by isolation until
An average of 79.6% of infected travellers are infectious on an individual is identified as having cleared the infection and
arrival (Fig. 4), with an estimated 30.5% having 1 to 3 days of is no longer infectious. This strategy would reduce risk to a6 Journal of Travel Medicine
Downloaded from https://academic.oup.com/jtm/advance-article/doi/10.1093/jtm/taaa141/5897021 by guest on 26 October 2020
Figure 4. The number of infection days left shown as a proportion among travellers arriving. Those who are infectious on arrival are in dark grey,
and those who are not infectious yet are in light grey
level that would permit necessary business and leisure travel to for 14 days may be more feasible to implement over the
continue with test-trace-and-isolate programmes, thus detecting conducting of rigorous and repeated testing of incoming
additional infections that were missed at the border. travellers. The location for quarantine, whether it is home
Strategy 1, or no control, is not recommended as although or institutional, will also likely impact the efficacy of the
travel restrictions may not act as a primary control measure, proposed screening strategies39 and will depend on each
screening can prevent the entry of infectious and upcoming country’s ongoing control measures in place. For countries
infectious travellers, which would otherwise require extensive with good testing practices for travellers in place, the testing of
contact tracing efforts and counteract ongoing control mea- travellers remains an effective strategy in reducing importation
sures to maintain low levels of infection. Strategy 4 is also not risk, and substantially negates the risk of community spread
recommended as it is relatively ineffective and implements the occurring from potential non-compliance of quarantining
quarantining of all travellers, which is expected to heavily impact measures among travellers. Testing also substantially reduces
even resource rich countries. Strategy 6, although more effective, the number of quarantining days among travellers by over
allows for the importation of individuals who are early in their 1 399 000 days for 14-day quarantining. Countries should thus
infection and not yet detectable using PCR, which is assumed to assess whether testing or 14-day quarantining is viable and cost-
be 3 days before illness onset in this analysis. effective, considering their own policies and access to testing or
Strategy 2 tackles this issue by isolating test-positives until quarantining facilities. Where testing practices cannot maintain
they present a negative result, only allowing the entry of poten- high case-finding rates as the sensitivity of the testing measures
tially infected and infectious people through test failure, which is reduced by a factor describing improper test handling, further
is relatively low provided test practices are robust. Strategy 3 is country-specific analyses will be required to ascertain whether
more effective than Strategy 2 as test-positive individuals are kept the quarantining of all travellers may be unavoidable (Appendix
in isolation until a minimum of 14 days where a greater pro- 2 in Supplementary data available at JTM online; Strategy 2
portion have cleared the infection and are no longer infectious. and 3 show a diminished reduction of 73.6% and 75.6% in
Where quarantining facility space is severely limited or long- an alternate scenario where the global PCR sensitivity profile is
term adherence is poor when individuals are quarantined at their reduced by 75%).
home location, which may also expose their household members Several challenges exist however in our estimations moving
to infection, utilizing a minimal 7-day isolation period for test- forward, requiring the ascertaining of PCR test sensitivity as a
positives remains a viable option. The usefulness of testing is function of the whole infection period and asymptomatic status,
shown for 7-day interventions with a 34.8% increase in caught considerations of country-specific test practices and examining
infected travellers from Strategy 2 and 4 (90.2% vs 55.4%) of the actual proportions of travellers who are likely to travel
where all traveller quarantining is substantially less effective. between countries that remains a significant current unknown.
The extension of isolation days to a minimum of 14 days with Political concerns should also be accounted for where the limited
and without testing has a difference of 0.5% (Strategy 3 and 5; entry of travellers in Strategy 6 who are returning to their
91.7% vs 91.2%), which is a relatively minor saving. In contrast, home country after long periods of stay abroad may not be
without testing, the extension of quarantining of all travellers feasible and dependent on country-specific entry policies. The
from 7 days to 14 days without testing is critical, increasing the use of immunity passports19 ,40 or similar certification could
efficacy of the screening measure by 35.8% (Strategy 4 and 5; help mitigate such ethical issues and relieve resource use for
55.4% vs 91.2%). testing and quarantining should the traveller be confirmed to
With ongoing concerns of false-negative rates in PCR have been previously positive, or a vaccine become available.
testing,35 ,36 strained test kit availability37 and lack of trained Their use however requires a better understanding of the dynam-
manpower and laboratories,38 the quarantining of all travellers ics of waning immunity and test sensitivity over time. Lastly,Journal of Travel Medicine 7
country-specific estimates will require continued updating where 14. Wells CR et al. Impact of international travel and border
the same analysis at different time points (Appendix 3 in Sup- control measures on the global spread of the novel 2019
plementary data available at JTM online; equivalent of Fig. 3 coronavirus outbreak. Proc Natl Acad Sci U S A 2020; 117:
carried out on 28 June 2020) will show countries moving ranks 7504–9.
15. Costantino V, Heslop DJ, MacIntyre CR. The effectiveness of full
according to their ongoing reported case numbers and deaths,
and partial travel bans against COVID-19 spread in Australia for
although the relative efficacies of the strategies explored are
travellers from China during and after the epidemic peak in China.
expected to remain largely the same.
J Travel Med 2020; 27:taaa081. doi: 10.1093/jtm/taaa081.
16. Mateus AL, Otete HE, Beck CR, Dolan GP, Nguyen-Van-Tam JS.
Supplementary data Effectiveness of travel restrictions in the rapid containment of human
influenza: a systematic review. Bull World Health Organ 2014;
Downloaded from https://academic.oup.com/jtm/advance-article/doi/10.1093/jtm/taaa141/5897021 by guest on 26 October 2020
Supplementary data mentioned in the text are available to sub- 92:868–880D.
scribers in JTMEDI online. 17. Vaidya R, Herten-Crabb A, Spencer J, Moon S, Lillywhite L. Travel
restrictions and infectious disease outbreaks. J Travel Med 2020;
27:taaa050.
Funding 18. Wilson ME, Chen LH. Re-starting travel in the era of COVID-19:
The work was supported by funding from Singapore’s National preparing anew. J Travel Med 2020; 27:taaa108. doi: 10.1093/jtm/-
Medical Research Council through grants COVID19RF-004 and taaa108.
NMRC/CG/C026/2017_NUHS. 19. Chen LH, Freedman DO, Visser LG. COVID-19 immunity passport
to ease travel restrictions? J Travel Med 2020; 27:taaa085. doi:
10.1093/jtm/taaa085.
Conflict of interest 20. Islam N et al. Physical distancing interventions and incidence of
coronavirus disease 2019: natural experiment in 149 countries. BMJ
None declared. 2020; 370:m2743. doi: 10.1136/bmj.m2743.
21. Bogoch II et al. Potential for global spread of a novel coronavirus
from China. J Travel Med 2020; 27:taaa011.
References 22. Lytras T et al. High prevalence of SARS-CoV-2 infection in repatri-
1. Tuite AR, Watts AG, Khan K, Bogoch II. Ebola virus outbreak in ation flights to Greece from three European countries. J Travel Med
north Kivu and Ituri provinces, Democratic Republic of Congo, and 2020; 27:taaa054.
the potential for further transmission through commercial air travel. 23. Wong J et al. High proportion of asymptomatic and presymptomatic
J Travel Med 2019; 26:taz063. COVID-19 infections in air passengers to Brunei. J Travel Med 2020;
2. Wilder-Smith A, Chang CR, Leong WY. Zika in travellers 1947– taaa066. doi: 10.1093/jtm/taaa066.
2017: a systematic review. J Travel Med 2018; 25. doi: 10.1093/jt- 24. Jing Q-L et al. Household secondary attack rate of COVID-19
m/tay044. and associated determinants in Guangzhou, China: a retrospective
3. Angelo KM et al. The rise in travel-associated measles infections— cohort study. Lancet Infect Dis 2020; S1473-3099(20)30471-0. doi:
GeoSentinel, 2015–2019. J Travel Med 2019; 26:taz046. 10.1016/S1473-3099(20)30471-0.
4. Redondo-Bravo L et al. Imported dengue in Spain: a nationwide 25. Oran DP, Topol EJ. Prevalence of asymptomatic SARS-CoV-2 infec-
analysis with predictive time series analyses. J Travel Med 2019; tion: a narrative review. Ann Intern Med 2020; 173:362–7. doi:
26:taz072. 10.7326/M20-3012.
5. Shanks GD. Could Ross River virus be the next Zika? J Travel Med 26. Mizumoto K, Kagaya K, Zarebski A, Chowell G. Estimating the
2019; 26:taz003. asymptomatic proportion of coronavirus disease 2019 (COVID-19)
6. Hamer DH, Chen LH. Zika in Angola and India. J Travel Med 2019; cases on board the diamond princess cruise ship, Yokohama, Japan,
26:taz012. 2020. Eurosurveillance 2020; 25:2000180.
7. Watts AG et al. Potential Zika virus spread within and beyond India. 27. Dryhurst S et al. Risk perceptions of COVID-19 around the world.
J Travel Med 2019; 26. doi: 10.1093/jtm/tay132. J Risk Res 2020; 1–13. doi: 10.1080/13669877.2020.
8. Quam MB, Wilder-Smith A. Estimated global exportations of Zika 1758193.
virus infections via travellers from Brazil from 2014 to 2015. J Travel 28. Vinceti M et al. Lockdown timing and efficacy in controlling
Med 2016; 23:taw059. COVID-19 using mobile phone tracking. EClinicalMedicine 2020;
9. Nasserie T et al. Association between air travel and importation of 100457. doi: 10.1016/j.eclinm.2020.100457.
chikungunya into the USA. J Travel Med 2019; 26:taz028. 29. Imperial College COVID-19 Response Team et al. Estimating
10. Zhong P, Guo S, Chen T. Correlation between travellers departing the effects of non-pharmaceutical interventions on COVID-19 in
from Wuhan before the spring festival and subsequent spread of Europe. Nature 2020. doi: 10.1038/s41586-020-2405-7.
COVID-19 to all provinces in China. J Travel Med 2020; 27:taaa036. 30. Gilbert M et al. Preparedness and vulnerability of African countries
11. Wu JT, Leung K, Leung GM. Nowcasting and forecasting the poten- against importations of COVID-19: a modelling study. Lancet 2020;
tial domestic and international spread of the 2019-nCoV outbreak 395:871–7.
originating in Wuhan, China: a modelling study. Lancet 2020. doi: 31. Xiao AT, Tong YX, Zhang S. Profile of RT-PCR for SARS-CoV-2: a
10.1016/S0140-6736(20)30260-9. preliminary study from 56 COVID-19 patients. Clin Infect Dis 2020;
12. Lau H et al. The positive impact of lockdown in Wuhan on con- ciaa460. doi: 10.1093/cid/ciaa460.
taining the COVID-19 outbreak in China. J Travel Med 2020; 32. Dong E, Du H, Gardner L. An interactive web-based dashboard to
27:taaa037. track COVID-19 in real time. Lancet Infect Dis 2020; 20:533–4. doi:
13. Chinazzi M et al. The effect of travel restrictions on the spread of 10.1016/S1473-3099(20)30120-1.
the 2019 novel coronavirus (COVID-19) outbreak. Science 2020; 33. Russell TW et al. Estimating the infection and case fatality ratio
eaba9757. doi: 10.1126/science.aba9757. for coronavirus disease (COVID-19) using age-adjusted data from8 Journal of Travel Medicine
the outbreak on the diamond princess cruise ship, February 2020. 37. Centers for Disease Control and Prevention. CDC’s diagnostic test
Eurosurveillance 2020; 25:2000256. for COVID-19 only and supplies. https://www.cdc.gov/coronavirus/
34. Linton NM et al. Incubation period and other epidemiological 2019-ncov/lab/virus-requests.html.
characteristics of 2019 novel coronavirus infections with right 38. Giri AK, Rana DR. Charting the challenges behind the testing of
truncation: a statistical analysis of publicly available case data. JCM COVID-19 in developing countries: Nepal as a case study. Biosafety
2020; 9:538. Health 2020; 2:53–6.
35. Kucirka LM, Lauer SA, Laeyendecker O, Boon D, Lessler J. Varia- 39. Dickens BL, Koo JR, Wilder-Smith A, Cook AR. Insti-
tion in false-negative rate of reverse transcriptase polymerase chain tutional, not home-based, isolation could contain the
reaction–based SARS-CoV-2 tests by time since exposure. Ann Intern COVID-19 outbreak. Lancet 2020; 395:1541–2. doi:
Med 2020; 173:262–7. doi: 10.7326/M20-1495. 10.1016/S0140-6736(20)31016-3.
36. Watson J, Whiting PF, Brush JE. Interpreting a covid-19 test result. 40. Persad G, Emanuel EJ. The ethics of COVID-19 immunity-based
Downloaded from https://academic.oup.com/jtm/advance-article/doi/10.1093/jtm/taaa141/5897021 by guest on 26 October 2020
BMJ 2020; 369:m1808. licenses (“immunity passports”). JAMA 2020; 323:2241–2.You can also read