Electric and Ultra-low emission vehicles: Public survey results
←
→
Page content transcription
If your browser does not render page correctly, please read the page content below
Research and Information Service
                          Research Paper

                                                       11 June 2021

                                         Daryl Hughes & Des McKibbin

    Electric and Ultra-low emission
    vehicles: Public survey results
                                                         NIAR 155-21

    This research paper reports on the results of a public survey into electric and ultra-
     low emission vehicles in Northern Ireland. It also raises a number of questions to
         assist the Committee for Infrastructure in its scrutiny of electric car policy.

      Paper No. 46/20                                                                                          11 June 2021

   Research and Information Service briefings are compiled for the benefit of MLAs and their support staff. Authors are available to
discuss the contents of these papers with Members and their staff but cannot advise members of the general public. We do, however,
        welcome written evidence that relates to our papers and this should be sent to the Research and Information Service,
       Northern Ireland Assembly, Room 139, Parliament Buildings, Belfast BT4 3XX or e-mailed to RLS@niassembly.gov.uk
NIAR 155-21 Research Paper
Key Points
This paper reports results from a survey of attitudes to ultra-low emission vehicles.
The survey received 742 responses, though respondents self-selected and are
therefore not representative of the NI population.
0.4% of Northern Ireland registered vehicles are ULEVs, around half of which are
battery EVs and half are plug-in hybrid EVs.
It is UK Government policy to ban sales of new petrol and diesel cars and vans by
2030, and hybrid vehicles by 2035.
77% of respondents to the survey supported the UK Government policy. 18%
opposed it.
The most widely perceived benefit of EVs is ‘zero exhaust emissions’ (82% of
respondents). 60% of respondents saw EVs as ‘environmentally friendly’.
The most widely perceived disadvantages of EVs are related to range and charging
infrastructure: ‘lack of charging stations’ (92% of respondents), ‘range anxiety’ (60%)
and ‘long recharge times’ (52%).
85% of EV owner respondents intended their next car to be another EV. These were
generally affluent, environmentally conscious drivers who could charge their EV at
home, without relying on public chargers. 15% of EV owners did not intend their next
car to be an EV, following poor experience of public charging infrastructure.
23% of EV non-owner respondents intended their next car to be an EV. Although
these would like to buy an EV, many expressed concerns about the lack of charging
facilities and high initial cost. 77% of EV non-owners did not intend to buy an EV, or
were undecided. Common concerns included the high price of new EVs and the
poor reputation of the public charging infrastructure. In addition, some respondents
were concerned about the environmental and social impacts of EVs.
A third of Northern Ireland’s housing stock is terraced houses and flats. Most
respondents living in these dwellings would be unable to install a home charger.
Over 90% of EV owners were dissatisfied with the availability and maintenance of
public charging stations. Respondents gave detailed feedback and suggestions
regarding the location, capacity, governance and design of charging infrastructure.
EV ranges and charge rates have improved in recent years; the average new EV
has 200 mile range. However, most EV non-owner respondents would expect to be
able to travel over 200 miles per charge, and charge rapidly (under 30 minutes).
‘Pull’ policies to encourage sustainable travel were popular among respondents.
Around 90% supported infrastructure investments and incentives for purchasing
EVs. However, ‘push’ policies penalising fossil fuel car drivers were less popular.
Half of respondents would consider changing their mode of travel for journeys less
than 2 miles, but less than a third would for journeys longer than 5 miles.
After the anticipated removal of COVID-19 restrictions, 54% of respondents
expected to work from home at least some of the time.
Northern Ireland Assembly, Research and Information Service 1NIAR 155-21 Research Paper
Executive Summary
The UK Government has committed to emit net zero greenhouse gases by 2050,
banning the sale of new fossil fuel cars and vans by 2030, and hybrid vehicles by 2035.
Transport in Northern Ireland (NI) is currently highly dependent on cars, of which less
than 1% are electric vehicles (EVs). In order to decarbonise NI transport, the
Committee on Climate Change recommends shifting to active travel and public
transport, and reducing barriers and non-financial barriers to electric car uptake1. As
part of its Inquiry into Decarbonising Northern Ireland’s Road Transport, the Committee
for Infrastructure requested that the Assembly Research and Information Service
prepare a survey to ascertain public attitudes towards ultra-low emission vehicles –
both pure electric and plug-in hybrids – as well as perceived barriers to their use. The
survey received 742 complete responses. The main findings from the five sections are
as follows.
1 Awareness of, and attitudes to, policy
Most respondents had heard of the policy, although only 54% were satisfied that they
had sufficient information to understand it. 77% supported and 18% opposed it.
2 Attitudes to electric vehicles (EVs) and ultra-low emission vehicles (ULEVs)
Most respondents believed EVs to be environmentally friendly and cheap to run.
However, the key barriers to EV or ULEV purchases were financial (purchase price and
running costs), and charge-related (range, and access to home and public chargers).
3 Experiences of EV owners and expectations of EV non-owners
Most EV owners lived in properties which allow home charging facilities. EVs were
mostly charged at home, with public and workplace chargers also used regularly. Two-
thirds of owners were highly dissatisfied with the maintenance and availability of
charging stations. Many EV non-owners living in terraced houses or flats would be
unable to install home chargers. Most would expect nearby, rapid public charging
stations, and to travel up to 300 miles between charges.
4 Attitudes to Transport Demand Management policies/methods
Sustainable travel policies varied in popularity. Infrastructure investments, subsidies,
and public sector procurement, were well-supported. In contrast, penalties for fossil fuel
cars such as workplace parking levies were less popular.
5 Travel behaviour and COVID-related changes
Although journeys under two miles are often undertaken using active travel (walking
and cycling), cars dominate longer journeys. Around half of respondents were willing to
switch to active travel and public transport for short journeys. However, they tended to
1
Decarbonising Transport in Northern Ireland, RaISe, October 2020
Northern Ireland Assembly, Research and Information Service 3NIAR 155-21 Research Paper
be unwilling to change for longer journeys. Meanwhile, two thirds of respondents
travelled over 5 miles to a place of work or education. COVID-19 restrictions have
reduced overall travel, and caused a shift away from cars and public transport to active
travel. After COVID-19, around half of respondents expected to work at least partly
from home. However, most expected to commute some or all of the time.
Northern Ireland Assembly, Research and Information Service 4NIAR 155-21 Research Paper
Contents
Key Points .............................................................................................................................. 1
Executive Summary ............................................................................................................... 3
Survey overview and limitations ............................................................................................. 7
Section 1 – Awareness of and attitudes to policy .................................................................... 8
1.1 Awareness of policy.......................................................................................................... 8
1.2 Satisfaction with policy information ................................................................................... 9
1.3 Attitude towards policy ...................................................................................................... 9
Section 2 – Attitudes towards electric vehicles (EVs) and ultra-low emission vehicles
(ULEVs)................................................................................................................ 11
2.1 EV benefits and disadvantages ...................................................................................... 11
2.2 EV purchase intentions and timeframe ........................................................................... 12
2.2.1 EV owners, intending to buy an EV ............................................................................. 13
2.2.2 EV non-owners, intending to buy an EV ...................................................................... 14
2.2.3 EV owners, NOT intending to buy an EV, or undecided ............................................... 15
2.2.4 EV non-owners NOT intending to buy an EV, or undecided ......................................... 16
2.3 EV purchase factors ....................................................................................................... 17
Section 3 – Experiences of EV owners and expectations of non-owners .............................. 20
3.1 Experiences of EV owners.............................................................................................. 21
3.1.1 Experiences of EV owners: frequency of charging locations ........................................ 21
3.1.2 Experiences of EV owners: distance to charging locations .......................................... 22
3.1.3 Experiences of EV owners: satisfaction with charging infrastructure ............................ 22
3.2 Expectations of EV non-owners ...................................................................................... 25
Section 4 – Attitudes to Transport Demand Management policies/methods ......................... 27
Section 5 – Travel behaviour ................................................................................................ 28
5.1 Current travel behaviour and attitudes to change ........................................................... 28
5.2 COVID-related changes ................................................................................................. 30
Northern Ireland Assembly, Research and Information Service 5NIAR 155-21 Research Paper
Survey overview and limitations
As part of its Inquiry into Decarbonising Northern Ireland’s Road Transport, the
Committee for Infrastructure requested that the Assembly Research and Information
Service prepare a survey to ascertain public attitudes towards ultra-low emission
vehicles – both pure electric and plug-in hybrids – as well as perceived barriers to their
use. The survey (ULEV Infrastructure Survey) ran from Monday 15 March to Friday 16
April 2021.
There were 742 completed responses.
76% of respondents were male and 24% were female.
33% of respondents (N = 247) own or have previously owned an electric vehicle
(EV). Just 0.4% of NI’s registered vehicles were ULEVs, around half of which are
battery EVs and half plug-in hybrids, at the end of 20202, indicating that the survey
respondents were not representative of the NI population.
Among those who responded to the survey, women were more likely to be EV
owners (42%) than men (30%).
Over 50% of respondents were older than 46 years. Over 75% were older than 36
years.
EV ownership increased with age, becoming more common from 36 years old and
older (figure 1).
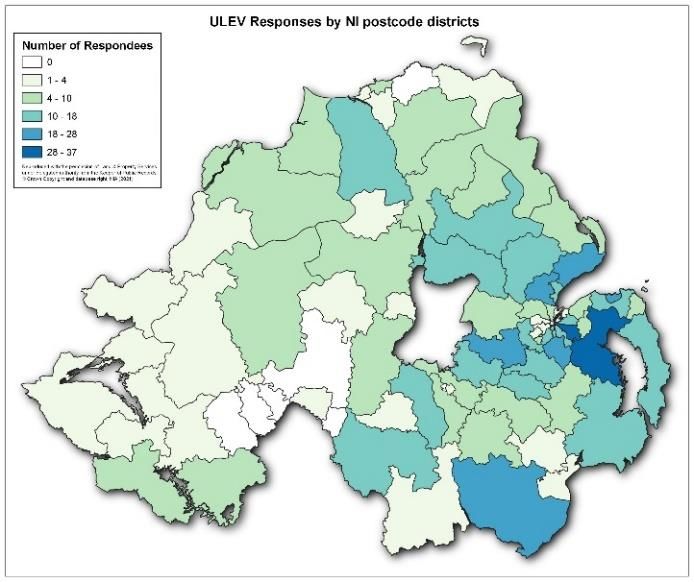
Most respondents lived in the eastern counties (figure 2).
The survey provides valuable information about attitudes towards EVs and sustainable
transport policies. However, respondents self-selected and are therefore probably
not representative of the entire NI population. Accordingly, the survey results
should be interpreted and used with care.
There were five sections of the survey, reflected in the structure of this report:
1. Awareness of, and attitudes to, policy
2. Attitudes towards electric vehicles (EVs) and ultra-low emission vehicles (ULEVs)
3. Experiences of EV owners and expectations of non-owners
4. Attitudes to Transport Demand Management policies/methods
5. Travel behaviour (including COVID-19 changes)
2
Vehicle Licensing Statistics: Annual 2020, Department for Infrastructure, May 2021
Northern Ireland Assembly, Research and Information Service 7NIAR 155-21 Research Paper
20%
16%
Percentage (%) 12%
8%
4%
0%
Age range and gender
Non Owner Owner
Figure 1 Respondent age, gender and EV ownership
Figure 2 Survey responses postcode districts: Location and ULEV/EV ownership
1 Awareness of, and attitudes to, policy
Section one of the survey sought to establish the extent of public awareness and
attitudes towards the UK Government policy that will ban sales of new petrol and diesel
cars and vans by 2030, and hybrid vehicles by 2035.
1.1 Awareness of policy
89% of respondents were aware of the policy. Of these, 64% had heard about it on
television news and a further 23% on social media (figure 3).
Northern Ireland Assembly, Research and Information Service 8NIAR 155-21 Research Paper
TV News 64
Social Media 23
Print Media 6
Gov.uk website 4
Other 3
0 10 20 30 40 50 60 70
Percent (%)
Figure 3 Policy awareness (Q: ‘How did you hear about this policy?’)
1.2 Satisfaction with policy information
Just over half of respondents were satisfied that the available information was sufficient
to explain the policy: 9% were very satisfied and 45% were satisfied. However, 26%
were dissatisfied and 12% were very dissatisfied with the availability of information
(figure 4).
Very Satisifed 9
Satisfied 45
Dissatisfied 26
Very Dissatisfied 12
Don't Know 8
0 5 10 15 20 25 30 35 40 45 50
Percentage (%)
Figure 4 Information availability satisfaction (Q: ‘How satisfied are you that there is
information available to you to explain this policy?’)
1.3 Attitude towards policy
77% of respondents supported the UK Government policy: 44% strongly supported it,
and 33% supported it. 9% were strongly opposed (figure 5).
Northern Ireland Assembly, Research and Information Service 9NIAR 155-21 Research Paper
Strongly Support 44
Support 33
Oppose 9
Strongly Oppose 9
Don't Know 6
0 5 10 15 20 25 30 35 40 45 50
Percentage (%)
Figure 5 Attitude towards policy (Q: ‘To what extent do you support / oppose this
policy?’)
There were 363 additional comments. Themes which arose repeatedly included:
The ‘over ambitiousness’ of the policy;
The prohibitive cost of e-cars;
The poor quality of NI’s charging infrastructure;
Questions about the wider environmental benefits of e-cars;
The need for e-cars to be part of a wider transport policy approach that promotes
cycling and walking;
Questions about how equitable this policy is, suggesting it discriminates against the
poor.
These issues were considered in more depth in section two of the survey. The
following are a small selection of quotations from the survey:
“More cars of any sort is not the answer, we need more cycling
infrastructure and cities built for public transport and sustainable transport.”
“Currently the infrastructure to support EVs is poor and the cost of the
vehicles is too high.”
“There would need to be massive investment in charging infrastructure! It's
dire currently in NI.”
“How about coming up with ways to save the environment that common
people can afford - you will have far more support. Like an overhaul of the
public transport system to make it cheap, reliable and easily accessible.
Get people out of cars and onto buses and trains.”
“This is to ultimately stop poorer classes having access to individual family
transport and the reduction of human rights of free travel to chosen areas.”
Northern Ireland Assembly, Research and Information Service 10NIAR 155-21 Research Paper
“Huge investment is required in infrastructure to support this, especially for
those who do not have driveways and cannot charge vehicles at home.”
“Current Public EV charge points not fit for purpose - 1 in 3 currently out of
service with no plans to fix - severe lack of investment - Northern Ireland is
so far behind England, Scotland and Wales. Our network is worryingly
decreasing in size. EV infrastructure will not be ready in time.”
Questions
How could the policy be better explained to inform the public?
2 Attitudes towards electric vehicles (EVs) and ultra-low
emission vehicles (ULEVs)
This section asked respondents for their views on EVs, including perceived benefits
and disadvantages. It also asked whether and when they intend to purchase an EV,
and factors that would be of importance when making this decision.
2.1 EV benefits and disadvantages
14 possible benefits were listed. These covered four categories: environmental,
financial, infrastructure-related, and experience/safety. The three most selected
benefits were environmental, with ‘low operating costs’ also popular (figure 6). The
other, mostly financial and experience/safety benefits generally scored less than 50%,
indicating that only a minority of respondents agreed that these were beneficial aspects
of EVs.
Zero exhaust emissions 82
Benefits of EVs
Reduced reliance on fossil fuels 69
Environmentally friendly 60
Low operating costs 58
Can charge up at home, work, or when travelling 41
0 10 20 30 40 50 60 70 80 90
Percentage of respondents (%)
Figure 6 Benefits of EVs. Top 5 of 14 (Q: ‘What do you consider the main benefits of an
electric vehicle?’)
Northern Ireland Assembly, Research and Information Service 11NIAR 155-21 Research Paper
Of eleven possible disadvantages of EVs, experience/safety and financial concerns
scored highest. Over 90% of respondents identified ‘lack of charging stations’ as the
main disadvantage, while 75% identified the cost of EVs in comparison to conventional
cars (figure 7).
Disadvantages of EVs
Lack of charging stations 92
More expensive than conventional cars 76
Range anxiety 60
Long recharge times 52
Expensive to replace battery 46
0 10 20 30 40 50 60 70 80 90 100
Percentage (%)
Figure 7 Disadvantages of EVs. Top 5 of 11 (Q: ‘What do you consider the main
disadvantages of electric vehicles?’)
2.2 EV purchase intentions and timeframe
Respondents were asked whether their next car will be an EV and, if so, when. 44%
said yes, 27% said no, and 29% were undecided (figure 8). Of those who said yes,
90% intended to buy an EV within the next 5 years, and less than 1% after 10 years. Of
those who were undecided, 52% intended to buy an EV within the next five years.
50
Percentage (%)
40
30
20
10
0
No Undecided Yes
Purchase intention and anticipated timeframe
0-2 years 2-5 years 5-10 years 10+ years All
Figure 8 EV purchase intentions and anticipated future purchase date (Q: ‘Will your
next car be an electric vehicle?’, and; ‘When are you likely to buy an electric vehicle or
other ULEV’?)
Northern Ireland Assembly, Research and Information Service 12NIAR 155-21 Research Paper
578 of 742 respondents took the opportunity to explain the reasons for their purchase
intentions. These explanations are presented below, grouped by EV ownership
(owners and non-owners) and purchase intentions (yes and no/undecided).
2.2.1 EV owners, intending to buy an EV
85% of current or previous EV owners intended to buy an EV next. EV owners tended
to be motivated by environmental concerns e.g. climate change and air pollution. Many
expressed pleasure at the experience of driving an EV. However, many respondents
caveated their responses with dissatisfaction at the state of the public charging
infrastructure. Reasons given included:
Environmental
o Reduced climate and environmental impacts (despite manufacturing impacts)
o Reduced air pollution
o Reduced fossil fuel reliance
o Believe that EV is technology of the future, and wish to be early adopter
Finance
o Cheaper to charge an EV than fuel an internal combustion engine (ICE) car
o Benefit-in-kind (BIK) tax lower for company cars
o Price of new EVs has fallen enough
o Affordable second hand EVs are available
Vehicle experience, safety, quality and choice
o Pleasurable driving experience
o Low maintenance
o EV suits needs e.g. journeys are within range
o Improved range has reduced reliability on public rapid chargers
Other
o Anticipating future ban on fossil fuel cars
o Expectation that charging infrastructure will improve
Among the comments received, the following are broadly representative of the range of
themes:
“I’ve driven electric for 6 years and don’t want to go back. It’s more
convenient 99% of the time, the other 1% is getting better with increased
ranges/faster charging speeds/more network choice.”
“There are hardly any charging stations. And a large number of the ones
we do have are old, not maintained, and unfit for purpose. Stormont and
local councils say there’s no demand for chargers, but the real issue is
Northern Ireland Assembly, Research and Information Service 13NIAR 155-21 Research Paper
people are reluctant to switch to EVs because the charging infrastructure
isn’t suitable… For people like myself who do smaller miles and have a
domestic wall box installed, it’s just about manageable even with our failing
infrastructure.”
“I have had an electric car in the past and loved it. Gave it up due to lack of
rapid charging infrastructure. Hopefully by the time I need next car this will
be sorted.”
2.2.2 EV non-owners, intending to buy an EV
23% of the current non-EV owners intended to buy an EV next. Respondents gave
similar explanations to the EV owners who intended to buy an EV, with some additions
and differences. Some expressed concerns about lack of charging facilities and high
initial cost, although they hoped or expected these to be addressed.
Environmental
o Believe that EV is technology of the future, and wish to contribute to transition
Finance
o Incentives for NHS EV fleet
o Better warranties
Vehicle experience, safety, quality and choice
o Improved choice of models
o Improved charge times and range
The following comments are broadly representative of the range of themes:
“This is a way of personally reducing my carbon footprint. I would prefer a
plug-in hybrid to overcome range anxiety until car batteries improve greatly.
Also, the lower running cost due to charging versus filling up on petrol is
very appealing. The initial cost is off-putting though.”
“Because electric is the way forward. With more people turning to electric
cars will develop a cycle so the EVs can be developed even further. Get on
board or get left behind.”
“I plan to run my current car for a number of years and then, at that time, an
electric car will be a logical choice (unless hydrogen cars are available by
then).”
Northern Ireland Assembly, Research and Information Service 14NIAR 155-21 Research Paper
2.2.3 EV owners, NOT intending to buy an EV, or undecided
15% of the current or previous EV owners who responded to the survey did not intend
to buy an EV next, or were undecided. The state of charging infrastructure was a very
common complaint, although cost, environment and poor experience of low-range EVs
were also mentioned. They gave the following explanations for their intentions:
Charging infrastructure and management
o Lack of charge points
o Broken charge points
o Range/charge anxiety
o Long charge time
o Queues for chargers
o Charge registration required
Finance
o High purchase cost
o Insurance can cost more
o ESB charge more per unit electricity for faster charges
Environmental
o Environmental impact of battery manufacture and disposal
o Environmental impact of non-renewable grid power
Vehicle experience, safety, quality and choice
o Batteries are fire crash hazard
o Vehicles are too quiet so a hazard for pedestrians
o Poor driving experience due to need to conserve energy
o Paucity of EV models e.g. 7 seaters and towing
The following comments are broadly representative of the range of themes:
“Having had two EVs I love the experience driving them, but charging is a
nightmare... Sales are increasing massively, while the charging
infrastructure is on its knees. I often have to queue up for an hour to charge
for an hour to get 80% charge… To make 2030 a possibility there would
need to be at least a dual 22kWh unit in every small town in the country
and at least 3 rapids in larger (market) towns and cities.”
“The charging infrastructure in Northern Ireland is hopelessly outdated and
virtually obsolete. Long distance journeys would be a nightmare.”
“We, EV owners/operators here in NI are furious and having continually
lobbied, reported, informed our Government/Assembly, Dept of
Infastructure, have been lied to and genuinely abandoned. Our local
Councils have acted in exactly the same way, not interested. I do fully
Northern Ireland Assembly, Research and Information Service 15NIAR 155-21 Research Paper
regret my attempt at looking after our environment and future by moving to
an EV in the hope I was doing my best. Shame on our NI
Government/Assembly for this shambles!”
“Environmental impact of battery manufacturer and disposal probably as
bad for the environment as fossil fuel use… What will generate the
electricity to charge all these electric cars, fossil fuel?”
2.2.4 EV non-owners NOT intending to buy an EV, or undecided
38% of the current EV non-owners who responded to the survey did not intend to buy
an EV next. A further 39% were undecided. These concerns overlapped somewhat
with those of the EV owners who were not intending to buy another EV. In addition,
cost was a primary concern. Some respondents were concerned about the
environmental and social impacts of a transition to EVs. A few respondents disliked
battery EV technology.
Respondents who were undecided tended to be open-minded about EVs. Many were
awaiting issues to be resolved before deciding to buy an EV e.g. EV technology
improvements, charging infrastructure improvements, prices to fall, government
incentives to be (re)introduced. Respondents highlighted the following concerns:
Charging infrastructure and management
o Lack of chargers
o Doubts about or knowledge of poor state of charging infrastructure
o Lack of space for home charging facilities
Finance
o High purchase cost
o High cost of home chargers
o Doubts about resale value
o Government grant scrapped
o Lack of second hand vehicles
o Cost prohibitive to poor and those without parking facilities e.g. terraces
Environmental
o Environmental and social/human rights impacts of battery manufacture and
disposal
o Environmental impact of non-renewable grid power
o Mass vehicle ownership is inherently unsustainable
o Doubts about longevity of EVs
o Scepticism of current push for EVs e.g. hybrids and diesels
Northern Ireland Assembly, Research and Information Service 16NIAR 155-21 Research Paper
o Many not looking to buy a car, either at this moment, or in principle
o Climate fatalism (i.e. other countries continuing to emit greenhouse gases)
Vehicle experience, safety, quality and choice
o Paucity of EV models e.g. mobility, towing, 4x4 etc.
o Poor range, especially for rural travel
o Prefer fossil fuel cars, and/or would prefer alternative fuels
o Dislike aesthetics of current EVs
The following comments are broadly representative of the range of themes:
“We would love to be able to choose an electric car but they are much too
expensive. Both of us are homeowners in full time employment, no kids and
no debt so if we can't afford it, how would other households adapt to the
switch without substantial grants being offered? Hopefully by 2030 the
vehicles will be affordable to ensure a successful transition!’
“Once again there is no talk or strategy to put enough charge points in
place to have the entire Northern Ireland convert to EV. How much damage
will scrappage or what cost will scrappage of EV batteries cost to the
enforcement in the future? No info on this whatsoever.”
“I live in a terrace house which is difficult to find a space right outside the
house. I am unsure where I could charge the car.”
“‘No car’ is better than an electric one; all the disadvantages of car use are
still true for electric cars: congestion, physical inactivity, road danger,
extraction of minerals for manufacture, destruction of environment through
mining, quarrying and road building. Electric car manufacture still embeds a
massive carbon footprint.”
2.3 EV purchase factors
Participants rated the importance of twelve factors in deciding to purchase an EV or
ULEV (Table 1). Based on ‘very important’ and ‘important’ responses, the most
important factors were: purchase price (91%), range (91%), the ability to charge at
home (88%) and on the go (83%), running cost (84%), and charge time (81%).
Northern Ireland Assembly, Research and Information Service 17NIAR 155-21 Research Paper
Table 1: Importance of factors in deciding to buy an EV or ULEV (Q: ‘Rank the
following by how important they would be to you when deciding to purchase an electric
vehicle or other ULEV?’)
5 Very 2 Not 1 Not at all Don't
Factor important 4 Important 3 Neutral important important know
Can charge at home 68% 20% 9% 1% 2% 0%
Purchase price 67% 24% 7% 1% 1% 0%
Range/Distance 66% 25% 7% 1% 1% 0%
Can charge on the go 60% 23% 12% 3% 2% 1%
Time taken to charge 54% 27% 14% 3% 2% 0%
Running costs 54% 30% 13% 2% 2% 0%
Environmental benefits 51% 24% 14% 6% 5% 1%
Maintenance costs 43% 33% 19% 3% 2% 0%
Drive/Performance 40% 38% 16% 4% 2% 0%
Better recycling/reuse 33% 25% 26% 10% 6% 1%
Range of cars/models 29% 30% 26% 9% 4% 1%
Car looks 26% 34% 25% 7% 7% 1%
151 respondents took the opportunity to leave additional comments about factors (Q;
‘Are there any other factors?’). Additional factors and expansions on the original twelve
factors are included below, under the same four categories:
Charging infrastructure and management
o Availability of public charging points
o Trust in government to improve charging infrastructure
o Concern about capacity of electricity grid to support EV charging
Finance
o Subsidies for EV purchases
o Subsidies for EV charging at home and/or using renewables
o Availability of information about costs of owning and running EVs
o Resale value: Predictable value and depreciation of evolving technology
o Cost of home charger installation
o Cost of leasing
Environmental
o Air quality
o Impact of disposal of current (fossil fuel) car
o Impact on future generations
o Concern over EV supply chain e.g. mining impacts and child labour
o Concern over reliance on scarce resources
o Extent of electricity grid decarbonisation
Northern Ireland Assembly, Research and Information Service 18NIAR 155-21 Research Paper
Vehicle experience, safety, quality and choice
o Safety of passengers and other road users, including speed governor
installation
o Accessibility for wheelchair users
o Availability of specialist models e.g. mobility, towing, 4x4, roof bars, boot
space etc.
o Drive/performance e.g. weight and acceleration
o Comfort
o Reparability, support for third party repairs
o Self-driving ability
o Self-update ability of on-board software, without using a dealership
Other
o Distrust in government-promoted vehicle technologies, due to previous
promotion of diesels
o Dislike of vehicle manufacturers selling high cost vehicles
o ESB overcharging EV owners for electricity (and Assembly/Executive allowing
this)
Some comments were complaints or other opinions rather than factors influencing
EV/ULEV purchases. Nonetheless, some of these were insightful:
Some participants believed that EVs were unsuitable because they have ranges
less than 100 miles. This suggests that up-to-date information about improved EV
ranges might improve attitudes to EVs.
No intention to buy an EV, due to preferences for active travel, hydrogen fuel, or
fossil fuel cars.
“Better developed infrastructure and clearer cost information. Currently it’s like a
secret society.”
“Current EV drivers are mostly happy to pay for a viable, reliable, rapid and readily
available charging network. Would you consider driving a petrol car with only a jerry
can at home and no petrol stations?”
Questions
Currently privately owned EVs are most suitable for affluent people, with
space for home charging, and who generally travel less than 200 miles. Is the
Executive’s vision to encourage these people to buy EVs?
Northern Ireland Assembly, Research and Information Service 19NIAR 155-21 Research Paper
For less affluent people, without space for home charging, and travelling
regularly travelling over 200 miles, what are the sustainable alternatives to
private EV ownership? Active travel, EV sharing, public transport?
How could the public charging infrastructure be best improved?
Is there a need for a public awareness campaign to address perceptions of the
disadvantages of EVs which may be out-of-date?
3 Experiences of EV owners and expectations of non-owners
Section 3 asked whether or not respondents own, or have ever owned, an EV. Owners
were then asked about their experiences of using home and public charging facilities.
Non-owners were asked similar questions about EV infrastructure, based on their
knowledge and expectations.
One third of respondents (N=247) own, or have owned, an EV (figure 9).
89% (N=220) had facilities to charge at home.
o Of these, 93% (N=205) of these lived in a semi- or detached property, 9 lived
in terraced houses, 2 in flats or apartments, and 4 other/blank.
11% (N=27) did not have facilities to charge at home.
o Of these, 52% (N=14) lived in semi- or detached properties, 37% (N=10) lived
in terraced houses, and 11% (N=3) lived in flats or apartments.
Of the two thirds of respondents who do not, or have never owned an EV:
76% had facilities that would enable the installation of a home charger.
o Of these, 90% (N=329) lived in a semi- or detached property, 7% (N=27) lived
in a terraced house, and 3% (N=11) lived in a flat/apartment.
24% did not have facilities that would enable the installation of a home charger.
o Of these, 38% (N=45) lived in a semi- or detached property, 46% (N=54) lived
in a terraced house, and 16% (N=19) lived in a flat/apartment.
In 2017 65% of NI housing stock was semi/detached houses or bungalows, while 35%
was terraced houses or flats3. Assuming only the former have a dedicated parking
space, this suggests that around a third of households would lack the ability to install
home charging facilities.
3
The Housing Stock of the United Kingdom, BRE Trust, February 2020
Northern Ireland Assembly, Research and Information Service 20NIAR 155-21 Research Paper
400
Number of respondents
350
300
250
200
150
100
50
0
Semi/detached Terraced Flat/apartment Semi/detached Terraced Flat/apartment
Owner Owner Owner Non-owner Non-owner Non-owner
EV ownership and property type
No charge facility Charge facility
Figure 9 Respondent EV ownership, property type and access to charging facilities (Q
for owners: ‘Do you have on/off street parking to facilitate a charger at your home?’; Q
for non-owners: ‘Do you have on/off street parking that would facilitate a charger at
your home?’)
3.1 Experiences of EV owners
This section sought views on the experiences of EV owners.
3.1.1 Experiences of EV owners: frequency of charging locations
Owners indicated how often they charge their EV at different locations (table 2):
72% charged at home at least a few days per week.
35% used public chargers at least a few days per week, and 76% used them at least
a few days per month.
23% charged at work at least a few days per week, although only 37% used them
more than a few days per year.
Filling stations are the least used facility, with only 5% using them more than a few
days per week.
Northern Ireland Assembly, Research and Information Service 21NIAR 155-21 Research Paper
Table 2 Frequency of charging at different locations (Q: ‘‘The Government believes
most people will charge their e-car at home, how often do you charge at?’)
A few days per A few days per A few days per
Most days week month year Rarely/Never
Home 32% 39% 18% 4% 6%
Work 10% 13% 11% 10% 56%
Public charger 9% 25% 41% 18% 6%
Filling station 2% 4% 19% 22% 53%
Other 1% 1% 8% 9% 81%
3.1.2 Experiences of EV owners: distance to charging locations
Owners indicated the distance from home of their nearest charging point. 74% were
less than 5 miles from a charging point, while 7% were more than 20 miles away (figure
10).
Distance from charging
1-2 39
station (miles)
2-5 35
5-10 17
10-20 5
20 + 7
0 5 10 15 20 25 30 35 40 45
Percentage (%)
Figure 10 EV owner distances from charging station (Q: ‘How far from your home is
your closest charging point?’)
3.1.3 Experiences of EV owners: satisfaction with charging infrastructure
EV owners were asked, based on their experience of public charging infrastructure,
how satisfied they were with various aspects of the public charging infrastructure.
There were high levels of dissatisfaction with the state of the infrastructure (Table 3).
Respondents were ‘not satisfied at all’ with the maintenance of charging stations
(77%), availability of charging stations (68%), and location of charging stations (46%).
Respondents were most, although not highly, satisfied with the information relating to
charging station locations.
Northern Ireland Assembly, Research and Information Service 22NIAR 155-21 Research Paper
Table 3 EV owner satisfaction with aspects of the public charging infrastructure (Q:
‘Based on your experience of public charging infrastructure, how satisfied are you with
the following’)
5 Very 2 Not 1 Not satisfied
satisfied 4 Satisfied 3 Neutral satisfied at all
Maintenance/upkeep charging
stations 2% 2% 6% 14% 77%
Availability of charging stations 0% 2% 6% 23% 68%
Location of charging stations 2% 6% 17% 29% 46%
Distance to a charging station 5% 15% 21% 24% 35%
Time it takes to charge 2% 11% 31% 24% 33%
Information relating to the location of
charging stations 11% 23% 29% 12% 25%
75% (N=184) of EV owners took the opportunity to provide additional comments on
their experiences of public EV charging infrastructure. Unsurprisingly, given the
extremely low levels of satisfaction with charger availability and maintenance, many of
the comments focused on the lack of chargers and their poor upkeep, which often
(according to some respondents) renders them unusable.
The following quotations articulate many of the recurring themes:
“There are a lot of chargers BUT many are in the wrong place, are the wrong
sort, are out of order and not maintained. NI started off well for charging
infrastructure but this position has deteriorated rather than improved and the
current system is not fit for purpose. Current EV owners are being forced to
return to diesel and petrol cars due to lack of either public or commercial
charging infrastructure.”
“A free to use network, as we have in Northern Ireland, is doomed to failure. No
incentive for operator to invest in upkeep or reinvestment. Promotes poor driver
behaviour as they can charge for free - why use your own charger?”
“NI is in big bother when it comes to this legislation. There has been zero
engagement or investment from the Assembly to develop the public charging
infrastructure. Any correspondence to try and prod them into action falls on
lazy/deaf ears. The current charging network is completely dilapidated and
totally unfit for purpose. Department for Infrastructure need to get their act into
gear if we have any hope of being ready for the fossil fuel vehicle ban.”
EV owners reported problems and made suggestions for improvements. These are
synthesised below, to expand on the survey items above. A range of potential
questions for the Committee for Infrastructure are highlighted.
Northern Ireland Assembly, Research and Information Service 23NIAR 155-21 Research Paper
Maintenance/upkeep charging stations
o Users find it difficult to report faults with chargers and expressed the view that
telephone helplines are unreliable. Reports may not be acknowledged. How
can reporting of faults be improved?
Availability of charging stations
o Chargers are often obstructed by parked fossil fuel cars (ICEing), EVs not
currently charging (hogging), or self-charging hybrids (which don’t rely on
chargers). How could obstructing be discouraged?
o Cars on different systems can't always charge from the same charger at the
same time. Does this need to be addressed?
o Government and civil service car parks don’t contain chargers. Should public
sector employers be leading the way?
o Some chargers are locked at night. Can these be made available for
longer?
Location of charging stations and time to charge (capacity)
o Chargers are often poorly sited.
o There is a lack of rapid chargers (20-60 minutes) at key locations e.g. service
stations4.
o There is a lack of fast chargers (2-6 hours) at parking locations e.g. shops,
cinemas.
o There is a lack of slow chargers (8-12 hours) at long stay parking locations
e.g. hotels.
o Newer models allow higher current (more rapid) charging (e.g. 150kW DC),
but few public chargers provide this.
o Is a strategy needed to improve the location, number and capacity of
charging stations?
Information relating to the location of charging stations
o Drivers complain of a lack of a single high-quality, up-to-date database of
public chargers, including the availability and type of chargers.
o There is a plethora of different payment systems including apps, cards and
fobs.
o Some drivers like the Ecarni app.
o Should the Ecarni app be improved, or promoted more widely?
Network governance
o Many drivers complain about lack of investment in network by ESB since it
took over. Some blame poor governance arrangements set up by the
Assembly for this i.e. no incentive or ability to invest.
4
What is the difference between slow, fast and rapid charging? Motoring Electric, July 2020
Northern Ireland Assembly, Research and Information Service 24NIAR 155-21 Research Paper
o Many drivers expressed a clear preference for an overhaul of network
governance.
o Some drivers expressed willingness to pay for charging in order to fund better
infrastructure, on either a use or monthly/annual membership fee.
o Some drivers advocate encouraging private companies to install and operate
chargers. Others would prefer a state-run network.
o Is the governance and operation of the network appropriate to enable
the expansion of NI’s EV fleet?
Other
o Chargers are often poorly-lit, exposed to the elements, don’t allow disabled
access, poorly marked and signed
o A wish to standardise the charging infrastructure
o Chargers could be easier to use e.g. using automatic car recognition like
Tesla’s.
o Is there best practice guidance for charger design and installation?
3.2 Expectations of EV non-owners
This section sought views on the expectations of EV non-owners regarding charger
distance, charge time and range, based on their knowledge and expectations.
85% of EV non-owners would expect to travel less than five miles to a public charging
station (figure 11). 93% would expect to spend less than an hour charging, and 56%
less than 30 minutes (figure 12). 43% would expect to be able to drive for up to 200
miles (figure 13). 29% would expect to be able to travel 200-300 miles. 28% would
expect ranges greater than 300 miles.
Overall, most EV non-owners would expect to travel only short distances to a public
charging station, spend less than 30 minutes charging, and be able to travel up to 300
miles between charges. EV ranges have improved over the last decade and the
average new EV can now travel up to 200 miles per charge5. EVs with ranges up to
400 miles are currently very expensive. This suggests that range remains a barrier to
around half of potential EV owners in NI.
5
Decarbonising road transport - the challenge is set, RaISe, March 2021
Northern Ireland Assembly, Research and Information Service 25NIAR 155-21 Research Paper
Distance would expect to
1-2 49
travel (miles)
2-5 36
5-10 12
10-20 4
0 10 20 30 40 50 60
Percentage (%)
Figure 11 Distance non-owners would expect to travel to a public charging station (Q:
‘If using public charging infrastructure, how far would you expect to have to travel to
access a charging station?’
Time would expect to
0-30 minutes 56
spend charging
30-60 minutes 37
1-2 hours 4
2-4 hours 3
0 10 20 30 40 50 60
Percentage (%)
Figure 12 Time non-owners would expect to spend charging using a public charging
station (Q: ‘If using public charging infrastructure, how quickly would you expect to
charge?’)
Range expectation (miles)
0-100 5
100 - 200 38
200 - 300 29
300 - 400 15
400+ 13
0 5 10 15 20 25 30 35 40 45
Percentage (%)
Figure 13 Range non-owners would expect to achieve before charging (Q: ‘How far
would you expect to be able to drive an electric vehicle before charging?’)
Northern Ireland Assembly, Research and Information Service 26NIAR 155-21 Research Paper
4 Attitudes to Transport Demand Management
policies/methods
While increasing the uptake of ULEVs is critical to successfully de-carbonising road
transport, reducing the number of cars on the road will also be important. This will
require more people to walk, cycle and use public transport, or even reduce the amount
they travel. This section sought views on various policies designed to manage demand
for travel in favour of sustainable modes. Nine policies were proposed including:
subsidies for ULEVs, infrastructure investments, public sector investments, and
penalties for fossil fuel vehicles (table 4).
Infrastructure investments were also well-supported:
o 91% supported a requirement for all filling stations to have at least 3 rapid
chargers
o 89% supported mandating councils to install charge points if requested by
residents
Subsidies for ULEVs were generally well-supported:
o 90% supported VAT cuts and grants for ULEV purchases
o 86% supported a grant towards the purchase of second hand ULEVs
o 68% supported free car parking for ULEVs in town centres
Public sector investment was also popular:
o 83% supported a requirement that all new vehicles purchased by government,
local councils, Translink etc. are ULEVs.
Penalties and incentives for ULEVs at the expense of fossil fuel vehicles were less
popular:
o 60% supported introducing low emission zones in town centres, and 36%
opposed.
o 45% supported priority lanes for ULEVs, and 48% opposed.
o 36% supported a mandatory work place parking levy, and 57% opposed.
Northern Ireland Assembly, Research and Information Service 27NIAR 155-21 Research Paper
Table 4 Attitudes towards policies designed to manage demand for travel in favour of
sustainable modes. NB yellow – subsidy, blue – infrastructure investment, grey – public
sector investment, red – penalties and incentives over fossil fuel cars.
Strongly Don't Strongly
Policy support Support know Oppose oppose
Make it easier to purchase an electric vehicle or other ULEV
by reducing VAT or increasing grants. 71% 19% 2% 3% 5%
Require all filling stations have at least 3 rapid charge points. 69% 22% 3% 3% 3%
Require councils to install charge points if requested by
residents. 64% 25% 4% 4% 4%
Introduce a grant for the purchase of second hand electric
vehicle or other ULEV. 56% 30% 3% 5% 6%
Require all new vehicles purchased by gov., local councils,
Translink etc. to be EVs/ULEVs. 52% 31% 4% 6% 6%
Provide free car parking for electric vehicles or other ULEVs
in town centres. 42% 26% 4% 13% 14%
Restrict access to town/city centres for petrol and diesel cars
and vans (low emission zone). 31% 29% 4% 15% 21%
Provide priority lanes for electric vehicle or other ULEVs on
major roads. 22% 23% 7% 25% 23%
Require car parking charges at work places for petrol and
diesel cars (work place parking levy). 18% 18% 7% 30% 27%
Questions
What is the appropriate balance of ‘push’ and ‘pull’ policies to encourage
sustainable transport?
5 Travel behaviour
Section 5 asked respondents about their current travel behaviours, including frequency,
distance and mode. It also asked about willingness to change transport modes for
given distances.
5.1 Current travel behaviour and attitudes to change
18% of respondents travelled less than two miles to a place of work or education
(figure 14). 64% travelled more than 5 miles.
Northern Ireland Assembly, Research and Information Service 28NIAR 155-21 Research Paper
Distance travelled (miles)NIAR 155-21 Research Paper
Respondents were more open to changing their travel modes for short journeys than
long journeys. For journeys under two miles 52% would, or would maybe, consider
changing the way they travel (table 7). For journeys over 5 miles, 67% would not
consider changing. The most popular alternative travel modes were public transport
(30%), and cycling (29%). 27% selected car. Only 13% selected walking (figure 15).
2% selected ‘other’, including motorcycle, e-scooter, e-bike, van and car sharing.
Table 7 Attitudes to changing travel modes for given distances (Q: ‘Thinking about all
of your trips, including to work and education. Would you consider changing the way
you travel for trips of the following distances?’)
Yes Maybe No
Less than 2 miles 36% 16% 48%
2-5miles 27% 17% 56%
5-10 miles 19% 14% 67%
10-30 miles 15% 12% 73%
30+ miles 14% 13% 73%
Preferred mode to change
Public Transport 30
Cycle 29
Car 27
to
Walk 13
Other 2
0 5 10 15 20 25 30 35
Percentage (%)
Figure 15 Preferred travel mode to change to (Q: ‘What type of transport would you like
to change to?’)
5.2 COVID-19-related changes
COVID-19 has changed our travel behaviour, and this will change again as restrictions
ease. Respondents were asked how COVID-19 has changed their travel behaviour,
how they expect this to change when restrictions end, and how often they expect to
work from home in future.
Respondents were asked, ‘since the start of the COVID-19 pandemic how often do you
now travel by’ various modes. 59% were driving less, with 36% significantly less.
Northern Ireland Assembly, Research and Information Service 30NIAR 155-21 Research Paper
However, 30% were driving more. 28% were using public transport less. 28% were
cycling more. 80% were walking more.
The reduced car and public transport may be explained by less travel demand in
general. However, some respondents indicated that they have avoided using public
transport for hygiene reasons and switched to car journeys instead. Meanwhile,
walking and cycling may have increased as a result of shorter journeys and the
opportunity to change travel habits.
Table 8 COVID-19 travel mode changes (Q: ‘Since the start of the COVID-19 pandemic
how often do you now travel by’)
Significantly A little A little Significantly Don't
less less Not at all more more know
Car 36% 23% 9% 18% 12% 1%
Public transport 23% 5% 65% 2% 1% 4%
Other 7% 2% 65% 1% 2% 23%
Cycle 4% 4% 57% 20% 8% 5%
Walk 4% 5% 10% 48% 32% 2%
Respondents were asked to sum up the main way they expected their travel behaviour
to change after COVID-19 restrictions are removed (figure 16). 33% expected to travel
less generally. 29% expected to walk and cycle more. 22% expected to drive more.
These changes may be due to lifestyle and habit changes. Most significantly, 54%
expected to work from home at least some of the time.
Will travel less generally
Expected travel changes
33
Will drive more 22
after lockdown
Will walk more 16
Will cycle more 13
Will use more public transport 10
Will drive less 7
0 5 10 15 20 25 30 35
Percentage (%)
Figure 16 Expected travel behaviour after COVID-19 (Q: ‘Northern Ireland’s
Infrastructure Minister has committed to investing in green infrastructure as we recover
from COVID-19, how do you see your travel behaviour changing most?’)
Northern Ireland Assembly, Research and Information Service 31NIAR 155-21 Research Paper
Post-COVID work from Not an option 33
home frequency Once a week 8
A few days a week 34
Permanently 12
Don't Know 13
0 5 10 15 20 25 30 35 40
Percentage (%)
Figure 17 Expected frequency of working from home after COVID-19 (Q: ‘Post-
lockdown how often do you expect to work from home?’)
Questions
What are the positive aspects of COVID-19 impacts on travel, and what actions
could be taken by the Department for Infrastructure to encourage these to
continue?
Northern Ireland Assembly, Research and Information Service 32You can also read