Stock Management and Control in a Local Shop of Animal Products - International Journal for ...
←
→
Page content transcription
If your browser does not render page correctly, please read the page content below
International Journal for Innovation Education and Research
 ISSN: 2411-2933

 Stock Management and Control in a Local Shop of
 Animal Products
 Ravena de Mello Rodrigues;Ricardo Luiz Fernandes Bella;Douglas Vieira Barboza

Abstract
Due to globalization, the achievement of competitiveness has become fundamental to the organizations that try to be
leaner each day, reducing costs, and thus allowing other investments. Thereby, stocks are achieving each day more
importance due to its relevance in the company economic stability. A great management allows products never miss in
stock and a great management also avoids excess in leftovers. In this project, the importance of stock management carries
the objective of optimizing the investments over stocks and of decreasing losses caused by obsolescence in a retail micro
company that sells goods for animals. For that purpose, the ABC Classification has been applied in which the main products
referred to demand and profits were identified. The supply policy adopted for those products was the Economic Lot Size,
calculating the safety stock and the resupply point. It was possible to calculate order costs, maintenance and material
through collected data during meetings with the company owners and this way it was possible to realize that the economic
buying batch applicability would generate savings relating to the current company model. In addition to the decreasing of
the risk of losing items and keeping the safety stock in order to face the demand fluctuations.

Keyword: Services management; ABC analysis; Inventory; Economic improvement; Safety Stock.
Published Date: 8/1/2020 Page.624-646 Vol 8 No 08 2020
DOI: https://doi.org/10.31686/ijier.vol8.iss8.2570
International Journal for Innovation Education and Research www.ijier.net Vol:-8 No-08, 2020

 Stock Management and Control in a Local Shop of Animal Products

 Ravena de Mello Rodrigues
 Institute of Science and Technology (ICT), Federal Fluminense University, Brazil.
 Phone: +55 22 2764-9081
 Address: Recife Street, Jardim Bela Vista, Rio das Ostras –Rio de Janeiro
 Zip Code: 28895-532

 Ricardo Luiz Fernandes Bella
 Institute of Science and Technology (ICT), Federal Fluminense University, Brazil.
 Phone: +55 22 2764-9081
 Address: Recife Street, Jardim Bela Vista, Rio das Ostras –Rio de Janeiro
 Zip Code: 28895-532

 Douglas Vieira Barboza
 Laboratory of Technology, Business Management and Environment (LATEC), Federal Fluminense
 University, Brazil.
 Phone: +55 21 2629-5727
 Address: 156, Passo da Pátria Street - room 324, São Domingos, Niterói –Rio de Janeiro
 Zip Code: 28895-532

 Maria Helena Teixeira da Silva
 Institute of Science and Technology (ICT), Federal Fluminense University, Brazil.
 Phone: +55 22 2764-9081
 Address: Recife Street, Jardim Bela Vista, Rio das Ostras –Rio de Janeiro
 Zip Code: 28895-532

Abstract
Due to globalization, the achievement of competitiveness has become fundamental to the organizations
that try to be leaner each day, reducing costs, and thus allowing other investments. Thereby, stocks are
achieving each day more importance due to its relevance in the company economic stability. A great
management allows products never miss in stock and a great management also avoids excess in leftovers.
In this project, the importance of stock management carries the objective of optimizing the investments
over stocks and of decreasing losses caused by obsolescence in a retail micro company that sells goods for
animals. For that purpose, the ABC Classification has been applied in which the main products referred to
demand and profits were identified. The supply policy adopted for those products was the Economic Lot
Size, calculating the safety stock and the resupply point. It was possible to calculate order costs,
maintenance and material through collected data during meetings with the company owners and this way
it was possible to realize that the economic buying batch applicability would generate savings relating to
the current company model. In addition to the decreasing of the risk of losing items and keeping the safety
International Educative Research Foundation and Publisher © 2020 pg. 624
International Journal for Innovation Education and Research www.ijier.net Vol:-8 No-08, 2020

stock in order to face the demand fluctuations.

Keywords: Services management; ABC analysis; Inventory; Economic improvement; Safety Stock.

1. Introduction
With the competitiveness of the market increasing, companies seek to stand out for the quality of their
products, but competition also forces entrepreneurs to work with low prices. Thus, the major obstacle for
companies is to reduce their costs and improve their reliability simultaneously. For this, organizations seek
techniques for cost management and process optimization, considering the computerization of inventory
management in the search for competitiveness [1].
In addition to competing with large national companies, Brazilian micro and small companies (MPE) began
to face international competition in the 1990s with the opening of Brazilian markets, thus compromising
their survival [2]. For this reason, it is vital to rationalize the use of time and resources with the potential
to increase profit margins, better satisfy customers and optimize the performance of their activities [3].
Stock management is a common theme in the market and fundamental to business health, because can help
micro-companies to be steady and, when this is not done efficiently, leaves the enterprise exposed to not
supply your costumer demand, generating opportunities for competitors [4].
The relevance of this work is due to the fact that the company object of the study has no knowledge of
management practices, and consequently does not use them, as a relevant part of micro-companies.
Due to the absence of management practices, they present several problems, such as loss of capital and
compromised profitability, since the company has high levels of inventories that generate losses of products
due to obsolescence and losses in sales due to the absence of other products, in addition to the dissatisfaction
of customers [5].
The present project aims to propose the implementation of stock management tools in order to improve the
resupply policy in a pet food retail micro-company, reducing losses and optimizing investments in stocks.
However, it is not for this study to analyze all products in the store, being restricted only to 15kg dog food
bags, which will be identified through the ABC classification, as they are the products with the greatest
financial impact and because they occupy a larger volume in the stock from the company.
In the structural aspect, the article is divided into five parts: in a first, contextualization and the final
objectives of the approach proposed in this study are exposed. In a second part, the methodology used is
presented and the understanding of the enterprise where the study was carried out is provided. The third
shows the examination and documentation of the application of the method on the pet food retail company.
The fourth part discusses the results presented in the previous step, highlighting those that presented
themselves as of greater relevance and proposing to use management tools. And in a last stage, the
achievement of the goals pursued in the objective of the study is concluded.

2. Material and Methods
This is applied research, exploratory, classified as qualitative and quantitative, and which used the case
study in a retail company to study in detail the causes of a determined problem.
International Educative Research Foundation and Publisher © 2020 pg. 625
International Journal for Innovation Education and Research www.ijier.net Vol:-8 No-08, 2020

2.1 Methodology
The method of this research is formed by a bibliographic research and a case study. The bibliographic
research aims to identify and organize the concepts related to the chosen theme based on relevant works
[6].
Given that this research is a case study, it should be noted that, this research method ranges from the logic
of its planning to the description of data collection and analysis procedures and also the development of
the theory, this being an essential part of the project. To design the research, the author highlights four
questions for its conduct: “What problems to study?”; “What data is important?”; "What data will be
collected?"; and "How to analyze them?" [7].
The research took place in six stages: Kick-off meeting; planning visits throughout the project; collecting
and analyzing data related to the store's stock and preparing a proposal for improving the product storage
process.
The Kick-off Meeting was held on the first visit, in March 2019, in order to talk with the company owner
about the possibility of carrying out an academic study in his store, which was restricted to visits with
previous scheduling. Still at this stage, information was collected on the history of the company and its
functioning, in order to elaborate the context of the research and also define the objective and the research
problem.
On the second visit, a schedule was established with the entrepreneur, in order to decide the best days and
times so as not to compromise the operation of the store and enable data collection with ease. In this way,
10 visits were scheduled over 5 months at 2 pm.
Data collection was carried out by means of documents, by direct observation of the company's storage
system and through interviews with the store owner and employees using a question script in order to
optimize the time and responses of employees. All interviews were recorded.
The time to place and receive an order was observed, which were observed and timed by the researcher in
three different days and the systematic of resupply and storage of the store in order to understand its
operation, since the company does not have a defined system, and capture possible gaps and then carry out
a study and propose solutions.
Regarding the replacement of the items, the period and quantities of goods replaced and the size of the
purchase lots were determined. And in relation to storage, it was seen how the stock is organized, where
the items are allocated when they arrive at the store and who is responsible for their storage.
Customer service was observed in order to investigate whether there is a recurring lack of products in the
store for consumers. At the end of the observations, reports and records with photos were made in order to
keep all the information observed.
After data collection, results analysis was carried out to identify the quantity of products in stock, the
products to be prioritized based on profitability and demand, and to analyze the stock replenishment policy.
The Physical Inventory and ABC Classification tools were used.
The Physical Inventory has the objective of counting the goods in stock [8], and was used because the
owner informed during the interview that he was not aware of the quantities of products stocked.
After the inventory, the products were classified according to the logic of the ABC curve, which shows that

International Educative Research Foundation and Publisher © 2020 pg. 626
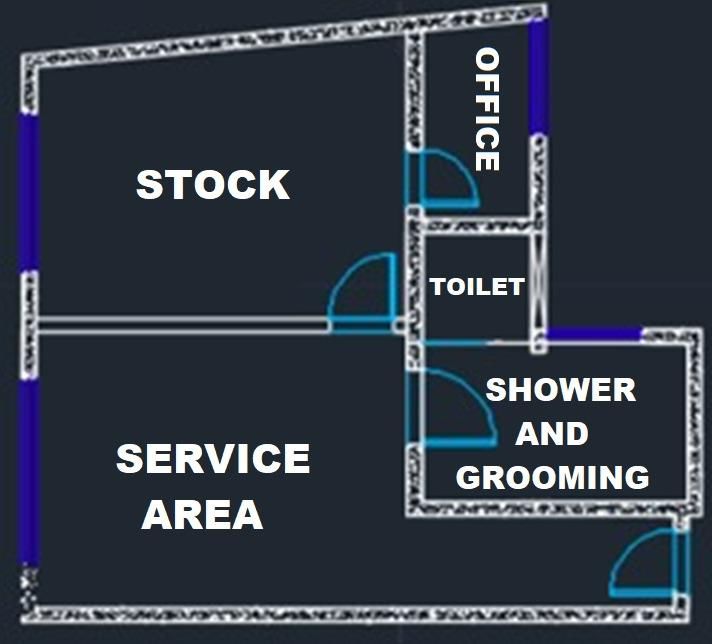
International Journal for Innovation Education and Research www.ijier.net Vol:-8 No-08, 2020

not all items are of equal importance, with more significant items that should be prioritized according to
demand, profit and sales price [9].
After completing the data analysis, the economic lot buying model was applied to the products prioritized
in the ABC classification, in order to compare the results obtained with the current results of the company
and propose the application of a replacement policy for the same.
Calculations were performed for: resupply cost and the annual inventory maintenance cost; safety stock;
the resupply point; the maximum stock; and comparison between the total cost of the current model and
the total cost of the economic purchase lot model.
As for the improvements, it was proposed to use and maintain the physical inventory spreadsheet, in order
to optimize the control of product inputs and outputs, since the company does not do this management.
Along with this spreadsheet, the use of visual management was proposed, in order to allow the control of
stock levels in the spreadsheet itself, where the column indicating the quantity in stock would signal the
owner which action to take, according to the following colors: green, indicating that the stock is at the
maximum level, yellow, in the safety stock, indicating the time to place the order with the supplier and red,
indicating the minimum stock level [10].
Another possibility for continuous improvement that was analyzed was the application of the 5s tool to
promote the reorganization of the stock and encourage the participation of employees in the application of
the 5 senses: Seiri (classification), separating products by families; Seiton (Organization), group the
products of the same family as well as identify them by means of labels; Seiso (cleaning), clean the stock
and products; Seiketsu (standardization and health) [11], in addition to organizing and cleaning, carrying
out possible repairs and maintenance on the stock structure; Shitsuke (self-discipline), consolidate the
previous four senses through training with employees and application of the PDCA cycle.

2.1 Characterization of the enterprise
The present project is focused on a retail company located in the city of Niterói, state of Rio de Janeiro
with the size of a micro company, according to Sebrae [12].
The company sells various types of animal products, such as dog food, cats, birds, rabbits and horses. There
are also other products such as collars, houses for dogs and cats, cages, aquariums, riding accessories,
among others. In addition, it offers bathing and grooming for pets and also has a delivery service for
neighborhoods located close to the store. Currently, this company seeks to remain in the competitive market,
as it has been facing a significant drop in sales of its products.
Its inauguration was in March 2014, when only the owner and his son worked, there is currently one
employee, that is, 3 people work at the company in a total area of 90m² organized as follows: service area,
where the products are exposed, bath and grooming area, owner's office, bathroom and stock. The
company's layout is illustrated in Figure 1.

International Educative Research Foundation and Publisher © 2020 pg. 627
International Journal for Innovation Education and Research www.ijier.net Vol:-8 No-08, 2020

 Figure 1. Organizational layout.
 Source: Authors.

The company did not have a management system and therefore had problems in the storage process of its
items due to the lack of organization and the quantity of products, which caused difficulties in the visibility
and distribution of the items in the stock space, as there was no standard storage and shelves.
Other important information are: store opening hours and days, working hours, salary and number of
employees, time for placing and receiving orders, responsible for ordering and checking orders, area of
store rooms and the lead time of the supplier according to Table 1.

 Table 1. Company characteristics.
 Operating days Monday to Friday
 Opening hours 8:30h to 20h
 Working hours 8 hours per day
 Number of workers 3
 Employee salary 1500 BRL
 Salary of the owner's son 2800 BRL
 Time to place an order 30 minutes
 Time to receive / check the order 4 hours
 Purchasing Manager Owner's son
 Conference officer Owner's son
 Supplier lead time 7 days
 Company area 90 m2
 Source: Authors.

International Educative Research Foundation and Publisher © 2020 pg. 628
International Journal for Innovation Education and Research www.ijier.net Vol:-8 No-08, 2020

3. Examination
After the physical inventory of the company's stock, some items were prioritized for better development of
the work according to the interview with the manager, where the 15kg dog food packages were defined as
products to be quantified and analyzed, due to the greater impact in terms of of space.
So these were accounted for and spread out with the following information: Product name, total quantity
in stock, expiration date and sales price, this information being collected by when carrying out the inventory
in the stock.
When carrying out the inventory in stock, they were accounted for and spread out with the following
information: Product name, total quantity in stock, expiration date and sales price. Demand history was
also considered based on notes that the owner makes for his daily cash control from January 2019 to
September 2019 (9 months), taking into account that the manager discards his notebook annually.
Because the manager does not know precisely which items generate the most profit for the company, it was
decided to apply the ABC curve in order to identify such products. A resupply policy was proposed with
the aim of assisting the owner on when and how much to buy with the use of Kanban cards, a system that
makes it possible to monitor and control stocks in a simplified manner that ensures sufficient stock levels,
without exaggeration and without lack, through the replacement of materials based on consumption and
lead time [13].
The stock was divided into: Green zone, which indicates the maximum stock level, that is, the product does
not need to be replaced or purchased; Yellow zone, which indicates the level of safety stock, that is, it is
the point of ordering; Red zone, which indicates the minimum stock level or critical zone, that is, it indicates
that the items present there are safe and need to be replaced, this card is used when there is a problem with
the replenishment time [14].
The disorganization of the products prevented the exact quantity of each product from being known,
generating unnecessary product purchases, losses of products due to expiration and thus losses of capital
and customers. And because he does not know what is in stock, the owner could not draw up strategies for
his company, because he does not have knowledge about what is his most strategic product, who is his
critical supplier, when is the right time to resupply among other problems
The difference between the selling price and the cost price was calculated in order to calculate the profit
per unit, and the sum of the profit of all the rations to know the total profit and to know the individual
percentage of each product by dividing the profit per unit by the total profit of the products.
Once this was done, the products were ordered in descending order based on the percentage value of profit
and thus the accumulated percentage of products was calculated and the ABC classification was performed
based on the accumulated percentage according to the results presented in Table 2.

 Table 2. ABC classification results
 Classes Quantity of products Proportion of products Proportion of Profit
 A 6 14% 30%
 B 16 24% 38%
 C 43 64% 32%
 Source: Authors.

International Educative Research Foundation and Publisher © 2020 pg. 629
International Journal for Innovation Education and Research www.ijier.net Vol:-8 No-08, 2020

It is possible to see that 14% of the products belong to class A, 24% belong to class B and 64% belong to
class C and that adding the results of the proportions of values of Class A and Class B we have a profit
margin of 68% , that is, 38% of the dog rations are responsible for 68% of the company's profit according
to the delimitation. Based on the analysis of the ABC curve exposed in the Figure 2, it is perceived that due
to the similarity of the data, it was not possible to reach the proportion of 80% of profits for 20% of products.
Then, this same analysis was made for all other indicators in the table, that is, ABC classifications were
made based on demand and sales price.

 Figure 2. ABC Curve Graphic
 Source: Authors

For the demand-based classification, the demands per unit were added up to the total demanded during the
9 months, being calculated the percentages per unit of product, that is, dividing the demand per unit by the
total demand and later the accumulated percentages were calculated. Thus, the classification was also made
regarding the sale price, using the same procedure that has its results summarized in Table 3 and Table 4.

 Table 3. ABC classification results for demanda
 Classes Quantity of Proportion of products Proportion of
 products Demand
 A 9 13% 20%
 B 23 33% 39%
 C 38 56% 41%
 Source: Authors.

 Table 4. ABC classification results for sales price
 Classes Quantity of Proportion of products Proportion of
 products Sales Price
 A 7 10% 19%
 B 22 32% 40%
 C 40 60% 41%
 Source: Authors.

International Educative Research Foundation and Publisher © 2020 pg. 630
International Journal for Innovation Education and Research www.ijier.net Vol:-8 No-08, 2020

The classification according to demand shows that 13% of the products belong to class A, 33% belong to
class B and 56% belong to class C, and that adding the results of the proportions of values of Class A and
Class B we have a percentage of demand of 59%, that is, 46% of the dog rations are responsible for 59%
of the demand of rations.
While the sales price shows that 10% of the products belong to class A, 32% belong to class B and 60%
belong to class C and that adding the results of the proportions of values of Class A and Class B we have a
percentage of selling price of 42%, that is, 42% of the dog rations are responsible for 59% of the profit
from the company's sales.
Priority was given to products that were repeated simultaneously, in Classes A and B, in the three analyzes,
totaling 21 items that are shown in Table 5.

 Table 5. Prioritized products
 Premier Fórmula - Cães filhotes
 Royal Canin Medium Adult
 Royal Canin – Giant Puppy
 Ração Royal Canin – Maxi Junior
 Ração Royal Canin – Maxi Adult
 Ração Royal Canin Canine Veterinary Diet Skin Care Small Dog
 Ração Royal Canin Canine Veterinary Diet Urinary S/O Cães
 Premier Ambientes Internos - Cães Adultos
 Royal Canin Medium Adult 7+
 Ração Royal Canin Veterinary Gastro Intestinal – Cães Adultos
 Ração Royal Canin Canine Veterinary Diet Renal Special para Cães
 Royal Canin Renal Veterinary Diet Cães
 Ração Royal Canin Veterinary Hepatic – Cães Adultos
 Premier Seleção Natural Batata Doce – Cães Adultos
 Premier Seleção Natural Frango – Cães Adultos Raças Pequenas
 Premier Raças Específicas Frango – Pitbull Adultos
 Premier Seleção Natural Frango – Cães Adultos Raças Pequenas
 Ração Royal Canin Veterinary Obesity – Cães Adultos
 Royal Canin Mini Adult
 Royal Canin Mini Indoor Adult
 Ração Royal Canin Canine Veterinary Diet Urinary S/O Cães
 Source: Authors

It was observed through this analysis that, unlike what was imagined by the management, the Premier brand
rations were the most significant, and Royal Canin has the greatest impact for the company. Since, among
the 21 products prioritized 88% of Royal Canin's variations are offered by the company and 66% of Premier
rations. Another analysis was regarding the number of brands sold by the store. Currently, the company has
14 feed brands, but only 2 brands were considered representative
International Educative Research Foundation and Publisher © 2020 pg. 631
International Journal for Innovation Education and Research www.ijier.net Vol:-8 No-08, 2020

During the interviews, the owner informed that there is no criterion for carrying out the replenishment of
products, with orders being made according to his experience, within a 30-day interval, that is, at the
beginning of each month, the products that are requested are visually out of stock in the store.
There is no minimum and maximum amount of animal feed per order and the time for delivery of orders is
7 days and all transport costs for delivery are attributed to the supplier.
It is noticeable that there is no need to restrict the number of orders, as there is no shipping cost for the
company and the lead time of the supplier is relatively short, allowing the batch size of each product to be
small and, therefore, to be carried out more orders throughout the month.
Thus, it was necessary to carry out a study to optimize the policy of resupply of the products that were
prioritized, for which the economic lot size, the safety stock and the reorder point for each prioritized item
were calculated.

4. Proposition of Management Tools
With the objective to maintain the organization of information about the company's stock, a spreadsheet
for stock control was proposed, as explained in Table 6.

 Table 6. Example spreadsheet to control stocks
 Inventory Control Worksheet

 Name Sale Price Cost Price Demand Quantity in stock Validity

 Source: Authors

Through the spreadsheet it is possible to keep the stock information organized and control the quantity of
materials and their expiration dates. With its operation in two stages: a first to register name, sales price
and cost, quantity in stock and validity of products; and a second, updating the quantities of registered
products as they are sold, as well as their demand.
It was proposed to check the physical inventory spreadsheet every six months and recommended the
periodic inventory for the company, validating the information from the inventory carried out in the present
study, which found during its check six products with an expiration date for the next 3 months. Therefore,
it was proposed that these products be exposed with a discount for sale and the action was carried out as a
record in Figure 3.

International Educative Research Foundation and Publisher © 2020 pg. 632
International Journal for Innovation Education and Research www.ijier.net Vol:-8 No-08, 2020

 Figure 3. Registration of the promotional action
 Source: Authors

The calculation of the economic lot size (ELZ) for the 21 products chosen was made from equation (1)
based on data from interviews and observations of: resupply cost (RC); product demand in the period (D);
the annual maintenance cost (aC)
 2∗ ∗
 = √

 (1)

The calculation of the ressuply cost was based on the following data: salary of the employee (S) responsible
for ordering the rations, which is equal to R $ 2,800.00, number of hours worked (NHW) in one month,
which is equal to 192 hours. For the calculation of the time (t) that the employee spends to place orders,
the follow-up was performed and the requisition time for three orders was timed to calculate the average
times, as shown in Table 7.

 Table 7. Order requisition time
 Month Time (Minutes)
 July 30
 August 28
 September 31
 Average 29,7
 Source: Authors.

Thus, on average, the time (t) that the employee spends to place an order is 30 minutes, that is, half an hour,
and this value should be applied to Equation 2, which represents the RC calculation.

International Educative Research Foundation and Publisher © 2020 pg. 633
International Journal for Innovation Education and Research www.ijier.net Vol:-8 No-08, 2020

 = (2)

Applying the values to the equation, the value of 7.29 BRL per order was reached. And based on the same
reasoning, the cost of receipt is calculated, since the same employee responsible for buying and receiving
orders has the same salary and number of hours worked. To calculate the receipt time, the receipt time of
three orders was timed and the average of the times was calculated, as can be seen in Table 8.

 Table 8. Order receipt time
 Month Time (Minutes) Time (Hours)
 July 230 3,833
 August 270 4,5
 September 290 4,833
 Average 4,4
 Source: Authors.

On average, the time (t) the employee spends to receive an order is 4 hours and 25 minutes. The equation
for calculating this cost is the same equation used for calculating the requisition cost, with which the amount
of 64.16 BRL per order is reached. And adding the requisition and receipt costs, the resupply cost is 71.45
BRL per order.
The annual demand was obtained through the notes of the owner of the inputs and outputs of the products
during the study period and can be seen in table 9.

 Table 9. Demand for prioritized products
 Annual demand
 Prioritized Products
 (bags)
 Premier Fórmula - Cães filhotes 180
 Royal Canin Medium Adult 142
 Royal Canin - Giant Puppy 142
 Ração Royal Canin - Maxi Junior 142
 Ração Royal Canin - Maxi Adult 142
 Ração Royal Canin Canine Veterinary Diet Skin Care Small Dog 142
 Ração Royal Canin Canine Veterinary Diet Urinary S/O Cães 142
 Premier Ambientes Internos - Cães Adultos 180
 Royal Canin Medium Adult 7+ 142
 Ração Royal Canin Veterinary Gastro Intestinal - Cães Adultos 142
 Ração Royal Canin Canine Veterinary Diet Renal Special para Cães 142
 Royal Canin Renal Veterinary Diet Cães 142
 Ração Royal Canin Veterinary Hepatic - Cães Adultos 142
 Premier Seleção Natural Batata Doce - Cães Adultos 180
 Premier Seleção Natural Frango - Cães Adultos Raças Pequenas 180

International Educative Research Foundation and Publisher © 2020 pg. 634
International Journal for Innovation Education and Research www.ijier.net Vol:-8 No-08, 2020

 Premier Raças Específicas Frango - Pitbull Adultos 180
 Premier Seleção Natural Frango - Cães Adultos Raças Pequenas 180
 Ração Royal Canin Veterinary Obesity - Cães Adultos 180
 Royal Canin Mini Adult 142
 Royal Canin Mini Indoor Adult 142
 Ração Royal Canin Canine Veterinary Diet Urinary S/O Cães 142
 Source: Authors

To calculate the annual cost of stock maintaining, the following were considered: capital opportunity costs
based on the cost of products in stock at the company's opportunity rate, considering a fixed income fund
with an average yield of 7% per year where the owner applies; and deterioration costs based on the 100%
effective obsolescence cost and one year validity [16].
The calculation of the capital opportunity cost for each prioritized product, which is relevant for the
company to know the loss of capital invested and paralyzed in stock, is shown in table 10.

 Table 10. Calculation of obsolescence cost
 Cost Price Opportunity Opportunity
 Prioritized Products
 (BRL) rate (BRL) cost (BRL)
 Premier Fórmula - Cães filhotes 109.90 7.69
 Royal Canin Medium Adult 189.90 13.29
 Royal Canin - Giant Puppy 194.90 13.64
 Ração Royal Canin - Maxi Junior 159.90 11.19
 Ração Royal Canin - Maxi Adult 159.90 11.19
 Ração Royal Canin Canine Veterinary Diet Skin Care
 159,.90 11.19
 Small Dog
 Ração Royal Canin Canine Veterinary Diet Urinary S/O
 159.90 11.19
 Cães
 Premier Ambientes Internos - Cães Adultos 89.90 6.29
 Royal Canin Medium Adult 7+ 194.90 13.64
 7%
 Ração Royal Canin Veterinary Gastro Intestinal - Cães
 159.90 11.19
 Adultos
 Ração Royal Canin Canine Veterinary Diet Renal Special
 159.90 11.19
 para Cães
 Royal Canin Renal Veterinary Diet Cães 159.90 11.19
 Ração Royal Canin Veterinary Hepatic - Cães Adultos 159.90 11.19
 Premier Seleção Natural Batata Doce - Cães Adultos 89.90 6.29
 Premier Seleção Natural Frango - Cães Adultos Raças
 89.90 6.29
 Pequenas
 Premier Raças Específicas Frango - Pitbull Adultos 89.90 6.29
 Premier Seleção Natural Frango - Cães Adultos Raças 89.90 6.29

International Educative Research Foundation and Publisher © 2020 pg. 635
International Journal for Innovation Education and Research www.ijier.net Vol:-8 No-08, 2020

 Pequenas
 Ração Royal Canin Veterinary Obesity - Cães Adultos 159.90 11.19
 Royal Canin Mini Adult 155.90 10.91
 Royal Canin Mini Indoor Adult 149.90 10.49
 Ração Royal Canin Canine Veterinary Diet Urinary S/O
 159.90 11.19
 Cães
 Source: Authors

Table 11 shows the calculation made by multiplying the cost of effective obsolescence by the cost price of
the prioritized products.

 Table 11. Calculation of obsolescence cost
 Cost of
 Cost Price Validity Deterioration
 Prioritizes products effective
 (BRL) (months) Cost (BRL)
 deterioration
 Premier Fórmula - Cães filhotes 109,90 12 109,90
 Royal Canin Medium Adult 189,90 12 189,90
 Royal Canin - Giant Puppy 194,90 12 194,90
 Ração Royal Canin - Maxi Junior 159,90 12 159,90
 Ração Royal Canin - Maxi Adult 159,90 12 159,90
 Ração Royal Canin Canine Veterinary Diet Skin
 159,90 12 159,90
 Care Small Dog
 Ração Royal Canin Canine Veterinary Diet
 159,90 12 159,90
 Urinary S/O Cães
 Premier Ambientes Internos - Cães Adultos 89,90 12 89,90
 Royal Canin Medium Adult 7+ 194,90 12 194,90
 Ração Royal Canin Veterinary Gastro Intestinal - 100%
 159,90 12 159,90
 Cães Adultos
 Ração Royal Canin Canine Veterinary Diet Renal
 159,90 12 159,90
 Special para Cães
 Royal Canin Renal Veterinary Diet Cães 159,90 12 159,90
 Ração Royal Canin Veterinary Hepatic - Cães
 159,90 12 159,90
 Adultos
 Premier Seleção Natural Batata Doce - Cães
 89,90 12 89,90
 Adultos
 Premier Seleção Natural Frango - Cães Adultos
 89,90 12 89,90
 Raças Pequenas
 Premier Raças Específicas Frango - Pitbull
 89,90 12 89,90
 Adultos
International Educative Research Foundation and Publisher © 2020 pg. 636
International Journal for Innovation Education and Research www.ijier.net Vol:-8 No-08, 2020

 Premier Seleção Natural Frango - Cães Adultos
 89,90 12 89,90
 Raças Pequenas
 Ração Royal Canin Veterinary Obesity - Cães
 159,90 12 159,90
 Adultos
 Royal Canin Mini Adult 155,90 12 155,90
 Royal Canin Mini Indoor Adult 149,90 12 149,90
 Ração Royal Canin Canine Veterinary Diet
 159,90 12 159,90
 Urinary S/O Cães
 Source: Authors

From the values presented, it was possible to arrive at the value of the annual cost of stock maintaining (aC)
by adding the opportunity cost of capital with the cost of deterioration, according to Table 12.

 Table 12. Annual stock maintenance cost
 Custo de Custo de Custo anual de
 Produtos Priorizados Oportunidade deteriorização manutenção
 (BRL) (BRL) (Ca) (BRL)
 Premier Fórmula - Cães filhotes 7.69 109.90 117.59
 Royal Canin Medium Adult 13.29 189.90 203.19
 Royal Canin - Giant Puppy 13.64 194.90 208.54
 Ração Royal Canin - Maxi Junior 11.19 159.90 171.09
 Ração Royal Canin - Maxi Adult 11.19 159.90 171.09
 Ração Royal Canin Canine Veterinary Diet Skin
 11.19 159.90 171.09
 Care Small Dog
 Ração Royal Canin Canine Veterinary Diet Urinary
 11.19 159,90 171.09
 S/O Cães
 Premier Ambientes Internos - Cães Adultos 6.29 89.90 96.19
 Royal Canin Medium Adult 7+ 13.64 194.90 208.54
 Ração Royal Canin Veterinary Gastro Intestinal -
 11.19 159.90 171.09
 Cães Adultos
 Ração Royal Canin Canine Veterinary Diet Renal
 11.19 159.90 171.09
 Special para Cães
 Royal Canin Renal Veterinary Diet Cães 11.19 159.90 171.09
 Ração Royal Canin Veterinary Hepatic - Cães
 11.19 159.90 171.09
 Adultos
 Premier Seleção Natural Batata Doce - Cães Adultos 6.29 89.90 96.19
 Premier Seleção Natural Frango - Cães Adultos
 6.29 89.90 96.19
 Raças Pequenas
 Premier Raças Específicas Frango - Pitbull Adultos 6.29 89.90 96.19
 Premier Seleção Natural Frango - Cães Adultos 6.29 89.90 96.19
International Educative Research Foundation and Publisher © 2020 pg. 637
International Journal for Innovation Education and Research www.ijier.net Vol:-8 No-08, 2020

 Raças Pequenas
 Ração Royal Canin Veterinary Obesity - Cães
 11.19 159.90 171.09
 Adultos
 Royal Canin Mini Adult 10.91 155.90 166.81
 Royal Canin Mini Indoor Adult 10.49 149.90 160.39
 Ração Royal Canin Canine Veterinary Diet Urinary
 11.19 159.90 171.09
 S/O Cães
 Source: Authors

With the results of calculations of resupply costs, annual maintenance costs and demand data, it was
possible to calculate the economic lot size of the priority feeds as shown in Table 13.

 Table 13. Calculation of economic lot size
 Resupply
 Demand Economic
 Cost (RC) Maintenance
 Prioritized Products (D) Lot Size
 (per order) Cost (aC)
 (annual) (ELZ)
 (BRL) (annual)
 Premier Fórmula - Cães filhotes 180 117.59 15
 Royal Canin Medium Adult 142 203.19 10
 Royal Canin - Giant Puppy 142 208.54 10
 Ração Royal Canin - Maxi Junior 142 171.09 11
 Ração Royal Canin - Maxi Adult 142 171.09 11
 Ração Royal Canin Canine Veterinary Diet Skin Care
 142 171.09 11
 Small Dog
 Ração Royal Canin Canine Veterinary Diet Urinary
 142 171.09 11
 S/O Cães
 Premier Ambientes Internos - Cães Adultos 180 96.19 16
 71.45
 Royal Canin Medium Adult 7+ 142 208.54 10
 Ração Royal Canin Veterinary Gastro Intestinal - Cães
 142 171.09 11
 Adultos
 Ração Royal Canin Canine Veterinary Diet Renal
 142 171.09 11
 Special para Cães
 Royal Canin Renal Veterinary Diet Cães 142 171.09 11
 Ração Royal Canin Veterinary Hepatic - Cães Adultos 142 171.09 11
 Premier Seleção Natural Batata Doce - Cães Adultos 180 96,19 16
 Premier Seleção Natural Frango - Cães Adultos Raças
 180 9619 16
 Pequenas

International Educative Research Foundation and Publisher © 2020 pg. 638
International Journal for Innovation Education and Research www.ijier.net Vol:-8 No-08, 2020

 Premier Raças Específicas Frango - Pitbull Adultos 180 96.19 16
 Premier Seleção Natural Frango - Cães Adultos Raças
 180 96.19 16
 Pequenas
 Ração Royal Canin Veterinary Obesity - Cães Adultos 180 171.09 12
 Royal Canin Mini Adult 142 166.81 11
 Royal Canin Mini Indoor Adult 142 160.39 11
 Ração Royal Canin Canine Veterinary Diet Urinary
 142 171.09 11
 S/O Cães
 Source: Authors

After calculating the quantities of feed bags that must be purchased in each order so that the total annual
cost is minimized, the time to place an order was also calculated through the safety stock (SS) and the
resupply point (Rp). For the calculation of SS, was used the equation 3, where D is Demand and L is the
supplier’s Lead-time.
 = ∗ (3)
Thus, the safety stock of each product was calculated as shown in Table 14.

 Table 14. Calculation of safety stock
 Average
 Lead time Safety
 Prioritized Products daily
 (days) Stock
 demand

 Premier Fórmula - Cães filhotes 0,5 4

 Royal Canin Medium Adult 0,4 3

 Royal Canin - Giant Puppy 0,4 3

 Ração Royal Canin - Maxi Junior 0,4 3

 Ração Royal Canin - Maxi Adult 0,4 3

 Ração Royal Canin Canine Veterinary Diet Skin Care Small Dog 0,4 3
 7
 Ração Royal Canin Canine Veterinary Diet Urinary S/O Cães 0,4 3

 Premier Ambientes Internos - Cães Adultos 0,5 4

 Royal Canin Medium Adult 7+ 0,4 3

 Ração Royal Canin Veterinary Gastro Intestinal - Cães Adultos 0,4 3

 Ração Royal Canin Canine Veterinary Diet Renal Special para
 3
 Cães 0,4

International Educative Research Foundation and Publisher © 2020 pg. 639
International Journal for Innovation Education and Research www.ijier.net Vol:-8 No-08, 2020

 Royal Canin Renal Veterinary Diet Cães 0,4 3

 Ração Royal Canin Veterinary Hepatic - Cães Adultos 0,4 3

 Premier Seleção Natural Batata Doce - Cães Adultos 0,5 4

 Premier Seleção Natural Frango - Cães Adultos Raças Pequenas 0,5 4

 Premier Raças Específicas Frango - Pitbull Adultos 0,5 4

 Premier Seleção Natural Frango - Cães Adultos Raças Pequenas 0,5 4

 Ração Royal Canin Veterinary Obesity - Cães Adultos 0,5 4

 Royal Canin Mini Adult 0,4 3

 Royal Canin Mini Indoor Adult 0,4 3

 Ração Royal Canin Canine Veterinary Diet Urinary S/O Cães 0,4 3
 Source: Authors

To calculate the replacement point, the supplier's lead time and monthly demand were multiplied and
subsequently added to the safety stock according to equation 4.
 = ( . ) + (4)

The results can be seen in Table 15.

 Table 15. Calculation of replacement point
 Lead
 Lead
 Monthly Safety time x Replacement
 Prioritized Products time
 demand Stock Montly Point
 (month)
 demanda
 Premier Fórmula - Cães filhotes 15 4 4 8
 Royal Canin Medium Adult 12 3 3 6
 Royal Canin - Giant Puppy 12 3 3 6
 Ração Royal Canin - Maxi Junior 12 3 3 6
 Ração Royal Canin - Maxi Adult 12 3 3 6
Ração Royal Canin Canine Veterinary Diet Skin
 12 0,25 3 3 6
 Care Small Dog
 Ração Royal Canin Canine Veterinary Diet
 12 3 3 6
 Urinary S/O Cães
 Premier Ambientes Internos - Cães Adultos 15 4 4 8
 Royal Canin Medium Adult 7+ 12 3 3 6
Ração Royal Canin Veterinary Gastro Intestinal - 12 3 3 6

International Educative Research Foundation and Publisher © 2020 pg. 640
International Journal for Innovation Education and Research www.ijier.net Vol:-8 No-08, 2020

 Cães Adultos
Ração Royal Canin Canine Veterinary Diet Renal
 12 3 3 6
 Special para Cães
 Royal Canin Renal Veterinary Diet Cães 12 3 3 6
 Ração Royal Canin Veterinary Hepatic - Cães
 12 3 3 6
 Adultos
 Premier Seleção Natural Batata Doce - Cães
 15 4 4 8
 Adultos
 Premier Seleção Natural Frango - Cães Adultos
 15 4 4 8
 Raças Pequenas
 Premier Raças Específicas Frango - Pitbull
 15 4 4 8
 Adultos
 Premier Seleção Natural Frango - Cães Adultos
 15 4 4 8
 Raças Pequenas
 Ração Royal Canin Veterinary Obesity - Cães
 15 4 4 8
 Adultos
 Royal Canin Mini Adult 12 3 3 6
 Royal Canin Mini Indoor Adult 12 3 3 6
 Ração Royal Canin Canine Veterinary Diet
 12 3 3 6
 Urinary S/O Cães
 Source: Authors

To calculate the maximum stock the ELZ and the Rp were added, and with them the values of the maximum
stock and the current stock of the company, reaching the value of the excess stock that the company
maintains, as shown in Table 16.

 Table 16. Calculation of maximum stock

 Economic
 Replacement Maximum Current Excess
 Prioritized Products Lot Size
 Poin Stock Stock Stock
 (ELZ)

 Premier Fórmula - Cães filhotes 8 15 22 70 48
 Royal Canin Medium Adult 6 10 16 40 24
 Royal Canin - Giant Puppy 6 10 16 35 19
 Ração Royal Canin - Maxi Junior 6 11 17 22 5
 Ração Royal Canin - Maxi Adult 6 11 17 23 6
 Ração Royal Canin Canine Veterinary Diet
 6 11 17 20 3
 Skin Care Small Dog
 Ração Royal Canin Canine Veterinary Diet
 6 11 17 40 23
 Urinary S/O Cães

International Educative Research Foundation and Publisher © 2020 pg. 641
International Journal for Innovation Education and Research www.ijier.net Vol:-8 No-08, 2020

 Premier Ambientes Internos - Cães Adultos 8 16 24 36 12
 Royal Canin Medium Adult 7+ 6 10 16 37 21
 Ração Royal Canin Veterinary Gastro
 6 11 17 55 38
 Intestinal - Cães Adultos
 Ração Royal Canin Canine Veterinary Diet
 6 11 17 58 41
 Renal Special para Cães
 Royal Canin Renal Veterinary Diet Cães 6 11 17 50 33
 Ração Royal Canin Veterinary Hepatic - Cães
 6 11 17 54 37
 Adultos
 Premier Seleção Natural Batata Doce - Cães
 8 16 24 51 27
 Adultos
 Premier Seleção Natural Frango - Cães
 8 16 24 30 6
 Adultos Raças Pequenas
 Premier Raças Específicas Frango - Pitbull
 8 16 24 29 5
 Adultos
 Premier Seleção Natural Frango - Cães
 8 16 24 27 3
 Adultos Raças Pequenas
 Ração Royal Canin Veterinary Obesity - Cães
 8 12 20 30 10
 Adultos
 Royal Canin Mini Adult 6 11 17 30 13
 Royal Canin Mini Indoor Adult 6 11 17 32 15
 Ração Royal Canin Canine Veterinary Diet
 6 11 17 34 17
 Urinary S/O Cães
 Source: Authors

It was confirmed that the company maintains high levels of inventories, has been wasting capital and space.
From which a comparative analysis was made between the company's current stock investment and the
investment proposed by ELZ according to Table 17.

 Table 17. Analysis of the amounts invested in stock
 Maximum Current Cost
 Prioritized Products Stock Value Stock Value reduction
 (BRL) (BRL) (BRL)
 Premier Fórmula - Cães filhotes 2,449.65 7,693.00 5,243.35
 Royal Canin Medium Adult 3,021.29 7,596.00 4,574.71
 Royal Canin - Giant Puppy 3,075.69 6,821.50 3,745.81
 Ração Royal Canin - Maxi Junior 2,687.45 3,517.80 830.35
 Ração Royal Canin - Maxi Adult 2,687.45 3,677.70 990.25
 Ração Royal Canin Canine Veterinary Diet Skin Care 2,687.45 3,198.00 510.55

International Educative Research Foundation and Publisher © 2020 pg. 642
International Journal for Innovation Education and Research www.ijier.net Vol:-8 No-08, 2020

 Small Dog
 Ração Royal Canin Canine Veterinary Diet Urinary S/O
 2,687.45 6,396.00 3,708.55
 Cães
 Premier Ambientes Internos - Cães Adultos 2,144.33 3,236.40 1,092.07
 Royal Canin Medium Adult 7+ 3,075.69 7,211.30 4,135.61
 Ração Royal Canin Veterinary Gastro Intestinal - Cães
 2,687.45 8,794.50 6,107.05
 Adultos
 Ração Royal Canin Canine Veterinary Diet Renal Special
 2,687.45 9,274.20 6,586.75
 para Cães
 Royal Canin Renal Veterinary Diet Cães 2,687.45 7,995.00 5,307.55
 Ração Royal Canin Veterinary Hepatic - Cães Adultos 2,687.45 8,634.60 5,947.15
 Premier Seleção Natural Batata Doce - Cães Adultos 2,144.33 4,584.90 2,440.57
 Premier Seleção Natural Frango - Cães Adultos Raças
 2,144.33 2,697.00 552.67
 Pequenas
 Premier Raças Específicas Frango - Pitbull Adultos 2,144.33 2,607.10 462.77
 Premier Seleção Natural Frango - Cães Adultos Raças
 2,144.33 2,427.30 282.97
 Pequenas
 Ração Royal Canin Veterinary Obesity - Cães Adultos 3,159.83 4,797.00 1,637.17
 Royal Canin Mini Adult 2,641.87 4,677.00 2,035.13
 Royal Canin Mini Indoor Adult 2,572.95 4,796.80 2,223.85
 Ração Royal Canin Canine Veterinary Diet Urinary S/O
 2,687.45 5,436.60 2,749.15
 Cães
 TOTAL 54,905.67 116,069.70 61,164.03
 Source: Authors

With the values in Table 16, it can be seen that the use of the Economic Lot Size generated savings of
61,164.03 BRL, based on the company's current inventory levels. It is worth mentioning that this economy
refers only to the 21 items prioritized by the ABC Classification. This savings would be even greater if the
study included all the products in the store.

4.1 Organization and Resupply systematic
Aiming to control the company's stock in a simplified way and based on the calculation of the safety stock,
a visual management of the stock levels was proposed to optimize its control, so that everyone can identify
the point of resupply of the products.
A stock divided into three zones was proposed:
 • Green zone: The stock does not need replenishment, as it is at the maximum stock level;
 • Yellow zone: the stock is at the point of ordering, that is, at the safety stock level; and
 • Red zone: the safety stock is being consumed, that is, the situation is critical and the items need to
 be replaced urgently.
Based on the calculations made of the safety stock and the resupply point together with the product planning
International Educative Research Foundation and Publisher © 2020 pg. 643
International Journal for Innovation Education and Research www.ijier.net Vol:-8 No-08, 2020

and information, it will be possible to use visual management in this same organization. With the
maintenance of the information of product inputs and outputs, visual management can be applied in the
spreadsheet itself, so that the cells composed of the quantities of products stored are programmed to change
their color according to the stock level, that is, remaining green when the stock level is maximum, yellow
when the level reaches the safety stock and red when the safety stock is being consumed.
Knowing that the order point will be when the cells are yellow, the manager will know when to place an
order and which products to purchase, optimizing their investments and building a resupply systematic
with the daily control of product inputs and outputs in an automated spreadsheet.

4.2 5s Program
The use of the program is justified, as some negative points were noted during the research, such as:
Absence of systematic storage of products; Dirty stock; Products without identification; Absence of
cabinets, shelves and divisions; and Difficulty viewing products.
The application of the 5s will be divided into two stages: presentation meeting and application of the 5
senses. In the first, all workers will be brought together to introduce them to the 5s program, its importance
to the company, stimulate commitment and generate an action plan for its application with 5 steps that will
be exposed in the store to be more effective.
The next step and its 5 steps will be the application of each of the senses. Seiri (classification) being the
first, in which responsible for this sense would be responsible for separating the products by families.
The second sense is Seiton (organization), in which the person in charge will have the function of storing
the items of the same family in a specific place and identifying them by means of labels. It was proposed
that the organization be made by adopting shelving with shelves to optimize space and based on the FIFO
(first in first out) operation, ensuring that products stored for the longest time are dispatched beforehand,
avoiding risks of deterioration and obsolescence. In addition, allocating the products with the highest
demand close to the out of stock and the products with the lowest demand at the end of the stock, avoiding
further movement and optimizing replacement time.
In the third sense, Seiso (cleaning), the person in charge will clean the stocked products, the entire stock
area and the products in the service area. In Seiketsu (standardization and health), the responsibility is of
the owner, who must carry out an assessment of his facilities in order to verify the need for renovations or
repairs, the functioning of the lighting lamps and if any risks of product fall
The latter sense is responsible for the consolidation of all other senses, being linked to self-discipline,
Shitsuke is the reflection of all planning, training, application of all other senses and the discipline of the
owner and his employees to maintain the adopted 5S standard , and it is proposed that organizational
supervision be carried out throughout the end of the month.

5. Conclusion
In view of the relevance of the application of inventory management models, the contribution of this project
was noticeable, as it was possible to conclude that in the case study stock, there was excessive waste, which
proves to have a lean stock is less expensive, improves performance consequently makes the company

International Educative Research Foundation and Publisher © 2020 pg. 644
International Journal for Innovation Education and Research www.ijier.net Vol:-8 No-08, 2020

more competitive in the market. Soon, the research objective was achieved by using an economical lot size
model, in order to propose a new supply policy for the company.
With regard to academic contributions, this research contains some tools that can be used for inventory
management and process improvements, serving as a background for other cases, so it is important to be
collaborating as a reference model for both the environment and academic and society.
It is recommended that studies be carried out with all the other products of the same branch that were not
covered in the present study and develop mathematical models that verify the best replacement policy
according to the basic stock characteristics, case studies should be developed in other organizations in this
market sector and multiple cases are compared aiming that the results for companies in the sector can be
even better..

6. References
[1] B.V. Costa, F.R. Pinto, D.B. Alencar, A.P.T. Costa, and F.C.T. Amorim, “ABC Curve Application in
Materials Stock Optimization in a Restaurant in Manaus -Amazonas”, International Journal for Innovation
Education and Research, vol. 7, no. 10, Oct. 2019, pp. 70-81. https://doi.org/10.31686/ijier.vol7.iss10.1747
[2] J.S. Bizelli, and R. Barbosa, Noções Básicas de Importação. 9 Ed., Aduaneiras, São Paulo, 2002.
[3] A.M. Costa, A.K.M. Mattos, N.M. Rodrigues, and D.V. Barboza, “Aplicando a Modelagem de
Processos de Negócio em uma Retificadora de Motores em Cabo Frio-RJ”, Brazilian Journal of Production
Engineering, vol. 5, no. 2, Apr. 2019, pp. 130-142.
[4] M. A. B. Trindade, M. B. P. Nunes, T. dos S. Linhares, and R. M. Teixeira, “Gestão do Capital de Giro
em Micro e Pequenas Empresas”, Revista de Administração, Contabilidade e Economia, vol. 9, no 1-2,
May 2011, p. 231-250.
[5] A. M. Nascimento; M. S. Machado, R. S. A. Meneguelli, U. A. França, and Toledo, R. F., “Fatores
críticos de risco no gerenciamento logístico de alimentos perecíveis” Revista de Trabalhos Acadêmicos
Lusófona, vol. 2, no. 2, Jun. 2019, pp. 182-197.
[6] N. N. Bacha, “Writing the Argumentative Literary Review in EFL/ESL Contexts: A Critical Analysis
Perspective”. International Journal for Innovation Education and Research, vol. 7, no. 1, Jan. 2019, pp.
229-40, doi:10.31686/ijier.vol7.iss1.1309.
[7] Yin, R.K., Case Study Research: Design and Methods, SAGE, Thousand Oaks - CA, 2009 pp. 219
[8] D.R. Barreto, F. C. Peba, A. R. Calciolari, L. S. Almeida, “Identificação dos riscos inerentes a produção
de petróleo em águas profundas através da análise SWOT”, Revista de Trabalhos Acadêmicos Lusófona,
vol. 1, no. 1, Jul. 2018, pp. 56-67.
[9] A.K.M. Mattos, I.S. Silva, D.V. Barboza, W.A. Dias, and T.S Silva, “Aplicação da curva ABC ao
estoque de um restaurante em Saquarema – RJ”, Revista de Trabalhos Acadêmicos Lusófona, vol. 2, no. 1,
Mar. 2019, pp. 26-34.
[10] V. Carvalho, and M. M. Oliveira. Aplicação da curva de pareto associada ao sistema Kanban para o
gerenciamento de estoque numa indústria pública. Produção em Foco, vol. 7, no 2, Mar. 2018, 332-337
[11] R.C.S. Bandeira, A.A. Souza Junior, S.R. Bandeira, and M.A. Oliveira. “The Lean Healthcare
Approach in Health Services: A Systematic Review of the Literature”. International Journal for Innovation

International Educative Research Foundation and Publisher © 2020 pg. 645
International Journal for Innovation Education and Research www.ijier.net Vol:-8 No-08, 2020

Education and Research, vol. 8, no. 7, July 2020, pp. 14-30, doi:10.31686/ijier.vol8.iss7.2403.
[12] SEBRAE. Sobrevivência das empresas no Brasil, Sebrae, São Paulo, 2016, pp. 100.
[13] J.V.G.A. Leite, S.L.Cotrim, G.C.L. Leal, and E.V.C. Galdanez, “Melhoria de Processo Operacional
Utilizando Mapa de Fluxo de Valor em Uma Indústria Metal-Mecânica”. Revista FSA. vol. 14, no. 5, sep.
2017, pp. 146-170. http://dx.doi.org/10.12819/2017.14.5.8
[14] N.V. Syreyshchikova, and L.A. Semashko, "Gauges Manufacture Process Planning Automated Control
System at an Industrial Enterprise", Procedia Engineering, vol. 206, 2017, pp. 965-971.
https://doi.org/10.1016/j.proeng.2017.10.579
[15] D.C. Bowersox, D. Closs, M.B. Cooper, and J.C. Bowersox, Supply Chain Logistics Management,
McGraw-Hill, New York, 2012, pp. 496.
[16] S. Chopra, and P. Meindl, Supply Chain Management: Strategy, Planning, and Operation, Person
Education, Essex, 2016, pp. 528.

Copyright Disclaimer
Copyright for this article is retained by the author(s), with first publication rights granted to the journal.
This is an open-access article distributed under the terms and conditions of the Creative Commons
Attribution License (http://creativecommons.org/licenses/by/4.0/).

International Educative Research Foundation and Publisher © 2020 pg. 646
You can also read