The Cost of the Diet Study in Indonesia - March 2017 - World Food Programme
←
→
Page content transcription
If your browser does not render page correctly, please read the page content below

The Cost of the Diet Study in Indonesia

March 2017

                     1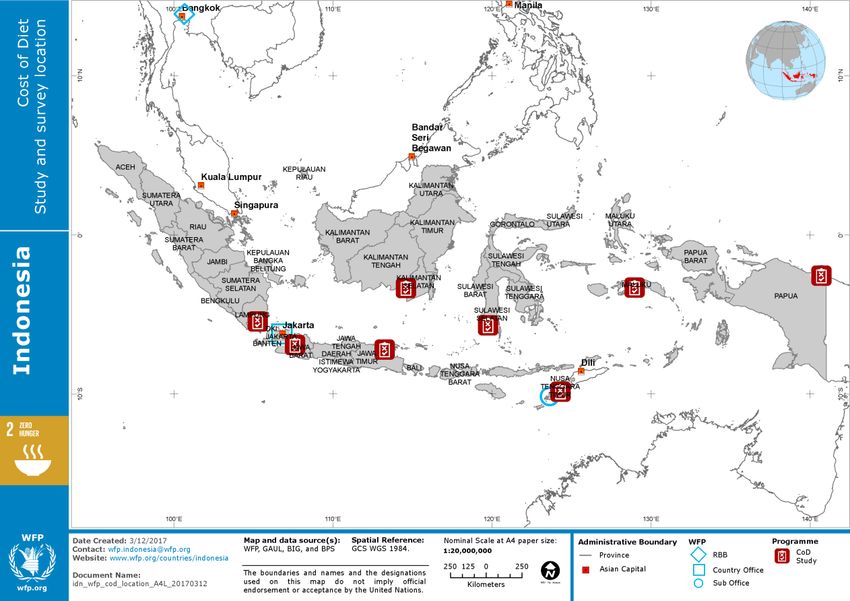
Table of Contents
Acronyms ................................................................................................................................................ 3
List of Tables ........................................................................................................................................... 4
List of Figures .......................................................................................................................................... 5
List of Annexes ........................................................................................................................................ 6
Executive Summary................................................................................................................................. 7
1. Introduction ...................................................................................................................................... 10
   1.1. Purpose of the study .................................................................................................................. 10
   1.2 Objectives of the Cost of the Diet study ..................................................................................... 11
2. Methods ............................................................................................................................................ 12
   2.1 Cost of the Diet method and software ....................................................................................... 12
   2.2 Data required and sources .......................................................................................................... 12
   2.3 Market survey to collect prices of fortified foods ...................................................................... 13
   2.4 Selection of fortified foods for inclusion in the scenario modelling ........................................... 14
   2.5 Specification of household size and composition ....................................................................... 15
   2.6 The diet analysed by the software .............................................................................................. 15
   2.7 Estimating the affordability of the diet....................................................................................... 16
   2.8 Modelling scenarios .................................................................................................................... 16
3. Results and Key Findings ................................................................................................................... 18
   3.1 Objective 1 .................................................................................................................................. 18
   3.2 Objective 2 .................................................................................................................................. 20
   3.3 Objective 3 .................................................................................................................................. 22
   3.4 Objective 4 .................................................................................................................................. 23
   3.5 Objective 5 .................................................................................................................................. 23
4. Recommendations and Conclusions ................................................................................................. 31

                                                                             2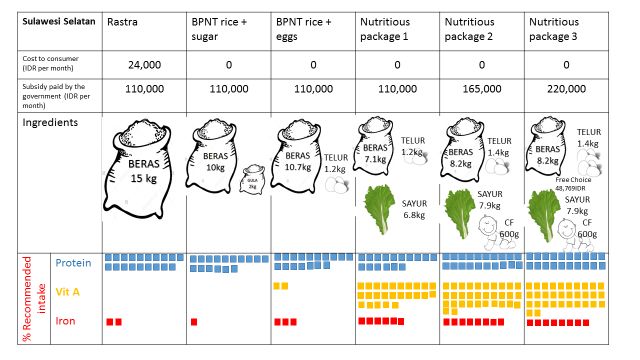
Acronyms

BAPPENAS    Indonesian Ministry of National Development Planning

BPNT        Bantuan Pangan Non-Tunai (non-cash food assistance)

BULOG       Badan Urusan Logistik (national logistics agency)

CotD        Cost of the Diet

EAR         Estimated Average Requirement

FAO         Food and Agriculture Organization

FSVA        Food Security and Vulnerability Atlas

IDR         Indonesian Rupiah

MoSA        Ministry of Social Affairs

PKH         Program Keluarga Harapan (Family Hope Programme)

PMT Bumil   Pemberian Makanan Tambahan Ibu Hamil (Complementary Feeding Programme –
            Pregnant Women)

RASKIN      Beras Rakyat Miskin (Rice for the poor)

RASTRA      Beras Rakyat Sejahtera (Rice for prosperity)

RNI         Recommended Nutrient Intake

SUSENAS     National Socioeconomic Survey

TNP2K       National Team for the Acceleration of Poverty Reduction

UNICEF      United Nations Children’s Fund

WFP         World Food Programme

WHO         World Health Organization

USD         United State Dollars

USDA        United States Department of Agriculture

                                              3
List of Tables

Table 1     The foods selected by the Cost of the Diet software for the staple-adjusted
            nutritious diet at the national level and for eight provinces…………………………….……19

Table 2     The daily, monthly and annual cost (IDR) of the staple-adjusted nutritious diet at the
            national level and for eight provinces…………………………………………………………………..21

Table 3     The estimated monthly cost of providing 600g of fortified complementary food for a
            child aged 6-23 months at a national and provincial level ………………………..…….……24

Table 4     The quantity (in kilograms) of each food provided in the six food basket options for
            the Rastra reform and the amount of money to be used to purchase other foods a
            month (IDR) …………………………………………………………………………………………………….…..25

Table 5     The monthly cost of the packages by province to provide the same quantities of
            foods and nutritional impact as the national level analysis………………………………….30

                                              4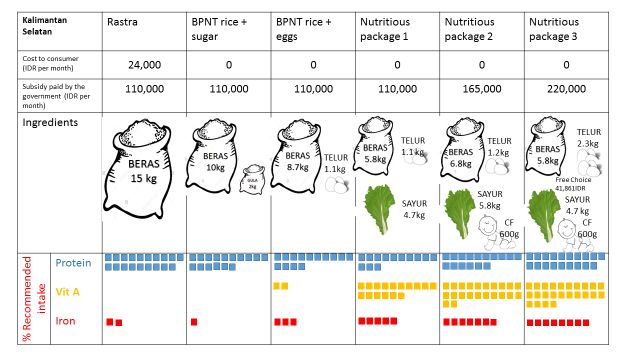
List of Figures

Figure 1    A map of Indonesia showing the market survey locations for the Cost of the Diet
            study…………………………………………………………………………………………………..……………..13

Figure 2    The percentage of 4 person households that cannot afford a staple adjusted
            nutritious diet at national and province level………………………………….…………………22

Figure 3    The percentage of recommended nutrients intakes provided by each package at a
            national level ……………………………………………………………………………………...………….28

Figure 4    The nutritional impact, in terms of proportion of nutrient requirements met, of
            providing 20 g per day of SUN or Cerelac fortified complementary food for a child
            aged 12-23 months……………………………………………………………………………..…………..29

                                             5
List of Annexes

Annex 1    SUSENAS food list and Cost of the Diet software equivalent and price per 100g in
           each province …………………………………………………………………………………………………32

Annex 2    A list of the markets visited in each district for the primary market survey data
           collection of fortified foods …………………………………………………………………………….36

Annex 3    A list of the fortified foods selected in each district surveyed and their cost per
           100g………………………………………………………………………………………………………………..37

Annex 4    The percentage of the recommended nutrient requirements that are met for each
           individual and the household in the staple-adjusted nutritious diet at a national level
           and for eight provinces, by the different foods selected by the software……….44

Annex 5    The limiting nutrients for the individual household members in the staple-adjusted
           nutritious diet at a national level and for eight provinces………………………………49

Annex 6    The percentage of the recommended nutrient intakes provided per month by the
           different food baskets for a household of 4 people at a national and provincial
           level………………………………………………………………………………………………………………51

Annex 7    The national level and provincial level visual summaries of the cost, food quantities
           and nutritional impact of the food packages where the cost of the foods in the
           packages is specific to the province………………………………………………………………60

Annex 8    The national level and provincial level visual summaries of the cost, food quantities
           and nutritional impact of the food packages where the quantities of the foods in the
           packages and the nutritional impact are fixed to that of the national level….65

                                              6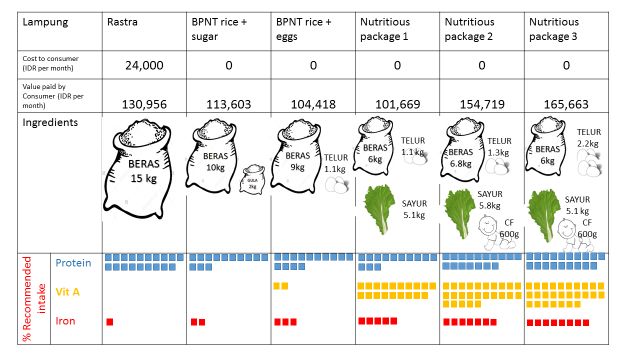
Executive Summary
Introduction and Study Objectives
The World Food Programme (WFP) has been approached by the Ministry of National Development
Planning (BAPPENAS) to conduct a Cost of the Diet study in the first quarter of 2017 with the
expectation that the results be used to inform the design of the Rastra transformation programme
(BPNT-Bantuan Pangan Non-Tunai) aiming to provide a more balanced, nutritious diet for the poor
and vulnerable people. The primary objectives of the study were:

1. To evaluate whether the foods available in local markets can meet the macro and micronutrient
   needs of households, particularly of those that include members of nutritionally vulnerable
   groups such as children under the age of 2 years and pregnant and lactating women
2. To estimate the lowest cost of a combination of locally available foods, including the main staple
   food (rice), that would meet the nutritional needs of all members of a household, including a
   child aged 12-23 months old, a breastfeeding woman, a man and an adolescent girl
3. To estimate the proportion of households that would be able to purchase this lowest-cost,
   locally available, nutritious diet, based on the amount of money per month they currently spend
   on food
4. To assess to what extent the unavailability and/or unaffordability of nutritious foods limits
   access to a nutritious diet
5. To contribute to informing the design of the BPNT to improve access to or availability of
   nutritious diets through:
       a. Identifying which locally available foods should be included in BPNT’s pre-determined
            local food basket with a voucher value of 110,000 IDR in order to meet the household
            members’ recommended nutrient intake in the most cost-effective way (called the
            Nutritious Package)
       b. Estimating what percentage of the WHO/FAO recommended nutrient intakes (RNIs)
            would be met for the household from the nutritious package and compare this to the
            current Rastra rice subsidy, BPNT rice and sugar, and BPNT rice and eggs package
       c. Estimating the potential impact that increasing the BPNT voucher transfer value to
            165,000 IDR and 220,000 IDR would have on the quantity and nutritional quality of the
            foods included in the pre-determined local food basket.

Methods
To calculate the cost per 100g of locally available fresh foods, the average household size and total
monthly household expenditure, data was sourced from the March 2016 National Socioeconomic
Survey (SUSENAS) dataset. These data were extrapolated from this dataset at a national level and for
the following eight provinces as agreed in consultation with BAPPENAS: Jawa Barat, Jawa Timur,
Kalimantan Selatan, Lampung, Maluku, Nusa Tenggara Timur, Papua and Sulawesi Selatan.

A staple-adjusted nutritious diet1 was calculated for a household of 4 people of the following
composition: child aged 12-23 months, adolescent girl aged 15-16 years, woman aged 30-59 years,
55 Kg, moderately active and lactating, and a man aged 30-59 years, 62 Kg and moderately active.

1
 This is the least expensive diet that meets the individual specific WHO/FAO recommended intakes of energy,
protein, fat, 9 vitamins and 4 minerals. This diet also includes the preferred staple food, which is rice in the
case of Indonesia. This diet also assumes that the child aged 12-23 months is receiving the recommended
portion of breast milk per day.

                                                       7
To calculate the affordability of this diet, the monthly cost was compared to the average monthly
household expenditure on food.

For fortified foods, the nutrient content and cost per 100g was collected through primary market
survey data collection in three markets and an Indomart and an Alfamart (where available) in one
district per selected province. Over 200 fortified foods from 5 food groups were found during the
market survey, 18 were chosen from each district based upon their availability, nutrient content and
cost and included in the staple-adjusted nutritious diet.
Six scenarios were modelled to provide a detailed analysis of the potential impact on cost and
affordability of the staple-adjusted nutritious diet: Rastra rice subsidy, BPNT rice and sugar (110,000
IDR), BPNT rice and eggs (110,000 IDR), Nutritious Package (110,000 IDR), Nutritious Package
(165,000 IDR) and Nutritious Package (220,000 IDR).

Key Findings and Recommendations
1. It is possible to consume a staple-adjusted nutritious diet using foods available in the local
   markets. Rice, eggs, tofu, fish, green leafy vegetables and fortified wheat flour and oil have been
   identified as inexpensive foods that are rich in nutrients
2. A staple-adjusted nutritious diet for the average household size of 4 people costs 1,191,883 IDR
   per month. Purchasing this diet from the local markets is the most expensive in Papua province
   (1,689,534 IDR) and the least expensive in Sulawesi Selatan province (1,023,655 IDR)
3. Based upon current food expenditure figures from the 2016 SUSENAS, 62% of the national
   population can afford a staple-adjusted nutritious diet. The affordability of this diet is highest in
   Kalimantan Selatan, where 76% of the population can afford this diet and lowest in NTT where
   only 32% of the population can afford this diet
4. Food availability is not a key barrier to households consuming a staple-adjusted nutritious diet.
   However, economic access to foods (affordability) is a key barrier. Other barriers to the
   consumption of a this diet may include knowledge of what foods are key sources of nutrients
   and preference for foods and drinks that are less nutritious, more expensive and/or more
   convenient
5. The recommended food basket for the Rastra transformation programme (BPNT) is rice, eggs
   and green leafy vegetables (called the nutritious package). This package with a voucher value
   worth 110,000 IDR per month has the greatest nutritional impact compared to the current
   Rastra programme, BPNT with rice and sugar, and BPNT with rice and eggs. It is strongly
   recommended that the BPNT does not provide a basket of rice and sugar as it will have very little
   nutritional impact due to the very low content of essential nutrients. Furthermore, given the
   rising overweight and obesity issue in Indonesia, where 12% of children under 5 years of age are
   overweight2 and 25% and 6% of adults are overweight and obese respectively3, a package of rice
   and sugar could contribute to further exacerbating this issue4.
6. If the voucher value was to increase by 50% (to 165,000 IDR) it is recommended that the
   nutritious package also includes 20g per day of a fortified complementary food for households

2 UNICEF, World Health Organization, World Bank. UNICEF-WHO-World Bank: 2014 Joint Child Malnutrition
Estimates: Levels and Trends (July 2015 update, except for India, which is September 2015 update)
3 World Health Organization Global Health Observatory Data Repository 2015. Available from

http://apps.who.int/gho/data/node.main.A897A?lang=en (accessed April 20, 2015).
4
  Shrimpton R. and C. Rokx, (2013) The Double Burden of Malnutrition in Indonesia, World Bank Jakarta,
Report 76192-ID

                                                    8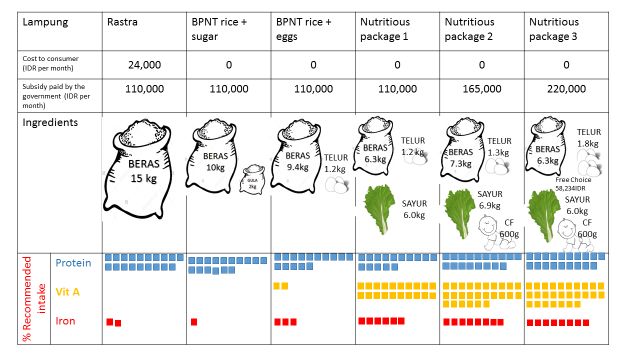
that have a child aged 6-23 months. If the voucher value was to increase by 100% (to 220,000
   IDR) is it recommended that the nutritious package also includes the fortified complementary
   food and that households can access the left over money as cash to be able to purchase other
   nutritious foods of their choice
7. The cost of the foods included in the Rastra, BPNT or nutritious packages, differs from province
   to province. This impacts a household’s ability to purchase the quantities required for nutritional
   impact in line with the national level analysis. This is particularly true for Papua, Maluku and
   NTT, where the cost of nutritious foods are much more expensive.
8. In the interest of equity and nutritional impact, WFP recommends that fixed quantities of foods
   be available for households to purchase regardless of the province in which BNPT recipients live.
   Thus the value of the voucher will need to be adapted according to the price of those foods at
   the provincial level. In some provinces (e.g. Jawa Barat and Jawa Timur) the cost of the voucher
   will be lower; in others (e.g. Papua and Maluku) it will be higher. WFP also recommends that the
   Government explore mechanisms for ensuring that food price volatility does not reduce the
   amount of food able to be purchased with the voucher.

                                                  9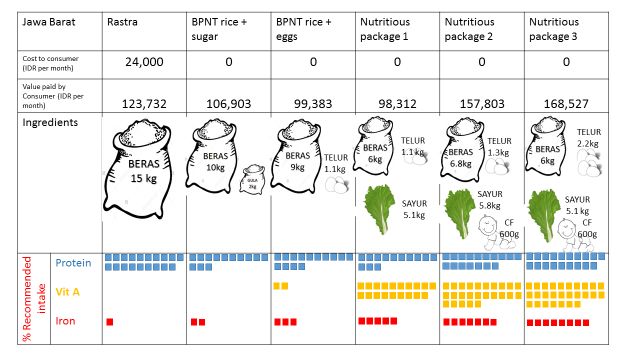
1. Introduction
1.1. Purpose of the study
Despite improvements over the past 10 years 16% of the population of Indonesia live on $1.25 a day
or less, whilst 43% of the population live on $2 a day or less, an indication that poverty remains a key
issue for human development5. The national prevalence of stunting in children under the age of 5
years, an indicator of child development is of high public health significance at 37% and the
prevalence of wasting for the same age group is of high public health significance at 12%6. Anemia in
women of reproductive age is of moderate public health significance with a prevalence of 23%7.
Achieving food security and improved nutrition for all Indonesians is possible, particularly if the
Government’s capacity to address malnutrition, adapt to climate change and prepare for disasters is
augmented. Food sovereignty and nutrition are central to the National Medium-Term Development
Plan (2015–2019).
The Government of Indonesia spends 0.7 percent of its annual Gross Domestic Product on social
assistance. These programs have been credited with reducing poverty, but to date have not been
found to have much impact on nutritional status. The World Food Programme (WFP) in Indonesia
offers technical assistance to support the Government of Indonesia to strengthen the monitoring
and evaluation capacity and the nutrition outcome for the national social assistance schemes,
namely Rastra8 and PKH9.
Rastra delivers 15 kg of rice per month to poor households at a fixed subsidized price of 1,600 IDR
per kilogram through BULOG. Rastra reaches approximately 25% of the population (15.5 million
households) per month and is the largest social assistance scheme in Indonesia, representing around
30 percent of the total social assistance public expenditure10 in 2015.
Rastra’s transformation agenda aims to provide a more balanced, nutritious diet for the poor and
vulnerable people. Following a pilot in 2016 by BAPPENAS and the National Team for the
Acceleration of Poverty Reduction (TNP2K) and guided by the implementation guidelines of Bantuan
Pangan Non-Tunai (BPNT11) Rastra’s in-kind rice assistance in 44 urban areas in 2017 will be
transformed into an e-voucher programme using banking networks and food outlets such as
cooperatives, small shops, E-Warongs, mini-markets and local merchants12. The basic feature of the
transformation is a non-cash ‘payment’ at a transfer value of 110,000 IDR per month per household.
The households shall be able to purchase rice and eggs with the voucher, but there is scope to
include other pre-determined foods13. The reformed programme is expected to be rolled out to all
urban and rural areas from 2018.

5
  World Bank, Development Research Group. World Development Indicators. World Databank 2015. Available
from http://data.worldbank.org/data-catalog/world-development-indicators (accessed April 27, 2017).
6
  Ministry of Health (2013) Riset Kesehatan Dasar 2013. Availible from
http://www.depkes.go.id/resources/download/general/Hasil%20Riskesdas%202013.pdf (accessed April 27,
2017)
7
  World Health Organization. 2015. The Global Prevalence of Anaemia in 2011. Geneva: WHO. Available from
http://www.who.int/nutrition/publications/micronutrients/global_prevalence_anaemia_2011/en/ (accessed
July 4, 2015).
8
  Rice Subsidy To The Poor or Beras untuk Rakyat Sejahtera, previously known as Raskin
9
  Family Hope Program- Program Keluarga Harapan
10
   18.9 trillion IDR or 1.4 billion USD in 2017 APBN book
11
   Translated as Non Cash Food Assistance
12
   Jakarta Globe: Jokowi Launches Non-Cash Food Aid Scheme for Marginalized Families, by Amal Ganesha
February 23, 2017. http://jakartaglobe.id/news/jokowi-launches-non-cash-food-aid-scheme-for-marginalized-
families/ Accessed on February 26, 2017
13
   As detailed in the Implementation Guidelines for Non-Cash Food Assistance (Pedoman Pelaksanaan Bantuan
Pangan Non-Tunai) 2017. The guideline defines food commodities as rice and eggs and suggests other types of

                                                    10
As part of the President’s drive to eventually unify the social assistance programmes under one card
providing “cashless” electronic payments, WFP was asked by the Indonesian Ministry of National
Development Planning (BAPPENAS) to conduct a Cost of the Diet (CotD) study to inform the decision
making process regarding the BPNT voucher value and the local foods that could be redeemed by
the voucher. This report summarizes the results from the Cost of the Diet study and makes
recommendations for these two key decisions.
1.2 Objectives of the Cost of the Diet study
The objectives for this Cost of the Diet study are as follows:
1. To evaluate whether the foods available in local markets can meet the macro and micronutrient
needs of households, particularly of those that include members of nutritionally vulnerable
groups such as children under the age of 2 years and pregnant and lactating women
2. To estimate the lowest cost of a combination of locally available foods, including the main staple
food (rice), that would meet the nutritional needs of all members of a household, including a
child aged 12-23 months old, a breastfeeding woman, a man and an adolescent girl
3. To estimate the proportion of households that would be able to purchase this lowest-cost,
locally available, nutritious diet, based on the amount of money per month they currently spend
on food
4. To assess to what extent the unavailability and/or unaffordability of nutritious foods limits
access to a nutritious diet
5. To contribute to informing the design of the BPNT to improve access to or availability of
nutritious diets through:
a. Identifying which locally available foods should be included in BPNT’s pre-determined
local food basket with a voucher value of 110,000 IDR in order to meet the household
members’ recommended nutrient intake in the most cost-effective way (called the
Nutritious Package)
b. Estimating what percentage of the WHO/FAO recommended nutrient intakes (RNIs)
would be met for the household from the nutritious package and compare this to the
current Rastra rice subsidy, BPNT rice and sugar, and BPNT rice and eggs package
c. Estimating the potential impact that increasing the BPNT voucher transfer value to
165,000 IDR and 220,000 IDR would have on the quantity and nutritional quality of the
foods included in the pre-determined local food basket.
However, this study will not be able to answer the following questions:
Is there an adequate supply chain for selected local foods that are proposed for inclusion in the
BPNT food basket? And can vouchers be used to provide access?
Can all targeted households reach the outlets in order to redeem the e-voucher for the specific
nutritious local foods?
Are recommended nutritious local foods acceptable to the BPNT beneficiaries and how will they
use them (i.e. consumed by intended individuals, stored and prepared in correct way)?
commodities be added subject to further evaluation. Rice and sugar are being supplied in Feb 2017 during the BPNT
launching period.
112. Methods
2.1 Cost of the Diet method and software
The Cost of the Diet is a method and software developed by Save the Children UK to better
understand the extent to which poverty affects the ability to meet nutrient requirements, a
prerequisite to be free from undernutrition. The aim of the Cost of the Diet is to theoretically
calculate the amount, combination and overall cost of local foods that are needed to provide a
typical family with their average needs for energy and their recommended intakes of protein, fat and
micronutrients14. The foods selected by the software can help to understand which nutrients are the
hardest to obtain from locally available foods. The software can also identify the foods which are the
least expensive sources of energy and nutrients.
When the results from the Cost of the Diet are compared with income or expenditure data, the
affordability of a nutritious diet for a population can be estimated. This information can then be
used to assess if poverty prevents poor households obtaining a varied, nutritious diet and what
proportion and which members of the population are most at risk of insufficient economic access.
One of the most innovative aspects of the Cost of the Diet software is that potential interventions
can be modelled to estimate their impact on improving the quality and the affordability of the diet.
These results can be used to inform and influence policies and programs, such as the Rastra
transformation program (BPNT).
2.2 Data required and sources
The Cost of the Diet study required the following data:
The cost per 100g of locally available fresh foods
The cost per 100g of fortified foods
The average number of people in a household and which members are of interest (e.g. child
under two and breastfeeding woman)
Income or expenditure data in deciles
The cost per 100g of locally available fresh foods, the average household size and total monthly
expenditure data was sourced from the March 2016 National Socioeconomic Survey (SUSENAS)
dataset. Data was extrapolated from this dataset using IBM SPSS Statistics 20 at a national level and
for the following provinces as agreed in consultation with BAPPENAS:
Jawa Barat
Jawa Timur
Kalimantan Selatan
Lampung
Maluku
Nusa Tenggara Timur
Papua
Sulawesi Selatan
The quantity of 65 food purchased in units of kilograms, grams and milliliters and the amount of
money spent on these quantities per household per district, were converted to a cost per 100g.
Each of the 65 food items identified were then selected from the food composition database in
the Cost of the Diet software, prioritizing those foods found in the Indonesia, Bangladesh and
14
Refer to the Save the Children UK (2015) Cost of the Diet Practitioner Guide for more information
12United States Department of Agriculture (USDA) food tables15. The cost per 100g was then
entered into the software. A list of the 65 food items from the SUSENAS dataset, their Cost of
the Diet software equivalents and cost per 100g in each district are listed in Annex 1.
2.3 Market survey to collect prices of fortified foods
The nutrient content and cost per 100g of fortified foods was collected through primary market
survey data collection in three markets in each of the following districts in January 2017, shown in
Figure 1:
Banjar (Kalimantan Selatan: Rural)
Bandar Lampung (Lampung province: Urban)
Bandung (Jawa Barat province: Urban)
Central Maluku (Maluku province: Rural)
Jayapura district (Papua province: Urban)
Jeneponto (Sulawesi Selatan: Rural)
Sampang (Jawa Timur province: Rural)
Timor Tengah Selatan (Nusa Tenggara Timur province: Rural)
Figure 1. A map of Indonesia showing the market survey locations for the Cost of the Diet study
15
Foods from the Bangladesh food table were chosen if a food could not be found in the Indonesia food table
because Bangladesh is the most recently updated Asian food table (in the CotD software) and also the closest
country geographically to Indonesia (compared to the other food tables in the CotD software). Foods from the
USDA food table were also chosen if a food could not be found in the Indonesia or Bangladesh food tables
because these are the most scientifically reliable food tables developed
13A list of the markets visited in each district can be found in Annex 2. These districts, in the
provinces that had already been selected for the Cost of the Diet analysis, were selected based
on the relatively high number of households that are living below the poverty line16, the higher
prevalence of stunting in children under the age of 5 years17, the district priority based upon the
Food Security and Vulnerability Atlas (FSVA)18 conducted in 2015 and the number of very poor
households that are likely to be included in the BPNT programme19.
First, a list of all fortified food items available in the assessment district was developed using
information from key informants and the knowledge of the data collectors. This was followed by
a field trial in a local market in Jakarta city (data not included) where participants practiced data
collection methods whilst adding items to the food list. The resulting comprehensive food list
was then used to collect data on price, nutrient content, and weight in the markets.
To collect the information needed to estimate the cost per 100g of the fortified foods, market
traders were asked the price of each fortified food item that they sold at the moment the survey
was conducted. The weight of the packet as displayed on the food label was written into the
market survey questionnaire. Where possible, four traders were visited in each of the 3 markets,
to provide a sample size of up to 12 data points per district. Data collectors took pictures of the
nutrient composition displayed on the package, which was then converted into a nutrient
composition per 100g.
In addition to 3 local markets, data was also collected in an Indomart and an Alfamart store where
possible, as poor households are increasingly shopping at these mini-markets. Indomart data was
entered for Banjar, Bandar Lampung, Bandung, Jeneponto and Sampang districts. Alfamart data was
entered for Bandar Lampung, Bandung, Jeneponto and Sampang districts. The team in Banjar district
did not receive permission to collect data in Alfamart. These stores are not available in the other
three districts.
The quantitative price and weight data was entered into the Cost of Diet software by market for
each district. For every food, the software calculates the price per 100g for each price and weight
sample and then averages these data across the traders to give the final price per 100g for the food
item in a market, which were then used to average the price across markets per province.
2.4 Selection of fortified foods for inclusion in the scenario modelling
Over 200 fortified foods from 5 food groups20 were found during the market survey. As it was
unrealistic that all of these were selected for inclusion in the Cost of the Diet analysis, 18 were
chosen from each district based upon their greater availability, higher nutrient content and lower
cost. These foods were entered into the Cost of the Diet software with the fresh foods from the
SUSENAS dataset for the province associated with each district. For example, the fortified foods
collected in market surveys in Banjar district were added to the Cost of the Diet software analysis for
Kalimantan Selatan province. The selection of the fortified foods for the national analysis was based
16
Taken from the 2014 SUSENAS dataset
17
Taken from the 2013 Riskesdas survey 2013
18
http://documents.wfp.org/stellent/groups/public/documents/ena/wfp276251.pdf?_ga=1.89961307.195811
0165.1476709500
19
Based upon a survey from TNP2k in 2015
20
Grains and grain based products (including noodles), milk and milk products, sugars and confectionary,
beverages, and infant foods.
14upon the foods that were available in three or more districts. A list of the fortified foods chosen for
the analysis and their cost per 100g by district can be found in Annex 3.
2.5 Specification of household size and composition
The March 2016 SUSENAS data was used to determine the average household size for the selected
provinces. All but two provinces21 had an average household size of 4 people. To be able to compare
the results across the provinces, a household of 4 people was selected for all provinces. The national
average household size is also 4 people. The following household composition was used for the
analysis:
Child (either sex) 12-23 months, breastfeeding
Female 15-16 years22
Woman, 30-59y, 55kg, moderately active, lactating23
Man, 30-59y, 60kg, moderately active
2.6 The diet analysed by the software
A Staple-Adjusted Nutritious Diet was estimated for all the analyses. This is the least expensive diet
that meets the WHO/FAO recommended intakes for energy, protein, fat, 9 vitamins and 4 minerals.
This diet also includes the preferred staple food, which is rice in the case of Indonesia. Rice was
included in the diet at least once a day for all household members. All other foods in the food list (as
listed in Annex 1), apart from fortified wheat flour, maize flour and roots and tubers, were available
for the software to include up to three times per day. The inclusion of fortified wheat flour was
restricted to up to three times per week, to reflect typical consumption habits. Furthermore the
inclusion of roots and tubers was restricted to up to three times per week in the national level
analysis and all provinces except Papua and Maluku to reflect current consumption habits. As roots
and tubers are regularly consumed in Papua and Maluku, for these areas those foods were available
for the software to choose up to three times per day. Maize was included in the diet at least 3 times
per week in NTT, sweet potatoes were included in the diet at least 3 times per week in Papua, and
the cheapest variety of fish was included at least 3 times per week in Maluku, Papua, Kalimantan
Selatan and Sulawesi Selatan to reflect the consumption habits of the population in these provinces.
The portion sizes for each food selected were realistic for the household members’ age and sex as
determined by the Cost of the Diet software24. It was also assumed that the child aged 12-23 months
was receiving the age-specific recommended portion of breast milk per day (532g).
The software optimizes the diet to meet the Estimated Average Requirement (EAR) for energy, the
recommended percentage energy from fat and the Recommended Nutrient Intake (RNI) for protein,
vitamins and minerals. Energy requirements cannot be exceeded by the software but requirements
for the other nutrients can be. Upper limits have been set for fat, vitamin A, vitamin C, niacin,
calcium and iron, which the software cannot exceed in order to prevent obesity or toxicity. This diet
was analysed for the eight provinces and at national level.
21
Which had an average household size of 5 people
22
An adolescent girl was selected instead of a school aged child as her requirements for macro and
micronutrients are higher. Selecting this individual will ensure that the food basket determined for BNPT will
also cover the needs for the school aged child
23
The results for this woman will also be used as a proxy for a pregnant woman
24
Please refer to the Save the Children UK (2015) Cost of the Diet Practitioner’s Guidelines for more
information
152.7 Estimating the affordability of the diet
The cost of the diets become a more meaningful figure when compared with household’s purchasing
power. For the purpose of the affordability analysis, data from the March 2016 SUSENAS dataset
was used to compare the monthly cost of the staple-adjusted nutritious diets against food
expenditure.
Using IBM SPSS Statistics 20 software the average per capita food expenditure figure at a national
level and for the eight provinces was extracted and multiplied by 4 to calculate the average food
expenditure for a household of 4 people.
2.8 Modelling scenarios
Five scenarios were modelled to provide recommendations to the BAPPENAS regarding the Rastra
transformation programme (BPNT). For each model the reduction in the cost of the staple-adjusted
nutritious diet and the nutritional contribution of the local food baskets were analysed. These
scenarios were modelled at the national and provincial level.
2.8.1 Scenario 1: The potential impact of the current Rastra rice subsidy programme
To model the potential impact of the current rice subsidy programme, 15 kg of rice per month at a
fixed subsidized price of 725 IDR per 100g25 was entered into the staple-adjusted nutritious diet for a
household of 4 people.
2.8.2 Scenario 2: The potential impact of the BPNT pilot of a monthly voucher worth 110,000
IDR that includes a food basket of rice and sugar
To model the potential impact of the current BPNT pilot, 10 kg rice and 2 kg sugar, which is a fixed
provision, with a total fixed cost of 110,000 IDR, was included in the staple-adjusted nutritious diet
for a household of 4 people.
2.8.3 Scenario 3: The potential impact of the pilot BPNT pilot of a monthly voucher worth
110,000 IDR that includes a food basket of rice and eggs
To model the potential impact of the pilot BPNT programme in which poor households receive a
voucher of 110,000 IDR per month to purchase rice and eggs26, it was assumed that the entire
monetary value of the voucher would be spent on these foods, where 75% of the voucher would be
spent on rice and 25% would be spent on chicken eggs. The quantity of rice and eggs that could be
purchased with the voucher per month was calculated using the national and province-specific costs
of the two commodities per 100g from the March 2016 SUSENAS data and added to the staple-
adjusted nutritious diet for a household of 4 people.
2.8.4 Scenario 4: The potential impact of a monthly voucher of 110,000 IDR that includes rice
and other commodities identified by the Cost of the Diet software
To model the potential impact of a BPNT voucher with a cash value of 110,000 IDR that includes rice
and other commodities it was assumed that the entire monetary value of the voucher would be
spent on the foods chosen by the software. It was also assumed that 50% of the voucher would be
spent on rice, 25% on the cheapest animal product included by the software and 25% on another
food that the software choose as an inexpensive source of nutrients in the staple-adjusted nutritious
diet. The quantity of the selected foods that could be purchased with the voucher per month was
25
This is the price per 100g that the Government pays to BULOG to enable Rastra households to be able to
purchase the rice at a subsidized price of 160 IDR per 100g
26
At a non-subsidized cost
16calculated using the national and province specific cost per 100g from the March 2016 SUSENAS
data and added to the staple-adjusted nutritious diet for a household of 4 people.
2.8.5 Scenario 5: The potential impact of a monthly voucher of 165,000 IDR that includes rice
and other commodities identified by the Cost of the Diet software
As there is scope to potentially increase the monetary value of the BPNT voucher, the potential
impact of a 50% (165,000 IDR) increase in the voucher value was modelled on the same, but now
larger, food packages determined in scenario 3, with the inclusion of a 20g per day sachet of fortified
complementary food for a child aged 6-23 months.
The monthly cost of providing the fortified complementary food was added to 110,000 IDR and
whatever amount of money was leftover to provide a total voucher value of 165,000 IDR was
distributed to the foods selected for scenario 3 with the same assumptions (50% rice, 25% animal
source, 25% inexpensive source of nutrients). The quantity of the rice, animal source and other food
that could be purchased with the voucher per month was calculated using the national and province
specific cost per 100g from the March 2016 SUSENAS data and added to the staple-adjusted
nutritious diet for a household of 4 people.
2.8.6 Scenario 6: The potential impact of a monthly voucher of 220,000 IDR that includes rice
and other commodities identified by the Cost of the Diet software
To model the potential impact of a 100% (220,000 IDR) increase in the voucher value, the underlying
assumptions were changed slightly. For this voucher the foods included in scenario 5 were still
included. However the quantities of these foods were changed to ensure that this basket had the
same or superior nutritional impact compared to the Rastra rice subsidy and BPNT baskets and to
ensure that an adequate amount of money was left over to enable households to purchase other
nutritious foods of their preference.
The quantity of the rice, animal source and other food that could be purchased with the voucher per
month was calculated using the national and province specific cost per 100g from the March 2016
SUSENAS data and added to the staple-adjusted nutritious diet for a household of 4 people.
173. Results and Key Findings
3.1 Objective 1
It is possible to consume a staple-adjusted nutritious diet using foods available in the local markets
Rice, eggs, tofu, fish, green leafy vegetables and fortified wheat flour and oil have been identified
as relatively inexpensive foods that are rich in nutrients
The inclusion, by the CotD software, of two fortified foods in the staple-adjusted nutritious diet
emphasizes the importance of the national fortification of staple foods and indicates the potential
benefits that rice fortification could have on improving the nutrient intakes of the Indonesian
population
Vitamin B12, iron and calcium are the most expensive nutrients to purchase using locally available
foods and are likely to be deficient in the current diet
The Cost of the Diet software was able to create a diet that meets the WHO/FAO recommended
intakes for energy, protein, fat, 9 vitamins and 4 minerals for all members in the household, both at
national and provincial level (staple-adjusted nutritious diet). A range of 13 different foods (and
breastmilk for the child under 2 years of age) were selected in the assessment areas as the cheapest
source of nutrients27, as shown in Table 1. In addition to the staple (rice) the software identified
fortified wheat flour28, fortified oil29, a variety of roots and tubers, eggs, tofu, fish, and green leafy
vegetables as relatively inexpensive foods that are rich in essential micronutrients.
Rice, eggs and green leafy vegetables were identified as the foods able to meet the most nutritional
requirements for the lowest cost and should therefore be prioritized in programmes that aim to
improve the nutritional quality of the diet. These have been selected for the ‘Nutritious Package’
that was modeled for the BPNT programme.
Annex 4 shows the percentage of the recommended nutrient intakes that are met for each
individual and the household in the staple-adjusted nutritious diet and the percentage that each
food contributes to meeting nutrient requirements at a national level and for the eight provinces.
In particular rice was chosen as an inexpensive source of protein, water soluble B-group vitamins,
magnesium and zinc, whilst eggs were chosen as an important source of vitamin A, water soluble B-
group vitamins, vitamin B12 and iron. Green leafy vegetables such as cassava leaves, spinach and
mustard greens were identified as a rich source of vitamin A, vitamin C, folic acid, magnesium, iron
and zinc.
In addition, roots and tubers were found to provide energy as well as water soluble B-group vitamins
whilst tofu has been identified as a relatively inexpensive, rich source of protein, calcium,
magnesium and iron. Fish were identified as an important source of protein, niacin and vitamin B12.
The inclusion of two fortified foods (wheat flour30 and oil) emphasizes the importance of the
national fortification programme for staple foods to improve the nutrient intakes of a population. If
rice was also fortified, it could meet more of the nutrient requirements on a larger scale.
27
Found in the local markets as listed in the SUSENAS dataset.
28
Fortified with water soluble B-group vitamins, folic acid and iron
29
Fortified with vitamin A
30
It is more likely in this context that households will be consuming fortified flour through noodle
consumption.
18Table 1. The foods selected by the Cost of the Diet software for the staple-adjusted nutritious diet at the national level and for eight provinces
Green leafy
Fortified Sweet vegetables Fortified Breast
Rice wheat flour Maize potato Sago Taro Cassava Peanut Tofu/Tempeh Fish Egg (cassava leaf) oil milk
National X X X X X X X X X X X
Jawa Barat X X X X X X X X X X X
Jawa Timur X X X X X X X X X X X
Kalimantan Selatan X X X X X X X X X X
Lampung X X X X X X X X X X X
Maluku X X X X X X X X X X X
Nusa Tenggara Timur X X X X X X X X X X X X
Papua X X X X X X X X X X X
Sulawesi Selatan X X X X X X X X X X
19Limiting nutrients are defined as nutrients for which the diet meets the nutrient requirements by
exactly 100%. As these nutrients are the most expensive they are likely to be deficient in the current
diet, especially among households that cannot afford a staple-adjusted nutritious diet.
The analysis indicates that vitamin B12, iron and calcium, which are mainly contributed by animal
source foods, were the most difficult and expensive to meet for the household at a national and
provincial level. In addition, zinc was an expensive nutrient to meet for the child aged 12-23 months
at a national and provincial level, whilst vitamin B1 and pantothenic acid were expensive to meet for
certain individuals in certain provinces.
These foods and nutrients should therefore be prioritised in programmes that aim to improve the
nutritional quality of the diet. In this analysis the software has identified eggs, tofu, fish and green
leafy vegetables as locally available, less expensive, foods that are rich in these nutrients.
Annex 5 shows the limiting nutrients for each of the four individuals of the modeled household for
the staple-adjusted nutritious diet at a national and provincial level.
3.2 Objective 2
A staple-adjusted nutritious diet for the average household size of 4 people costs 1,191,883 IDR
per month
Purchasing a staple-adjusted nutritious diet from the local markets is the most expensive in
Papua province (1,689,534 IDR) and the least expensive in Sulawesi Selatan province 1,023,655
IDR)
An adolescent girl and a lactating woman are the most expensive individuals in the household to
purchase a staple-adjusted nutritious diet for
Table 2 presents the daily, monthly and annual cost of a staple-adjusted nutritious diet at a national
and provincial level for a household of 4 people and the breakdown of the cost per individual. At a
national level, the cost of a this diet was 1,191,883 IDR per month but at the provincial level the
monthly household costs ranged from 1,023,655 IDR in Sulawesi Selatan to 1,689,534 IDR in Papua.
Interestingly, the staple-adjusted nutritious diet for the adolescent girl and the lactating woman
were consistently shown to be the most expensive within the household, compared to the adult man
and the child aged 12-23 months. This is due to the increased requirements for energy and essential
micronutrients during adolescence that is required to support growth and development and during
lactation to ensure that the women remains well-nourished whilst producing high quality31 breast
milk for the child. Programming and policy interventions that are targeted at these nutritionally
vulnerable target groups and aim to improve their access and consumption of nutritious fresh foods
or fortified foods should be considered.
31
I.e. Breast milk that contains the nutrients required to support the growth of the child.
20Table 2. The daily, monthly and annual cost (IDR) of the staple-adjusted nutritious diet at the national level and for eight provinces
National Jawa Barat Jawa Timur Kalimantan Selatan Lampung
Average Average Average Average Average
Daily Monthly Daily Monthly Daily Monthly Daily Monthly Daily Monthly
Household member Cost Cost Annual Cost Cost Cost Annual Cost Cost Cost Annual Cost Cost Cost Annual Cost Cost Cost Annual Cost
Child 12-23 months 2,592 78,853 946,238 2,645 80,441 965,291 2,559 77,846 934,154 2,713 82,519 990,224 2,818 85,716 1,028,588
Female 15-16 years 13,562 412,512 4,950,138 13,413 407,985 4,895,820 12,757 388,017 4,656,202 13,823 420,446 5,045,351 14,195 431,757 5,181,084
Woman, 30-59y, 55kg moderately 13,846 421,156 5,053,869 13,461 409,444 4,913,327 12,879 391,726 4,700,709 14,149 430,367 5,164,407 13,883 422,273 5,067,275
active, lactating
Man, 30-59y, 60kg, moderately 9,185 279,363 3,352,350 8,914 271,149 3,253,785 9,098 276,722 3,320,664 9,565 290,921 3,491,048 8,951 272,274 3,267,291
active
Total 39,185 1,191,883 14,302,596 38,433 1,169,019 14,028,223 37,292 1,134,311 13,611,729 40,249 1,224,252 14,691,030 39,847 1,212,020 14,544,237
Maluku Nusa Tenggara Timur Papua Sulawesi Selatan
Average Average Average Average
Household member Daily Cost Monthly Cost Annual Cost Daily Cost Monthly Cost Annual Cost Daily Cost Monthly Cost Annual Cost Daily Cost Monthly Cost Annual Cost
Child 12-23 months 3,323 101,086 1,213,029 2,653 80,680 968,162 3,816 116,076 1,392,918 2,177 66,207 794,480
Female 15-16 years 16,838 512,142 6,145,703 14,622 444,747 5,336,961 19,239 585,173 7,022,080 11,634 353,856 4,246,277
Woman, 30-59y, 55kg moderately active, 16,911 514,387 6,172,645 14,854 451,808 5,421,691 19,169 583,060 6,996,724 11,860 360,731 4,328,774
lactating
Man, 30-59y, 60kg, moderately active 11,186 340,228 4,082,734 9,463 287,848 3,454,173 13,322 405,224 4,862,683 7,984 242,861 2,914,330
Total 48,258 1,467,843 17,614,110 41,592 1,265,082 15,180,988 55,546 1,689,534 20,274,405 33,654 1,023,655 12,283,861
213.3 Objective 3
Based on current food expenditure figures from the 2016 SUSENAS, 62% of the national
population can afford a staple-adjusted nutritious diet
The affordability of a staple-adjusted nutritious diet is highest in Kalimantan Selatan, where 76%
of the population can afford this diet
The affordability of a staple-adjusted nutritious diet is lowest in NTT where only 32% of the
population can afford this diet
Figure 2 shows the percentage of the population (at a national and provincial level) who, according
to data on food expenditure, do or do not have enough money to be able to afford to buy the lowest
cost, staple-adjusted, nutritious diet. This analysis indicates that at a national level, 62% of the
population can afford this diet but more than one third of the population (38%) cannot afford this
diet. NNT province presented the worst picture of affordability where it is estimated that only 32%
or the population can afford the staple-adjusted nutritious diet (68% of the population therefore
cannot afford this diet). Maluku and Papua also show low percentages of the population who can
afford this diet at 44% and 52% respectively. Kalimantan Selatan province showed the best picture of
affordability where it is estimated that 76% of the population can afford a staple-adjusted nutritious
diet.
Figure 2. The percentage of 4 person households that cannot afford a staple adjusted nutritious diet
at national and province level
223.4 Objective 4
Food availability is not a key barrier to households consuming a staple-adjusted nutritious diet
Economic access to foods (affordability) is a key barrier to household consuming a staple-adjusted
nutritious diet
Knowledge of what foods are key sources of nutrients and should therefore be prioritized for a
nutritious diet could also be a barrier to households consuming a nutritious diet, in addition to
other reasons such as food preferences and convenience
The Cost of the Diet software has been able to create a staple-adjusted nutritious diet using locally
available foods, which indicates that the availability of nutritious foods is not a key barrier to
households consuming a nutritious diet. However, the affordability analysis has shown that more
than one third of the national population (and higher proportions for 7 out of 8 provinces
researched) do not have enough money to be able to buy a nutritious diet, highlighting economic
access as a key barrier.
Furthermore, those who do have enough money to be able to afford a nutritious diet may not spend
their money on nutritious foods because of preference, convenience or knowledge. For example the
March 2016 SUSENAS data found that the food group with the highest percentage (14%) of
expenditure in Indonesia was ‘prepared foods and beverages’, which includes unhealthy foods such
as cookies, cakes and fizzy drinks. This data also showed that on average households purchased 1.4
kg of boiled or steamed cake, 3.2 kg of fried foods and 0.77 kg of snacks for a child (any age) such as
krupuk per week compared to 87 g of spinach, 47 g of mustard greens and 170 g of tofu. This
indicates that food choices could also be a key barrier to households consuming a nutritious diet.
More research is needed to understand what drives these choices.
3.5 Objective 5
The recommended food basket for the Rastra transformation programme (BPNT) is rice, eggs and
green leafy vegetables (called the nutritious package)
The nutritious package of rice, eggs and green leaves with a voucher value worth 110,000 IDR per
month has the greatest nutritional impact compared to the current Rastra programme, BPNT with
rice and sugar and BPNT with rice and eggs
It is strongly recommended that a basket of rice and sugar is not provided as part of the Rastra
transformation programme as it will have very little nutritional impact due to its low nutrient
content. Furthermore, given the rising overweight and obesity issue in Indonesia, where 12% of
children under 5 years of age are overweight32 and 25% and 6% of adults are overweight and
obese respectively33, a package of rice and sugar could contribute to further exacerbating this
issue34
If the voucher value was to increase by 50% (to 165,000 IDR) it is recommended that the nutritious
package also includes 20 g per day of a fortified complementary food35 for the child aged 6-23
months
If the voucher value was to increase by 100% (to 220,000 IDR) is it recommended that the
nutritious package with a fortified complementary food is included and that households can access
the left over money as cash to be able to purchase other nutritious foods of their choice
32 UNICEF, World Health Organization, World Bank. UNICEF-WHO-World Bank: 2014 Joint Child Malnutrition
Estimates: Levels and Trends (July 2015 update, except for India, which is September 2015 update)
33 World Health Organization Global Health Observatory Data Repository 2015. Available from
http://apps.who.int/gho/data/node.main.A897A?lang=en (accessed April 20, 2015).
34
Shrimpton R. and C. Rokx, (2013) The Double Burden of Malnutrition in Indonesia, World Bank Jakarta,
Report 76192-ID
35
Either SUN or Cerelac depending on what is available in the local markets
23You can also read