Appendix 8E Noise & Vibration Impacts - December 2010
←
→
Page content transcription
If your browser does not render page correctly, please read the page content below

Appendix 8E
  Noise & Vibration Impacts
  December 2010
APPENDIX 8E

Noise & Vibration Impacts

December 2010

Prepared for:               Prepared by:

20 Bay Street, Suite 901
Toronto ON M5J 2N8
                            In Association with: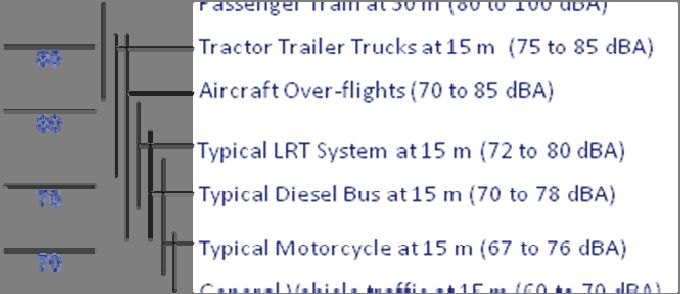
APPENDIX 8E
                                                    NOISE & VIBRATION IMPACTS
                                                        TABLE OF CONTENTS

EXECUTIVE SUMMARY ........................................................................................................................ iii
GLOSSARY OF TERMS .......................................................................................................................... iv
1.         INTRODUCTION ....................................................................................................................... 6
          1.1         Context ................................................................................................................................ 6
          1.2         GO Electrification Study ...................................................................................................... 6
          1.3         Noise & Vibration White Paper........................................................................................... 7
2.         OVERVIEW OF NOISE & VIBRATION CONSIDERATIONS ............................................................ 8
          2.1         Noise ................................................................................................................................... 8
          2.2         Vibration ........................................................................................................................... 13
3.         OBJECTIVES ADDRESSED BY DISCIPLINE ................................................................................. 16
4.         ASSUMPTIONS FOR THE NOISE AND VIBRATION ASSESSMENT .............................................. 17
5.         CRITERIA, INDICATORS, AND DATA SOURCES ......................................................................... 20
6.         ASSESSMENT OF OPTIONS ..................................................................................................... 25
          6.1         MOEE/GO Transit Draft Guideline .................................................................................... 25
          6.2         Determination of Zones of Influence ................................................................................ 26
          6.3         Assessment Results ........................................................................................................... 30
7.         CONCLUSIONS ....................................................................................................................... 35

                                                                   APPENDICES

Appendix 8E‐1 – References .................................................................................................. 37

i                           GO Electrification Study Final Report – Appendix 8E ‐ December 2010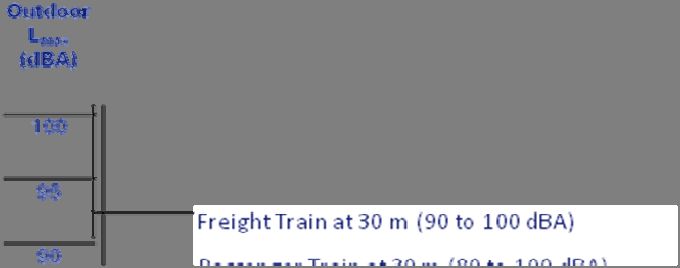
FIGURES
Figure 1 – Typical Maximum Passby Sound Levels of Various Transportation Sources ........... 11
Figure 2 – Example Decay of Sound Levels with Distance ...................................................... 12
Figure 3 – Vibration Velocity Parameters............................................................................... 13
Figure 4 – Typical Passby Vibration Levels of Various Transportation Sources ....................... 15
Figure 5 – Overview of GO Transit Rail Network .................................................................... 22
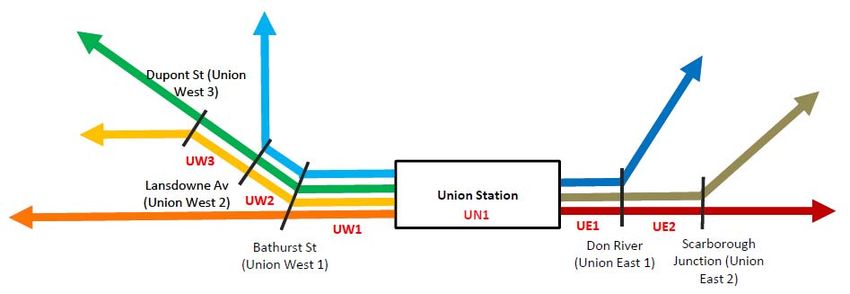
Figure 6 – GO Transit Rail Corridors near Union Station......................................................... 22
TABLES
Table 1 – Accepted Human Perception of Changes in Sound Level........................................... 9
Table 2 – Range of Sound Levels for Typical Noise Sources .................................................... 10
Table 3 – Summary of the Network Electrification Options Considered ................................. 18
Table 4 – Noise & Vibration Detailed Assessment Criteria, Indicators and Data Sources........ 20
Table 6 – Summary of Railway Operational Inputs ................................................................ 23
Table 7 – Summary of GO & ARL Noise and Vibration Emissions ........................................... 24
Table 8 – Summary of Setback Distances for Zones of Influence ............................................ 27
Table 9 – Summary of Assessment Results by Corridor and Segment .................................... 32
Table 10 – Scale for Qualitative Scoring ................................................................................. 33
Table 11 – Summary of the Magnitude of Effects of Electrification ........................................ 35
Table 12 – Overall Qualitative Scoring ................................................................................... 35
ii GO Electrification Study Final Report – Appendix 8E ‐ December 2010EXECUTIVE SUMMARY Metrolinx operates a comprehensive transportation system of bus and commuter rail lines in the Greater Toronto and Hamilton Area (GTHA). The system includes the GO rail network, which is an essential part of Metrolinx’s service to the area commuters. GO Transit currently provides commuter rail service on seven corridors in the GTHA, using conventional diesel locomotives and non‐powered, bi‐level coaches in push‐pull configuration. Metrolinx has initiated a study of the electrification of the entire GO Transit rail system as a future alternative to diesel trains now in service. The Electrification Study examines how the future GO rail services will be powered – using electricity, enhanced diesel technology or other means – when improved services are implemented in the future. The Electrification Study assesses the benefits and costs of a full range of technology options, including enhanced diesel, electric and alternative technologies. The Electrification Study considers the existing GO Transit network, the proposed network expansions to St. Catharines, Kitchener/Waterloo, Allandale, Bloomington, Bowmanville, as well as the future Pearson Air Rail Link via six short‐listed electrification options. The Electrification Study is intended to provide Metrolinx’s Board of Directors with the information needed to decide how GO trains will be powered in the future. As part of the overall evaluation, the effects of the new technologies on noise and vibration have been considered. The main objective of these studies is to consider the relative noise and vibration benefits of the various electrification options compared to a Reference Case that assumes Tier 4 diesel locomotives over the entire network. Screening‐level noise and vibration modeling was conducted for the Reference Case and electrification options over all the corridors. Modelling inputs, methodology, and assumptions are detailed in this White Paper. The results of the modeling were used to define “Zones of Influence” based on criteria contained in the MOEE / GO Transit Draft Protocol for Noise and Vibration Assessment (1994). The resulting Zones of Influence were used to identify potentially affected populations. An overall evaluation of each electrification option was then considered based on the affected populations and the predicted changes in the overall sound and vibration levels for each corridor. Based on the assessment results, there is a slight positive benefit for noise and vibration for two of the options (i.e., total or near‐total electrification of the entire rail network) due to the widespread electrification of multiple corridors. Other options remain neutral for noise and vibration, even though individual corridors within each option may see a slight positive benefit in switching from diesel to electric locomotives. iii GO Electrification Study Final Report – Appendix 8E ‐ December 2010
GLOSSARY OF TERMS

     Term                                  Definition
     A‐weighting                           A frequency weighting network used to simulate the relative
                                           response of the human ear to sound at typical outdoor ambient
                                           volume levels. It de‐emphasizes the high (i.e., 6.3 kHz and
                                           above) and low (i.e., below 1 kHz) frequencies, and emphasizes
                                           the frequencies between 1 kHz and 6.3 kHz.
     Airport Rail Link (ARL)               Express rail shuttle service between Union Station and Toronto
                                           Pearson International Airport.
     Background Ambient Noise              The background ambient noise level due to existing road traffic
     Level                                 and industrial noise sources.
     Day‐Night Average Sound Level         A 24‐hour time‐averaged Leq, adjusted by a 10 decibel penalty
     (DNL)                                 for sounds occurring during the night period (i.e., 23:00h and
                                           07:00h local time).
     Daytime                               Defined as the hours from 07:00h to 19:00h.
     Decibel (dB)                          A logarithmic measure of any physical quantity and commonly
                                           used in the measurement of sound. The decibel (dB) provides
                                           the possibility of representing a large span of values in a simple
                                           manner.
     Energy Equivalent Sound Level         An energy‐average level over a specified period of time that has
     (Leq)                                 the same sound energy as the actual fluctuating (i.e., unsteady)
                                           sound over the same period. The time period is generally
                                           included as a suffix to the label (i.e., Leq(24) for the 24 hour
                                           equivalent sound level). An Leq value expressed in dBA is a
                                           good, single value descriptor of the annoyance of noise.
     Evening                               Defined as the hours from 19:00h to 23:00h.
     Geographic Information System         Computer tool that captures, stores, analyzes, manages and
     (GIS)                                 presents data that are linked to physical locations. For example
                                           the mapping of population data.
     GTHA                                  Greater Toronto and Hamilton Area.
     Network Options                       An alternative to the Reference Case network, involving the use
                                           of a short listed rolling stock technology on one or more GO
                                           lines.
     Night                                 Defined as the hours from 23:00h to 07:00h.
     Noise                                 Any unwanted sound. "Noise" and "sound" are often used
                                           interchangeably for assessment purposes.
     Ontario Ministry of the               Provincial body mandated with developing, implementing and
     Environment (MOE, formerly            enforcing regulations and other programs and initiatives aimed
     MOEE)                                 at addressing environmental issues that have local, regional
                                           and/or global effects. Also formerly known as the Ontario
                                           Ministry of the Environment and Energy (MOEE).
     Peak Particle Velocity (PPV)          The maximum instantaneous peak velocity in a vibration signal.

iv                     GO Electrification Study Final Report – Appendix 8E ‐ December 2010
Term Definition
Reference Case The base case against which future technology and network
options are compared. This base case incorporates existing
attributes and approved/planned enhancements of GO’s rolling
stock, rail infrastructure and service levels.
Root‐Mean‐Square (RMS) The square root of the average of the squared amplitude of a
Velocity velocity signal.
Sound from Trains A calculation algorithm developed by the Ontario Ministry of
Environmental Assessment the Environment for the assessment of train noise.
Method (STEAM)
United States Federal Transit An operating agency of the United States Department of
Administration (U.S. FTA) Transportation responsible for supporting public transit systems
throughout the United States.
Zone of Influence (ZOI) Zone defined by the distance from the centre of the rail corridor
within which GO & ARL operations are expected to result in a
notable change in noise or vibration relative to existing ambient
levels.
NOTE: Use hereafter of the terms “we”, “our” or similar means “Delcan/Arup Joint Venture team”.
v GO Electrification Study Final Report – Appendix 8E ‐ December 20101. INTRODUCTION 1.1 Context Metrolinx operates a comprehensive transportation system of bus and commuter rail lines in the Greater Toronto and Hamilton Area (GTHA). The system includes the GO rail network, which is an essential part of Metrolinx’s service to the area commuters. GO Transit currently provides commuter rail service on seven corridors in the GTHA, using conventional diesel locomotives and non‐powered, bi‐level coaches in push‐pull configuration. In late 2008, Metrolinx published a Regional Transportation Plan – The Big Move – a multimodal vision for regional transportation to strengthen the economic, social and environmental sustainability of the Greater Toronto and Hamilton Area. The Big Move sets out a fast, frequent and expanded regional rapid transit network as a key element of the plan. The plan includes establishing Express Rail and Regional Rail services at speeds and frequencies that could be enhanced by system electrification. 1.2 GO Electrification Study Metrolinx has initiated a study of the electrification of the entire GO Transit rail system as a future alternative to diesel trains now in service. The Electrification Study is examining how the future GO rail services will be powered – using electricity, enhanced diesel technology or other means – when improved services are implemented in the future. The Electrification Study will assess the benefits and costs of a full range of technology options, including enhanced diesel, electric and alternative technologies. The Electrification Study will consider the existing GO Transit network, the proposed network expansions to St. Catharines, Kitchener/Waterloo, Allandale, Bloomington, Bowmanville, as well as the future Pearson Air Rail Link. The Final Report of the Electrification Study will be based on the results of a comparative analysis of network options as outlined in Appendix 1. The comparative analysis of network options considers 6 broad evaluation categories: Environmental & Health; User Benefits/Quality of Life; Social‐Community; Economic; Financial; and Deliverability. The final stage of the Study (Stage 5) involves conducting a detailed assessment of corridor/technology scenarios in terms of the above evaluation categories. However, for the purposes of the detailed assessment, the 6 broad evaluation categories listed above were each broken into sub‐categories. The sub‐categories are geared towards specific realms of knowledge and technical specialization in order to promote a comprehensive analysis. 6 GO Electrification Study Final Report – Appendix 8E ‐ December 2010
1.3 Noise & Vibration White Paper The evaluation category that is relevant to this White Paper is Environmental & Health Impacts, which is divided into the following 6 sub‐categories: Emissions Reductions; Noise and Vibration; Health; Terrestrial Ecosystem; Aquatic Ecosystem; and Effects on Parks / Public Open Space. This White Paper describes the approach for the noise and vibration assessment to be conducted under the overarching Environmental & Health Impacts category. Included in this paper are sections providing: An overview of the considerations associated with the noise and vibration discipline; The objectives addressed by the noise and vibration discipline; Assumptions for the noise and vibration discipline; Criteria, indicators and data sources for the noise and vibration assessment; Assessment of Options; Conclusions; and References. 7 GO Electrification Study Final Report – Appendix 8E ‐ December 2010
2.       OVERVIEW OF NOISE & VIBRATION CONSIDERATIONS
This noise and vibration assessment evaluates the relative benefits of various options for electrification
of GO Transit’s rail system. A short‐list of six electrification options was considered, representing
electrification of different parts of the network as well as electrification of the complete network. These
options were compared to the Reference Case, operating scenario using Tier 4 diesel technology
throughout the rail network.

The influence of noise and vibration was considered in comparing the six electrification options. For
noise and vibration, the relative benefit depends strongly on the magnitude of the change between the
Reference Case and the electrification option being considered. In addition, any potential benefit
depends on the current noise and vibration levels in the affected areas. Since sound and vibration
behave logarithmically, a relatively large change in level is necessary to result in significant perceptible
benefits.

The benefit of electrification also depends on where a receptor is situated. Locomotive noise and
vibration emissions are most concentrated within or immediately adjacent to the rail corridor and
become less influential farther away. Therefore, it is of interest to know how many people live within a
certain distance of the corridors, where the benefit is greatest.

2.1      Noise
Sounds of varying types are present throughout our environment and humans evaluate its influence in a
subjective way. Unwanted sounds, or noise, tend to produce annoyance that leads to emotional
responses and various social and societal issues. Naturally‐occurring sounds are generally well‐accepted
by people, while noise associated with human activities can be a concern. Most human activities
generate noise, and as development expands into the environment, the evaluation of potential noise
effects on the surroundings is often a consideration.

Sound travels through a fluid medium, such as air, as a pressure wave (i.e., oscillating air pressures). The
pressure fluctuations and frequency content of the waves are sensed by the ear and interpreted by the
brain as sound. The loudness, frequency content, and duration of the sound produce its character. The
relative loudness of a sound can be measured using various parameters, but is commonly expressed in
sound pressure at a distance from a source. The ear is capable of resolving a wide dynamic range of
sound pressure levels from micropascals (i.e., one millionth of a pascal or 10‐6 pascals) to terapascals
(i.e., trillions or 1012 pascals). As a result, a logarithmic scale (i.e., based on powers of 10) is used to
express sound quantities to make them more meaningful. The unit of this scale is the decibel (dB). The
reference level for sound pressure is 20 micropascals (i.e., 2 x 10‐5 pascals) which is considered the
threshold of human hearing. By definition, a sound pressure of 20 micropascals is equivalent to 0 dB.

Due to the wide dynamic range of the ear, fairly large changes in sound pressure are necessary to be
perceived. Table 1 summarizes the human perception of various changes in sound level.

8                   GO Electrification Study Final Report – Appendix 8E ‐ December 2010
Table 1 – Accepted Human Perception of Changes in Sound Level
    Change in Sound
                                                      Human Perception of Change
       Level (dB)
            10                          Substantial change (perceived as twice or half as loud)

The relative loudness of a sound to the human ear also varies by its frequency (i.e., pitch), with the
highest sensitivity at the frequencies of speech (i.e., mid‐frequencies) and less sensitivity at low or high
frequencies. This frequency response is approximated using frequency weighting scales, with the A‐
weighting network being the most common for environmental noise parameters. Hence, sound
parameters are often expressed in A‐weighted decibels (dBA).

Finally, the time‐varying aspect of a sound, or the ear’s exposure to a sound, influences the overall
psychological response. The energy equivalent sound level (Leq) represents the energy‐average over a
specified time period that would have the same sound energy as the fluctuating (i.e., unsteady) sound
over the same period. Common time periods for Leq values include 1‐hour, 8‐hour (i.e., usually the
night‐time from 23:00h to 07:00h), 16‐hour (i.e., usually the daytime from 07:00h to 23:00h), and 24‐
hour. Decades of research on the human response to noise has shown that longer durations of the
energy equivalent sound level expressed in A‐weighted decibels is a good, single number descriptor of
the influence of noise, particularly for transportation noise. As a result, most environmental noise
criteria are expressed using this parameter.

In the absence of specific descriptors, the term “sound level” can normally be considered to be a sound
pressure level expressed in A‐weighted decibels. A summary of typical sound levels is shown in Table 2.
Other common sound levels include the passby sound level, which is the maximum sound pressure level
(Lmax) experienced at a point during a short duration vehicle passby. A summary of the maximum
passby noise from various transportation sources is summarized in Figure 1. While these maximum
values may approach some of the levels in Table 2, which are commonly sustained sound levels, they are
importantly of shorter duration (i.e., passby levels) and thus have less impact on the average.

9                   GO Electrification Study Final Report – Appendix 8E ‐ December 2010
Table 2 – Range of Sound Levels for Typical Noise Sources
Sound Levels
Sound Sources of Noise
Human
Pressure Level
Perception
(dBA)
125 Sonic booms
120 Threshold of Feeling / Pain
Deafening
115 Maximum level, hard rock band concert
110 Accelerating Motorcycle at a few feet away
105 Loud auto horn at 3 m away
Very 100 Dance club / maximum speech output at 1 m
Loud 95 Jack hammer at 15 m distance
90 Indoors in a noisy factory
85 Heavy truck pass‐by at 15 m distance
80 School cafeteria / Vacuum Cleaner at 1.5 m
Loud 75 Near edge of major Highway
70 Inside automobile at 60 km/h
65 Normal human speech at 1 m distance
60 Background noise levels in department store
55
Moderate
50
45 Typical background noise levels in an office
40 Typical background noise levels in a library
35
Faint
30 Broadcast Studio
25 Average whisper
20 Deep woods on a very calm day
15
Very
10
Faint
5 Human breathing
0 Threshold of human hearing (20 micropascal reference level)
Sound pressure level is used to express the magnitude of sound at a point in space, such as a residence,
and is useful to describe a person’s response to the sound. Sound pressure depends on a number of
factors including distance from the source, direction, and atmospheric conditions. As a sound wave
radiates from a source and spreads out, it has less energy at any point in space. As a result, its sound
level is lower. In other words, the magnitude of a sound decays with distance from a source, so the
farther one moves away, the quieter the source becomes. Figure 2 shows an example of how sound
decays with distance from a line source such as a rail line. At sufficient distance, a noise source becomes
10 GO Electrification Study Final Report – Appendix 8E ‐ December 2010inaudible relative to the existing ambient sounds. As a result, the evaluation of noise effects can
generally be confined to the local area surrounding the source.
Figure 1 – Typical Maximum Passby Sound Levels of Various Transportation Sources
11 GO Electrification Study Final Report – Appendix 8E ‐ December 201075
2 dB Change Diesel Trains
Electric Trains
60 dBA Criterion
70
Note: Predicted daytime sound
) levels (Leq(16)) for 62 trains per
6
1
( day travelling at 150 km/h.
q
e
L 65
,)
A
B
d
(l
e
v
e
L 60
d
n 2 dB Change
u
o
S
55
89 m 124 m
50
0 50 100 150 200 250 300
Distance (m)
Figure 2 – Example Decay of Sound Levels with Distance
All modes of transportation generate noise to some degree, particularly those associated with
mechanical systems or moving parts, such as wheels or engines. For ground transportation, including
automobiles and trains, the main sources of noise emanate from the wheels (i.e., interaction with the
road or rail) and the engine. The influence of wheel noise is shown in Figure 2 above, where the overall
difference between the two curves is 2 dB at any distance even though the diesel locomotive is 3 dB
louder than the electric locomotive. The smaller difference is due to the wheel‐generated noise of the
locomotives and rail cars that is present for both technologies. Such differences of 2 to 3 dB are in fact
small in dealing with sound, and as shown in Table 1, represent imperceptible changes to the average
person.
Compared to the automobile, both diesel‐ and electric‐powered passenger rail services offer an efficient
way of transporting people, with a net reduction in noise emissions compared to single‐occupancy
vehicles. The service levels considered in the Reference Case and each of the electrification options
reflect increased commuter ridership, meaning fewer cars on the road. Since the benefits of removing
this road traffic would be nearly equal for the Reference Case and each of the electrification options, the
key consideration is the reduction in noise emissions related to powering the locomotives for each
option relative to the Reference Case.
12 GO Electrification Study Final Report – Appendix 8E ‐ December 20102.2 Vibration
Vibrations travel through solid mediums as waves in a similar way to how sound travels through fluid
mediums. Vibration is an oscillating motion with no net movement (i.e., moves positively or negatively
around a reference point) that can be described in terms of displacement, velocity or acceleration.
Displacement is generally the easiest to understand. For a vibrating floor, it represents the distance the
floor moves away from its static position. Velocity is the instantaneous speed of the floor’s movement
and acceleration is the rate of change of the speed. The response of humans, buildings, and equipment
to vibration is most accurately described using velocity and acceleration; hence, these are most
commonly used in evaluating vibration. As shown in Figure 3, the peak particle velocity (PPV) is the
maximum instantaneous velocity (positive or negative) produced in a vibration signal. This parameter
corresponds well to evaluating potential building damage since it relates to the stresses a building would
experience. However, it takes some exposure time for humans to respond to vibration, typically
something more like the average vibration. Hence, the root‐mean‐square (RMS) velocity, which
describes a “smoothed” or statistically averaged vibration amplitude, is used when evaluating human
response to vibration.
4
Peak Particle Velocity
3
Maximum RMS Velocity
2
yt
ic 1
o
l
e
V
n 0
o
it
ar
b
i ‐1
V
‐2
Signal
‐3
RMS
‐4
0 1 2 3 4 5 6 7 8 9 10
Time
Figure 3 – Vibration Velocity Parameters
13 GO Electrification Study Final Report – Appendix 8E ‐ December 2010Similar to noise, vibration can also create nuisance effects that lead to annoyance and concern by affected receptors. These can include perceptible movements of structures or effects such as window or picture rattling. Perceptible vibrations are typically generated by large moving masses or very loud sound levels (i.e., sound‐induced vibration) at close distances to a receptor. As a result, vibration impacts are normally associated with large or heavy modes of transport, such as trains, airplanes, or large trucks rather than lighter modes of transport such as automobiles. Vibration levels can also differ within a mode of transport; for example trains tend to produce higher vibration emissions than lighter rail vehicles such as Light Rail Transit or Diesel/Electric Motive Units. Figure 4 shows typical vibration velocity levels for various transportation sources expressed as average (root‐mean‐square or RMS) velocities in mm/s. Vibration velocity can also be expressed in decibels similar to sound, but are denoted as VdB to differentiate from sound decibels. Throughout this assessment vibration decibels are referenced to a vibration level of 1 microinch per second, or 2.54 x 10‐5 mm/s. Vibration velocities in the 0.05 to 0.1 mm/s (i.e., 65 to 72 VdB) range represent the lower extreme of human vibration perception and are generally barely perceptible, if at all. Velocities in the 0.14 to 0.2 mm/s (i.e., 75 to 78 VdB) range may generate just perceptible vibration in residences which often causes annoyance. More frequent events (i.e., passbys every 5 to 10 minutes) use the lower end of this range while infrequent events use the higher range of the perception threshold. Based on these ranges, a change of at least 3 VdB would be necessary to change the perception from barely perceptible to just perceptible (i.e., 72 VdB to 75 VdB). Differences of less than 3 VdB are unlikely to be noticeable. Vibration effects tend to be highly localized however, as ground‐borne vibrations tend to decay much quicker over distance than sound, except in very unique ground circumstances. Hence, vibration zones of influence tend to be much smaller than their sound counterparts. 14 GO Electrification Study Final Report – Appendix 8E ‐ December 2010
Vibration
                  Level
                 (mm/s)

                   30

                                      Threshold for Minor Cosmetic Damage to
                   10                 Buildings (10 mm/s)

                   3

                                      Bulldozer at 15 m distance (1 mm/s)
                   1
                                      Difficulty with Tasks Such as Reading (1mm/s)
                                      Commuter Rail at 15 m (0.3 mm/s)
                   0.3
                                      Residential Annoyance Infrequent Events
                                      Rapid Transit at 15 m (0.1 to 0.3 mm/s)
                   0.1
                                      Residential Annoyance Frequent Events
                                      Bus or Truck Pass‐by (0.03 to 0.1 mm/s)
                  0.03
                                      Threshold of Human Perception
                  0.01                Typical Background Vibration

     Figure 4 – Typical Passby Vibration Levels of Various Transportation Sources

15         GO Electrification Study Final Report – Appendix 8E ‐ December 2010
3. OBJECTIVES ADDRESSED BY DISCIPLINE
Appendix 1, High Level Decision Making Framework, identified a key objective relevant to noise and
vibration under the ‘Community and Land Use’ category as:
The selected technology should be implemented in a manner that will minimize adverse
community/social impacts including aesthetic impacts and impacts from noise and vibration.
This objective was also presented at a March 31, 2010 Stakeholder workshop for public comment. The
noise and vibration assessment was designed to assess the change in noise and vibration levels in the
local adjacent communities due to the proposed electrification options. The results will be used to help
minimize the community/social impacts.
Findings from the noise and vibration assessment may also be used to influence other disciplines,
including social, health & safety, and economic considerations, to ensure the overall objectives of the
High Level Decision Making Framework are addressed.
This study is designed to identify zones (i.e., influence areas) where GO Transit’s contributions to train
noise or train‐induced vibrations would trigger the need to investigate mitigation measures, based on
the approach and criteria in the MOEE/GO Transit Draft Protocol (MOEE/GO Transit, 1994). The
approach was based on that used for the Georgetown South and Airport Shuttle, and other applicable
projects to the extent possible. However, for consistency and comparison purposes, screening‐level
calculations were conducted to estimate the corridor setbacks where the level of noise or vibration
would suggest mitigation may be required. For train noise, the MOE “Sound from Trains Environmental
Analysis Method (STEAM)” algorithms were used to determine the Zones of Influence (MOEE/GO
Transit, 1994). For vibration, screening‐level calculations using the methods of the United States
Department of Transportation (DOT) ‐ Federal Transit Administration (FTA) were used to determine the
zone of influence (U.S. DOT, 2006). These zones were then used along with identified population
density and sensitive receptors for the Reference Case and the various electrification options to quantify
potential noise and vibration impacts for each option.
As the calculations are screening‐level, they are not intended to accurately reproduce absolute sound or
vibration levels in a specific area, which would be highly site‐specific. Rather, they propose a consistent
methodology that can be used to appropriately assess the potential change in conditions between
various electrification options, thereby allowing the assessment of a preferred alternative.
16 GO Electrification Study Final Report – Appendix 8E ‐ December 20104. ASSUMPTIONS FOR THE NOISE AND VIBRATION ASSESSMENT
The following is a list of assumptions relating to the purpose of this assessment:
The noise and vibration assessment contributes to Stage 5 of the Electrification Study, which is the
detailed assessment stage and involves the comparison of six network options.
The assessment is designed to evaluate electrification options relative to the Tier 4 diesel reference
case with the intention of generating information helpful for decision making by Metrolinx.
Several assumptions on the network operation were necessary to allow a useful, consistent inter‐
comparison of alternatives. The assessment is not intended to accurately predict absolute sound or
vibration levels.
This assessment is not intended to replace the detailed noise and vibration assessments that would
be required as part of future environmental assessments for any sections of the network subject to
changes in infrastructure or changes from currently approved service levels.
The following is a list of assumptions relating to the scenarios considered in the assessment:
The ‘benchmark’ or ‘base case’ used as the point of comparison for the six short‐listed electrification
options is the Reference Case.
The Reference Case is a hypothetical operating scenario with defined service levels and schedules
for each of the seven GO Transit rail corridors plus the ARL shuttle service.
The Reference Case is based on operation of Tier 4 diesel locomotives on GO Transit corridors and
diesel multiple unit vehicles (DMUs) on the Airport Rail Link (ARL).
The six short‐listed electrification options under evaluation are as summarized in Table 3 and
represent replacement of diesel locomotives with electric locomotives, and for the ARL,
replacement of DMUs with electric multiple unit vehicles (EMUs).
The evaluation period is for the years 2020 – 2049.
The previous noise and vibration analyses for the Georgetown South and Airport Rail Link (ARL), and
others were relied on to the extent possible. Screening‐level noise and vibration modeling was
performed using accepted rail noise/vibration propagation models to achieve consistent and
comparable results between rail corridors. The inputs for the assessment were derived from data
provided by the Delcan/Arup team, including:
GO Transit and ARL service levels and schedules based on the information identified in the reference
case documentation.
Diesel and electric train and vehicle (i.e., DMU / EMU) characteristics (i.e., locomotive horsepower,
sound power levels, number of and size of cars, etc.). Train and DMU/EMU engines were assumed
to operate at full horsepower (both propulsion engine and auxiliary hotel power engine) and
representative peak speed over each segment of the corridor.
Shielding of sensitive impact areas, such as residential outdoor living areas, by houses and structures
was not considered in the modelling, nor were other variable factors such as ground type or terrain.
17 GO Electrification Study Final Report – Appendix 8E ‐ December 2010These assumptions were necessary to make the assessment manageable and consistent, and thus allow
inter‐comparison of alternatives. However, the absolute results for the corridors may not be accurate
representations as a result.
Table 3 – Summary of the Network Electrification Options Considered
Corridor Referenc Option Option Option Option Option Option
e Case 1 2 3 11 15 18
Lakeshore West (LW) Diesel Diesel Electric Electric Electric Electric Electric
Milton (MT) Diesel Diesel Diesel Diesel Electric Electric Electric
Georgetown (GT) Diesel Electric Diesel Electric Electric Electric Electric
ARL Diesel Electric Diesel Electric Electric Electric Electric
Barrie (BA) Diesel Diesel Diesel Diesel Diesel Electric Electric
Richmond Hill (RH) Diesel Diesel Diesel Diesel Diesel Diesel Electric
Stouffville (ST) Diesel Diesel Diesel Diesel Diesel Diesel Electric
Lakeshore East (LE) Diesel Diesel Electric Electric Electric Electric Electric
Notes: Diesel = Tier 4 Diesel Electric = Electrified
The following additional assumptions were applied relating to the technical approach used in the
assessment:
All rail lines are composed of continuous welded rail and devoid of significant defects that could
increase noise or vibration emissions.
Noise emissions for the various propulsion technologies are at maximum speed and were scaled to
three speed ranges (i.e., less than 50 kph, 50 to 100 kph, 100 to 150 kph) for analysis purposes.
Noise emissions from the entire train (i.e., locomotives and coaches) were estimated using the
scaled locomotive noise plus the wheel noise predicted by STEAM at the associated speed.
The appropriate scaled noise emissions from one of the three speed ranges were applied to
individual corridor rail segments based on the corresponding corridor speed limits.
Additional wheel noise was included for GO trains via 2 additional coaches to account for heavier
locomotives, maintenance issues, or transient (acceleration/deceleration) effects. This assumption
would tend to exaggerate the predicted absolute sound levels, but is consistently applied and hence
does not influence the change between diesel and electrification.
Noise emissions associated with acceleration or deceleration were not accounted for specifically
since they are expected to be comparable on average to noise emissions from trains moving at their
speed limit (i.e., added wheel noise at speed will offset any difference in engine noise). The
additional wheel noise effects conservatively included for trains would account for this variability.
The effects of increased noise or vibration due to discontinuities at switches, wheel squeal, or brake
noise were not specifically included as such effects would be highly localized. The analysis also
includes additional wheel noise effects as a conservatism to account for such effects.
Vibration emissions were assumed to scale linearly with drive axle weight.
18 GO Electrification Study Final Report – Appendix 8E ‐ December 2010 Rail traffic was located in the centre of each corridor where multiple tracks exist.
Idling at stations, layovers and maintenance yards was not considered since these emissions are
generally localized, brief and small in relation to emissions from travelling locomotives.
Deadhead train movements were not considered, as they are expected to be minor relative to the
conservatisms in the analysis.
Future train movements were distributed into time of day categories (i.e., day or night) based on the
existing train schedules in an equivalent distribution and conservatively rounded up where partial
trips may apply.
Some minor simplifications of the geometry of the GO Transit network were made (e.g., track
orientation relative to north), the effects of which were verified to be small via sensitivity tests.
Receptors were exposed to a full unobstructed view of the rail line, with flat terrain and absorptive
ground (i.e., grass, soft soil) in the intervening space.
Daytime ambient sound levels were assumed to be 55 dBA (16‐hr Leq) near the corridors to
establish the zone of influence. Actual ambient levels are expected to be higher for most developed
areas; however a lower assumed ambient is expected to exaggerate the influence of any change due
to electrification. As such it leads to somewhat overestimated zones of influence for both diesel and
electric trains. This approach was necessary to achieve a consistent and manageable analysis of the
entire network.
Nighttime ambient sound levels were assumed to be 50 dBA (8‐hr Leq) near the corridors to
establish the zone of influence. Actual ambient levels are expected to be higher for most developed
areas; however a lower assumed ambient is expected to exaggerate the influence of any change due
to electrification. As such it leads to somewhat overestimated zones of influence for both diesel and
electric trains. This approach was necessary to achieve a consistent and manageable analysis of the
entire network.
Passengers who use GO Transit on a daily basis would experience less noise or vibration effects
compared to residences adjacent to the corridor as their outdoor exposure time is brief and
generally accepted as a necessary consequence of using the transit system.
19 GO Electrification Study Final Report – Appendix 8E ‐ December 20105. CRITERIA, INDICATORS, AND DATA SOURCES
Table 4 summarizes the criteria, indicators and data sources used in the noise and vibration assessment.
Table 5 lists the various data that served as inputs to the assessment, as well as the sources of those
data. Tables 6 and 7, and Figures 5 and 6 summarize the data inputs used in the assessment.
Table 4 – Noise & Vibration Detailed Assessment Criteria, Indicators and Data Sources
Data
Criteria Rationale Indicators
Sources
Potential to Diesel and electric options have Extent of noise Zone of See
affect the differing noise characteristics and Influence (i.e., areas where Table 5.
local noise result in differing requirements noise levels may exceed
environment for mitigation. applicable thresholds).
Feasibility of mitigation.
Potential to Diesel and electric options have Extent of vibration Zone of See
affect the different locomotive and train Influence (i.e., areas where Table 5.
local characteristics, resulting in vibrations may exceed
vibration differing ground‐borne vibration applicable thresholds).
environment effects and mitigation Feasibility of mitigation.
requirements.
20 GO Electrification Study Final Report – Appendix 8E ‐ December 2010Table 5 – Data Sources and Notes
Data Data Source & Notes
Railway Operations
Railway network Provided for proposed expanded rail network by Delcan Arup Joint
layout/geometry Venture. See Figure 5 and 6.
Daily and hourly GO Reference Case – Final Workbook (Delcan Arup Joint Venture, 2010).
traffic volumes See Table 6 for summary.
Daily and hourly ARL Georgetown South Service Expansion and Union‐Pearson Rail Link
traffic volumes Environmental Project Report (Metrolinx, 2009). See Table 6 for
summary.
GO train speeds Provided for existing conditions between corridor mileposts by Delcan
Arup Joint Venture. Trains assumed to operate at speed limit.
ARL speeds Assumed to be the same as GO train speeds.
GO & ARL Emissions
Noise Emissions Based on data provided by Delcan Arup Joint Venture for different train
technologies. See Table 7 for summary.
Vibration Emissions Based on data provided by Delcan Arup Joint Venture for different train
technologies. See Table 7 for summary.
Propagation Modelling
Selected noise model MOE STEAM algorithm (MOE, 1990)
Selected vibration FTA Transit Noise and Vibration Impact Assessment (U.S. DOT, 2006)
model
Applicable Thresholds
Noise & Vibration Draft Protocol for Noise and Vibration Assessment Ontario Ministry of
the Environment/GO Transit, 1994)
21 GO Electrification Study Final Report – Appendix 8E ‐ December 2010Figure 5 – Overview of GO Transit Rail Network
Figure 6 – GO Transit Rail Corridors near Union Station
22 GO Electrification Study Final Report – Appendix 8E ‐ December 2010Table 6 – Summary of Railway Operational Inputs
Rail Corridor Train (ARL) Volumes
Label Daytime Nighttime
Rail Line Segment Description [1] Total [4]
07:00 to 23:00 [2,3] 23:00 to 07:00 [2,3]
Union E1 - Union to Don River UE1 213 26 239
Union East
Union E2 - Don River to Scarborough Jctn UE2 160 21 181
Union W1 - Union to Bathurst St UW1 275 (128) 31 (12) 306 (140)
Union West Union W2 - Bathurst St to Lansdowne Av UW2 177 (128) 15 (12) 192 (140)
Union W3 - Lansdowne Av to Dupont St UW3 124 (128) 10 (12) 134 (140)
Union E2 to Pickering LE1 98 16 114
Lakeshore
East
Pickering to Oshawa 2 LE2 98 16 114
Oshawa 2 to Bowmanville LE3 15 ‐ 15
Union W1 to Oakville LW1 98 16 114
Lakeshore Oakville to Hamilton-James LW2 98 16 114
West Hamilton Jctn to Hamilton TH+B LW3 98 16 114
Hamilton-James to St Catherine's LW4 8 ‐ 8
Union W3 to Meadowvale MT1 62 5 67
Milton
Meadowvale to Milton MT2 53 5 58
Union W3 to Pearson Airport (ARL) GT1 62 (128) 5 (12) 67 (140)
Georgetown Brampton to Georgetown GT2 62 5 67
Georgetown to Kitchener GT3 21 ‐ 21
Union W2 To Bradford BA1 53 5 58
Barrie
Bradford to Allandale BA2 15 ‐ 15
Richmond Union E1 to Richmond Hill RH1 53 5 58
Hill Richmond Hill to Bloomington RH2 15 ‐ 15
Union E2 to Mt Joy ST1 62 5 67
Stouffville
Mt Joy to Lincolnville ST2 21 ‐ 21
ARL = Airport Rail Link
[1] See Figures 5 and 6 for locations of segments.
[2] In some instances train schedules could not be accurately apportioned to day or night since the reference values spanned both periods. In
these cases, train volumes were assumed to occur during both periods.
[3] Train volumes apportioned to day and night time periods based on current train schedules. Some differences may occur due to rounding.
[4] Totals may over‐estimate trains per day due to double‐counting of some nighttime trips (see note [2]). These simplifications will not
affect the inter‐comparison of the assessment results.
23 GO Electrification Study Final Report – Appendix 8E ‐ December 2010Table 7 – Summary of GO & ARL Noise and Vibration Emissions
Noise Adjustment for Drive Vibration Level at
Technology Configuration Emissions [1] Axle Weight [2] 28m and 50 km/h [3]
(dBA) (VdB) (VdB)
Diesel Locomotive 1 locomotive, 10 coach 89 0.0 75 (0.14 mm/s)
Electric Locomotive 1 locomotive, 10 coach 86 ‐3.0 72 (0.10 mm/s)
EMU 1 locomotive, 12 coach 82 ‐4.2 71 (0.09 mm/s)
Dual – Electric Mode 1 locomotive, 10 coach 86 0.0 75 (0.14 mm/s)
Dual – Diesel Mode 1 locomotive, 10 coach 89 0.0 75 (0.14 mm/s)
DMU (ARL) 2 locomotive / coach 86 ‐3.9 71 (0.09 mm/s)
EMU (ARL) 2 locomotive / coach 82 ‐4.9 70 (0.08 mm/s)
Data Source: Delcan Arup Joint Venture, 2010.
[1] Maximum exterior noise levels at 15 m from track, train moving.
[2] Adjustment determined based on ratio of drive axle weight to reference diesel locomotive.
[3] U.S. FTA vibration model for diesel train on continuous welded rail at 50 km/h and 28m (75 VdB ref 2.54E‐5 mm/s; or 0.14 mm/s RMS).
24 GO Electrification Study Final Report – Appendix 8E ‐ December 20106. ASSESSMENT OF OPTIONS
The basic assessment methodology and parameters are set out in the preceding sections (Section 2, 3
and 4). The results of the screening‐level noise and vibration modeling were used to establish Zones of
Influence in which the applicable criteria could be triggered. Graphical Information Systems were used
to visualize influence areas and determine affected populations and sensitive receptors for each
electrification option. The data on affected populations was then used to compare the various options
for the GO Electrification study versus a Reference Case that assumes Tier 4 diesel locomotives over the
entire network. The study indicators were used to qualitatively rate technology options with respect to
each individual criterion and corridor. An overall rating was then derived for noise/vibration for each
electrification option, based on the rankings for the individual criteria.
6.1 MOEE/GO Transit Draft Guideline
The MOEE / GO Transit Draft Protocol (1994) has never been formally adopted, but provides an outline
of an approach considered acceptable by the regulators and as such, is considered relevant to the study.
It is further relevant in that it has been applied in evaluating other corridors. It was assumed that ‘dB’
referenced in the MOEE / GO Draft Protocol refers to ‘dBA’, the typical unit of measurement used in
environmental noise assessments.
Noise
The objective of the MOEE / GO Draft Protocol is that the daytime (i.e., 07:00 – 23:00) Leq(16h)
produced by future rail service operation of the GO Transit project under assessment, does not exceed
the higher of:
a. The ambient sound level (combined with the sound level from existing rail activity); or
b. 55 dBA.
Furthermore, the MOEE / GO Draft Protocol also suggests that the night‐time Leq (8h) produced by the
future rail service operation of the GO Transit project does not exceed the higher of:
a. The ambient sound level (combined with the sound level from existing rail service); or
b. 50 dBA.
The MOEE / GO Draft Protocol states that impact at a point of reception shall be expressed in terms of
the Adjusted Noise Impact. The Adjusted Noise Impact is based on the difference between pre‐project
noise (including ambient and existing rail noise) and post‐project noise (including ambient and future rail
noise). Where the pre‐project noise (i.e., the ambient noise) is less than 55 dBA Leq during the daytime
or 50 dBA Leq during the nighttime, these minimum values are taken as the applicable pre‐project noise
(i.e., daytime ambient of 55 dBA or nighttime ambient of 50 dBA).
Due to the variable, site‐specific ambient sound levels throughout each corridor, the current assessment
assumed that the ambient sound levels could fall below the minimum criteria of the MOEE/GO Transit
Draft Protocol (i.e., 55 dBA daytime, and 50 dBA nighttime). This assumption is expected to be
conservative considering the built‐up areas around the rail corridors where actual ambient levels could
be in the 55 – 70 dBA range. However, use of the minimum criteria in the MOEE / GO Transit Draft
Protocol provides a useful reference for comparison appropriate for this assessment.
25 GO Electrification Study Final Report – Appendix 8E ‐ December 2010In addition, according to the MOEE / GO Draft Protocol the predicted impacts are rated with respect to
the following objectives:
Adjusted Impact Level Impact Rating
0 ‐ 2.99 dB Insignificant
3 ‐ 4.99 dB Noticeable
5 – 9.99 dB Significant
>10 dB Very Significant
The above objectives compare well to the human response to changes in sound levels per Table 1. In
cases where the Adjusted Noise Impact is considered “Significant” or greater (i.e. 5 dB or greater), the
potential to mitigate will be evaluated based on administrative, operational, economic and technical
feasibility. This criterion of a 5 dB change was used as the basis for defining the Zones of Influence for
sound. Given the prior assumption that the ambient sound levels would be based on the minimum
criteria of 55 dBA (day) and 50 dBA (night), a change of 5 dB or greater would be triggered in the current
assessment when predicted levels exceeded 60 dBA (day) or 55 dBA (night).
Vibration
The objective of the MOEE / GO Draft Protocol is that the RMS vibration velocity produced from GO
Transit project at a point of reception does not exceed the higher of:
a. 0.14 mm/s (i.e., 75 VdB) at a point of vibration assessment; or
b. The vibration levels from existing operations when they exceed 0.14 mm/s.
Furthermore, the MOEE / GO Draft Protocol stipulates that the requirement to evaluate mitigation
occurs only if the vibration velocity exceeds the objective by 25% or more (i.e., the greater of 0.174
mm/s or 77 VdB, or a 25% increase over existing levels). For the purposes of the screening‐level
evaluation, Zones of Influence based on vibration impact were assessed where the predicted levels
exceed the 0.14 mm/s criterion (i.e., 75 VdB). A 25% change over existing vibration levels approximately
correlates to a change of 2‐3 VdB. Such a change would be considered important relative to the MOEE /
GO Transit Draft Protocol and would represent a perceptible benefit of an electrification option.
6.2 Determination of Zones of Influence
As noted, the Zones of Influence for noise and vibration were determined based on:
A change of 5 dB above typical ambient levels for noise (assumed at 55/50 dBA for day/night
respectively), or an overall level of 60 dBA (day) and 55 dBA (night); and
For vibration, a perceptibility limit of 0.14 mm/s maximum RMS passby velocity.
Using the provided inputs, the STEAM and FTA models were iterated to determine setback distances
from the rail corridor for noise and vibration, respectively, where the above criteria were met. As the
rated speed varies through each section of the corridors, three representative speed ranges were
evaluated and then applied to the appropriate section of track. The results of the modeling are
summarized in Table 8 for day and night noise levels (based on corresponding train volumes) and peak
passby vibration for each speed range. The highest setback distance is identified in bold. The extremes
26 GO Electrification Study Final Report – Appendix 8E ‐ December 2010of these setbacks correspond to the maximum for the Reference Case (all diesel technology) and the
minimum for electrification of the entire network (Option 18, all electric technology).
Table 8 – Summary of Setback Distances for Zones of Influence
Daytime Noise Setbacks Nighttime Noise
Vibration Setbacks (m)
(m) Setbacks (m)
Line Location Option 50 to 50 to 50 to
< 50 > 100 < 50 > 100 < 50 > 100
100 100 100
km/h km/h km/h km/h km/h km/h
km/h km/h km/h
Ref 143 260 370 112 204 ‐ 28 47 ‐
Option 1 124 227 323 102 187 266 28 47 70
Option 2 132 241 343 99 181 259 28 47 70
Union to Bathurst St
Option 3 112 206 293 88 162 232 28 47 70
(UW1)
Option 11 105 192 273 84 154 220 28 47 70
Option 15 98 179 256 79 145 208 21 36 50
Option 18 98 179 256 79 145 208 21 36 50
Ref 116 212 302 79 145 207 28 47 70
Option 1 95 174 247 67 123 176 28 47 70
Bathurst St to Option 2 116 212 302 79 145 207 28 47 70
Lansdowne Ave Option 3 95 174 247 67 123 176 28 47 70
(UW2) Option 11 86 158 225 62 113 162 28 47 70
Option 15 79 144 205 56 103 148 21 36 50
Option 18 79 144 205 56 103 148 21 36 50
Ref 101 183 260 67 123 176 28 47 70
Multiple Option 1 77 144 200 54 98 141 28 47 70
Tracks Option 2 101 183 260 67 123 176 28 47 70
Lansdowne Ave to
Combined Option 3 77 140 200 54 98 141 28 47 70
Dupont St (UW3)
(near Union Option 11 67 123 175 48 87 126 21 36 50
Station) Option 15 67 123 175 48 87 126 21 36 50
Option 18 67 123 175 48 87 126 21 36 50
Ref 104 210 270 88 161 230 28 47 70
Option 1 104 210 270 88 161 230 28 47 70
Option 2 91 166 237 73 134 191 28 47 70
Union to Don River
Option 3 91 166 237 73 134 191 28 47 70
(UE1)
Option 11 91 166 237 73 134 191 28 47 70
Option 15 91 166 237 73 134 191 28 47 70
Option 18 74 136 194 63 115 165 21 36 50
Ref 87 158 226 77 141 201 28 47 70
Option 1 87 158 226 77 141 201 28 47 70
Don River to Option 2 72 132 188 61 111 159 28 47 70
Scarborough Jctn Option 3 72 132 188 61 111 159 28 47 70
(UE2) Option 11 72 132 188 61 111 159 28 47 70
Option 15 72 132 188 61 111 159 28 47 70
Option 18 62 114 162 55 101 144 21 36 50
Ref 44 79 113 32 57 82 28 47 70
Option 1 44 79 113 32 57 82 28 47 70
Option 2 44 79 113 32 57 82 28 47 70
Union W2 To
Option 3 44 79 113 32 57 82 28 47 70
Bradford (BA1)
Option 11 44 79 113 32 57 82 28 47 70
Barrie
Option 15 31 56 81 22 41 58 21 36 50
Option 18 31 56 81 22 41 58 21 36 50
Ref 20 36 51 ‐ ‐ ‐ 28 47 70
Bradford to
Option 1 20 36 51 ‐ ‐ ‐ 28 47 70
Allandale (BA2)
Option 2 20 36 51 ‐ ‐ ‐ 28 47 70
27 GO Electrification Study Final Report – Appendix 8E ‐ December 2010Daytime Noise Setbacks Nighttime Noise
Vibration Setbacks (m)
(m) Setbacks (m)
Line Location Option 50 to 50 to 50 to
< 50 > 100 < 50 > 100 < 50 > 100
100 100 100
km/h km/h km/h km/h km/h km/h
km/h km/h km/h
Option 3 20 36 51 ‐ ‐ ‐ 28 47 70
Option 11 20 36 51 ‐ ‐ ‐ 28 47 70
Option 15 15 26 37 ‐ ‐ ‐ 21 36 50
Option 18 15 26 37 ‐ ‐ ‐ 21 36 50
Ref 80 145 206 54 99 141 28 47 70
Option 1 51 94 134 38 70 100 21 36 50
Union W3 to Pearson Option 2 80 145 206 54 99 141 28 47 70
Airport Option 3 51 94 134 38 70 100 21 36 50
including ARL (GT1) Option 11 51 94 134 38 70 100 21 36 50
Option 15 51 94 134 38 70 100 21 36 50
Option 18 51 94 134 38 70 100 21 36 50
Ref 48 87 124 32 57 82 28 47 70
Option 1 34 62 89 22 41 58 21 36 50
Option 2 48 87 124 32 57 82 28 47 70
Brampton to
Georgetown Option 3 34 62 89 22 41 58 21 36 50
Georgetown (GT2)
Option 11 34 62 89 22 41 58 21 36 50
Option 15 34 62 89 22 41 58 21 36 50
Option 18 34 62 89 22 41 58 21 36 50
Ref 25 44 63 0 0 0 28 47 70
Option 1 18 32 45 ‐ ‐ ‐ 21 36 50
Option 2 25 44 63 ‐ ‐ ‐ 28 47 70
Georgetown to
Option 3 18 32 45 ‐ ‐ ‐ 21 36 50
Kitchener (GT3)
Option 11 18 32 45 ‐ ‐ ‐ 21 36 50
Option 15 18 32 45 ‐ ‐ ‐ 21 36 50
Option 18 18 32 45 ‐ ‐ ‐ 21 36 50
Ref 64 116 166 65 119 169 28 47 70
Option 1 64 116 166 65 119 169 28 47 70
Option 2 45 83 118 46 84 121 21 36 50
Union E2 to Oshawa
Option 3 45 83 118 46 84 121 21 36 50
(LE1, LE2)
Option 11 45 83 118 46 84 121 21 36 50
Option 15 45 83 118 46 84 121 21 36 50
Lakeshore Option 18 45 83 118 46 84 121 21 36 50
East Ref 20 36 51 0 0 0 28 47 70
Option 1 20 36 51 ‐ ‐ ‐ 28 47 70
Option 2 15 26 37 ‐ ‐ ‐ 21 36 50
Oshawa to
Option 3 15 26 37 ‐ ‐ ‐ 21 36 50
Bowmanville (LE3)
Option 11 15 26 37 ‐ ‐ ‐ 21 36 50
Option 15 15 26 37 ‐ ‐ ‐ 21 36 50
Option 18 15 26 37 ‐ ‐ ‐ 21 36 50
Ref 64 116 166 65 119 169 28 47 70
Option 1 64 116 166 65 119 169 28 47 70
Union W1 to Option 2 45 83 118 46 84 121 21 36 50
Hamilton (LW1, LW2, Option 3 45 83 118 46 84 121 21 36 50
LW3) Option 11 45 83 118 46 84 121 21 36 50
Lakeshore
Option 15 45 83 118 46 84 121 21 36 50
West
Option 18 45 83 118 46 84 121 21 36 50
Ref 15 25 35 0 0 0 28 47 70
Hamilton to Option 1 15 25 35 ‐ ‐ ‐ 28 47 70
St. Catherines (LW4) Option 2 15 25 35 ‐ ‐ ‐ 28 47 70
Option 3 15 25 35 ‐ ‐ ‐ 28 47 70
28 GO Electrification Study Final Report – Appendix 8E ‐ December 2010Daytime Noise Setbacks Nighttime Noise
Vibration Setbacks (m)
(m) Setbacks (m)
Line Location Option 50 to 50 to 50 to
< 50 > 100 < 50 > 100 < 50 > 100
100 100 100
km/h km/h km/h km/h km/h km/h
km/h km/h km/h
Option 11 15 25 35 ‐ ‐ ‐ 28 47 70
Option 15 15 25 35 ‐ ‐ ‐ 28 47 70
Option 18 15 18 25 ‐ ‐ ‐ 21 36 50
Ref 48 87 124 32 57 82 28 47 70
Option 1 48 87 124 32 57 82 28 47 70
Option 2 48 87 124 32 57 82 28 47 70
Union W3 to
Option 3 48 87 124 32 57 82 28 47 70
Meadowvale (MT1)
Option 11 34 62 89 22 41 58 21 36 50
Option 15 34 62 89 22 41 58 21 36 50
Option 18 34 62 89 22 41 58 21 36 50
Milton Ref 44 79 113 32 57 82 28 47 70
Option 1 44 79 113 32 57 82 28 47 70
Option 2 44 79 113 32 57 82 28 47 70
Meadowvale to Option 3 44 79 113 32 57 82 28 47 70
Milton (MT2)
Option 11 31 56 81 22 41 58 21 36 50
Option 15 31 56 81 22 41 58 21 36 50
Option 18 31 56 81 22 41 58 21 36 50
Ref 44 79 113 32 57 82 28 47 70
Option 1 44 79 113 32 57 82 28 47 70
Option 2 44 79 113 32 57 82 28 47 70
Union E1 to
Option 3 44 79 113 32 57 82 28 47 70
Richmond Hill (RH1)
Option 11 44 79 113 32 57 82 28 47 70
Option 15 44 79 113 32 57 82 28 47 70
Richmond Option 18 31 56 81 22 41 58 21 36 50
Hill Ref 20 36 51 0 0 0 28 47 70
Option 1 20 36 51 ‐ ‐ ‐ 28 47 70
Option 2 20 36 51 ‐ ‐ ‐ 28 47 70
Richmond Hill to
Option 3 20 36 51 ‐ ‐ ‐ 28 47 70
Bloomington (RH2)
Option 11 20 36 51 ‐ ‐ ‐ 28 47 70
Option 15 20 36 51 ‐ ‐ ‐ 28 47 70
Option 18 15 26 37 ‐ ‐ ‐ 21 36 50
Ref 48 87 124 32 57 82 28 47 70
Option 1 48 87 124 32 57 82 28 47 70
Option 2 48 87 124 32 57 82 28 47 70
Union E2 to Mount
Option 3 48 87 124 32 57 82 28 47 70
Joy (ST1)
Option 11 48 87 124 32 57 82 28 47 70
Option 15 48 87 124 32 57 82 28 47 70
Option 18 34 62 89 22 41 58 21 36 50
Stouffville
Ref 25 44 63 0 0 0 28 47 70
Option 1 25 44 63 ‐ ‐ ‐ 28 47 70
Option 2 25 44 63 ‐ ‐ ‐ 28 47 70
Mount Joy to
Option 3 25 44 63 ‐ ‐ ‐ 28 47 70
Lincolnville (ST2)
Option 11 25 44 63 ‐ ‐ ‐ 28 47 70
Option 15 25 44 63 ‐ ‐ ‐ 28 47 70
Option 18 18 32 45 ‐ ‐ ‐ 21 36 50
29 GO Electrification Study Final Report – Appendix 8E ‐ December 2010You can also read