A multiwell plate based system for toxicity screening under multiple static or cycling oxygen environments - Nature
←
→
Page content transcription
If your browser does not render page correctly, please read the page content below
www.nature.com/scientificreports
OPEN A multiwell plate‑based
system for toxicity screening
under multiple static or cycling
oxygen environments
Ming Yao1, Glenn Walker3 & Michael P. Gamcsik2*
Tumor tissue contains a continuous distribution of static and dynamically changing oxygen
environments with levels ranging from physiologically normal oxygen down to anoxia. However,
in vitro studies are often performed under oxygen levels that are far higher than those found in vivo. A
number of devices are available to alter the oxygen environment in cell culture, including designs from
our laboratory. However, in our devices and most other designs, changing the media in order to feed
or dose cells remains a disruptive factor in maintaining a consistent hypoxic environment. This report
presents a novel 96-well plate design that recirculates the local oxygen environment to shield cells
during media changes and facilitates toxicity studies of cells cultured under varying oxygen levels. The
principle behind the design is presented and the response of human pancreatic cancer PANC-1 cells
treated with tirapazamine and doxorubicin under eight different static or cycling oxygen levels was
measured. As expected, tirapazamine is progressively more toxic as oxygen levels decrease but retains
some toxicity as oxygen is cycled between hypoxic and normoxic levels. Doxorubicin sensitivity is
largely unaffected by changing oxygen levels. This technology is ideal for assessing the effects of
oxygen as a variable in toxicity screens.
Studies show that at least 50–60% of locally advanced human tumors contain regions of hypoxic or anoxic
tissues1,2. The median oxygen levels in human tumors originating from 14 different tissues expressed as oxy-
gen partial pressure (pO2) range from levels of 2 mmHg in pancreatic adenocarcinoma to 32 mmHg in rectal
carcinomas1 which is far below the levels found in healthy tissue (~ 50–70 mmHg)3. Hypoxic regions vary both
spatially and temporally, resulting in an infinite landscape of oxygen levels and cycles that can be present in any
given tumor. Hypoxia can inhibit cellular differentiation and help maintain cancer stem c ells4, drives cancer
progression5–7, results in therapy r esistance8,9 and is a widely observed negative prognostic i ndicator10. Compared
to chronic hypoxia, cycling hypoxia is thought to be a more effective driving force in cancer progression, resulting
in more aggressive tumor c ells11,12. In vitro studies show that the response of cancer cells to chemotherapeutic
drugs is changed under static hypoxic c onditions13,14 but few studies have probed response under cycling hypoxia.
Static or cycling hypoxia studies in cultured cells are often conducted using standard cell culture ware in
sealed chambers and require the use of a glove box to feed or add drug to cells in order to prevent undesired
changes in pericellular oxygen levels15,16. These chambers and glove boxes require large gas volumes to flush and
equilibrate the media, often probe only a single oxygen level, and are unable to perform studies requiring rapid
(< 30 min) cycles of hypoxia. Cycling hypoxia in tumors is caused by variations in red blood cell flux, and occurs
with periodicities on the order of minutes to hours to d ays11 and standard approaches can sample only a fraction
of these conditions. Microfluidic devices offer shorter diffusion distances, multiplexing capability and lower gas
volumes to address all of these l imitations17,18, but are not easily adopted by oncology laboratories. Alternatively,
standard cell culture ware with well inserts19,20 or gas-permeable bottoms21–23, offer better control of static oxygen
levels and rapid cycling and can be more readily incorporated into existing protocols using standard laboratory
equipment. However, changing media or dosing cells with these designs has not been demonstrated. Because
of this limitation, few studies have systematically probed multiple oxygen environments and cycling conditions
1
Department of Mechanical and Aerospace Engineering, NC State University, Raleigh, USA. 2UNC/NCSU Joint
Department of Biomedical Engineering, Campus Box 7115, Engineering Bldg 3, 1840 Entrepreneur Drive, Raleigh,
NC 27695‑7115, USA. 3Department of Biomedical Engineering, University of Mississippi, Oxford, MS, USA. *email:
mgamcsi@ncsu.edu
Scientific Reports | (2021) 11:4020 | https://doi.org/10.1038/s41598-021-83579-1 1
Vol.:(0123456789)www.nature.com/scientificreports/
(a) (b) pO2 (mmHg)
Recirculation / Column 1 Pipet Access 142.9
Lid (L)
UG SC
114.4
Filled Wells
LG 85.8
Manifold (M)
Row A B C D E F G H
57.2
pO2 @ well 0.45 21.7 41.9 61.1 80.9 99.3 119.2 141.1 (mmHg)
bottom
28.6
(c) (d) 0
Recirculation / Row A Single Pass / Row A
TP2
TP1
Column 1 2 3 4 5 6 7 8 9 10 11 12
Figure 1. Plate Design and Modeling. (a) Diagram of the plate cross-sections used to mathematically model
the oxygen distribution. Arrows show the direction of gas flow and are color-coded to represent the pO2 levels.
(b) Heat map of the predicted oxygen distribution generated across eight rows A–H in Column 1 of media-
filled wells by delivery of eight different gas mixtures recirculated from the lower to the upper channels. Labels
indicate the acrylic lid (L) and manifold (M), the silicone cover (SC) and the upper and lower channels formed
by the rubber upper gasket (UG) and lower gasket (LG), respectively. The predicted p O2 levels at the bottom of
wells in each row are listed below the row letter. (c) Heat map of predicted oxygen distributions along Row A
when gas is recirculated and (d) in Row A when gas is in single-pass mode. Oxygen sensors measure the pO2
levels at test points 1 (TP1) and 2 (TP2).
on drug response in tumor cells, which has inhibited the development of agents that can be targeted to the most
aggressive cancers.
We previously demonstrated two different 96 well plate designs that can culture cells under static and dynamic
hypoxia24,25. However, in both designs, feeding or adding drugs to the wells exposed the cells to normoxia and it
would typically take ~ 15 min to re-equilibrate the cells to hypoxia. This change in oxygen levels may stress the
cells and influence drug response. In this report, a modification of our both our previous technologies24,25 was
designed, fabricated and tested to enable cell feeding and/or drug dosing with minimal change in the pericellular
pO2 environment in all eight rows of a 96-well plate without the use of a glove box. This design uses a novel gas
recirculation route to shield the cells during the media change and greatly facilitates the study of drug response
of cultured cells under varying static and cycling pO2 levels.
Using our new design, we measured the drug dose–response of PANC-1 pancreatic carcinoma cells to tira-
pazamine and doxorubicin cultured under eight different static and eight different cycling pO2 levels. Compared
to cells under pO2 = 139 mmHg (‘normal’ incubator conditions, i.e. normoxia), PANC-1 cells show progressively
greater sensitivity to tirapazamine as static oxygen levels decrease. Interestingly, PANC-1 cells retained sensitiv-
ity to tirapazamine under cycling oxygen conditions where cells are exposed to non-hypoxic environments for
half of the cycle. In contrast, PANC-1 sensitivity to doxorubicin showed little change under a range of static or
cycling oxygen environments. This new device offers a screening approach to determine the toxicity response
under varying oxygen conditions.
Results
Design principle. The objective of this work is to provide a way to remove and add media or drug to wells in
a 96-well plate while maintaining eight different hypoxic conditions without the use of a glove box. The principle
behind this device is shown in Fig. 1a. Using the same mixing tree design as in our earlier publication25, and
two feed gases (95% air/5%CO2 and 95% N 2/5%CO2), eight different static or cycling gas mixtures are delivered
to channels below each row (A-H) of a permeable bottom 96-well plate. A 125 μm thick gas-permeable polydi-
methylsiloxane (PDMS) membrane that forms the bottom of each well. Gas mixtures delivered from below the
membranes only has to diffuse 125 μm to the cells grown on the upper surface so the pericellular environment
is dominated by the oxygen content of this gas. In the configuration shown in Fig. 1a, a low oxygen mixture
(pO2 = 0 mmHg) is delivered beneath the wells in Row A with the pO2 level delivered to each row increasing
by ~ 20 mmHg up to Rows H (pO2 = 141 mmHg). Unlike our earlier designs, this new device recirculates the gas
from beneath the plate to channels above the plate to effectively blanket the top surface of the wells with the same
pO2 level delivered from below. This design shields the cells from the ambient atmosphere, whether biological
safety cabinet or incubator, and maintains cells under any desired oxygen environment while media is removed
and added. In addition, when pipet access to the wells is not needed, the device can be operated in single pass
mode where the gas passing beneath the wells is vented to the surroundings (Fig. 1a).
Computational modeling. Mathematical modeling is key to designing and predicting the performance
of a recirculating plate. In order to recirculate gases and maintain pipet access to the culture wells, an acrylic
Scientific Reports | (2021) 11:4020 | https://doi.org/10.1038/s41598-021-83579-1 2
Vol:.(1234567890)www.nature.com/scientificreports/
A B C D E F G H
Recirculate mode
Predicted @ 100 μm 0.45 21.6 41.8 61.1 80.0 99.3 119.2 141.0
Measured @ 100 μm 0.35 ± 0.17 20.0 ± 0.4 40.3 ± 0.2 60.1 ± 0.1 79.0 ± 0.6 96.0 ± 0.3 114.0 ± 0.4 137.3 ± 0.6
Measured @ TP2 0 20.4 ± 0.4 40.8 ± 0.4 60.4 ± 0.5 79.0 ± 0.5 95.5 ± 0.5 115.0 ± 0.6 137.4 ± 2.0
Calculated Pericellular pO2 0.2 19.9 41.0 60.4 79.4 96.6 114.3 138.0
Single Pass Mode
Predicted @ 100 μm 3.9 24.9 44.6 63.2 81.6 100.4 119.9 141.0
Measured @ 100 μm 3.7 ± 0.4 21.8 ± 0.7 41.4 ± 0.8 65.1 ± 0.9 83.9 ± 0.5 104.7 ± 1.4 121 ± 1.4 139.2 ± 1.4
Predicted @ TP1 0.42 21.6 41.8 61.1 80.0 99.4 119.2 141.0
Measured @ TP1 0 19.7 ± 0.4 41.6 ± 1.8 60.6 ± 0.7 79.8 ± 1.3 97.2 ± 1.8 114.6 ± 0.4 138.8 ± 0.6
Calculated Pericellular pO2 1.9 20.5 41.5 62.9 81.9 101.0 118.0 139.0
Table 1. Predicted, measured and calculated pO2 Levels at 37 °C.
lid with access holes and a PDMS cover are used in this new design. Computational modeling is necessary to
determine whether the mass transport properties of these new components provide an adequate gas barrier to
shield the cells during media changes or drug dosing. This new device uses the same mixing tree from our earlier
design25 that combines two feed gases that, when warmed and humidified, can deliver eight different pO2 levels
flowing through the lower channels beneath the wells in Rows A to H25. Gas flow arrows in Fig. 1a are color-
coded to represent the eight different pO2 levels within that range.
Modeling was used to predict oxygen mass transfer capabilities across the eight different cell culture media-
filled wells in Column 1 and to the twelve wells in Row A of the plate with the new lid and cover in place. The
cross-sections of the columns and rows that were modeled are shown by the blue planes in Fig. 1a. Row A was
chosen for modeling as this is the most hypoxic environment on the plate and best demonstrates the capability
of the device to shield the cells from the ambient laboratory atmosphere. In recirculating mode, the predicted
oxygen levels across the device are shown in the heat map in Fig. 1b for the eight rows in Column 1 shown in
cross-section. This heat map indicates that the media in the wells has a uniform oxygen content from top to bot-
tom and that the flowing gas and 1 mm pipet access holes and underlying PDMS cover (PC) provide sufficient
isolation of the wells and media from the surrounding ambient atmosphere. This model predicts that cells grown
in Rows A to H will be exposed to pericellular pO2 levels between 0.5 and 141 mmHg at the well bottoms. As
gas flows at a rate of 25 mL/min down the channel beneath Row A wells, the oxygen content of the media in
the wells in Columns 1–12 remains unchanged ensuring that the oxygen content at this gas flow rate is uniform
down the length of the row as gas is recirculated (Fig. 1c). The pO2 levels exiting the channels at the top of the
plate were measured at test point 2 (TP2, Fig. 1c) to determine if the gas content is lost during the recirculation
circuit (see below). In single pass mode, the bottom of the wells is exposed to the gas delivered from below while
the upper surface equilibrates with the surrounding ambient atmosphere generating a vertical oxygen gradient
in each well (Fig. 1d). This gradient is stable as long as the oxygen conditions at the bottom of the well remain
dominated by the gas mixture delivered from below25. Table 1 shows the predicted pO2 levels in wells in both
recirculating and single pass modes. The model was also used to predict the oxygen content of the gas exiting the
device in single pass mode that were measured at test-point 1 (TP1, Fig. 1d) (see below) and these predictions
are also listed in Table 1.
Device fabrication. Based on the dimensions and materials evaluated in the models, the device was fab-
ricated and shown in an exploded view in Fig. 2A. Acrylic was used for the manifold (M1, M2) and lid (L) and
Buna-N rubber was used in fabricating the lower (LG) and upper (UG) gaskets that form the lower channels
beneath and upper channels above the wells, respectively. The mixing tree manifold (M1) provides eight different
static or cycling pO2 levels to each row of the plate as demonstrated p reviously25. The second gas-partitioning
24
manifold design (M2) that was characterized in an earlier study and is used here to deliver one static or cycling
pO2 level to Rows A-D and another static or cycling pO2 level to Rows E–H by providing precisely balanced
flow of the two input gases. The devices are held together by a metal clamp and the gas flow is redirected from
below to above the plates by eight flexible tubing loops that can be connected and disconnected for recirculating
or single pass of gas flow modes, respectively (Fig. 2B,C). The assembled device with manifold M1 is shown in
Fig. 2B and manifold M2 is shown in Fig. 2C. The device is switched to the recirculating mode only during media
changes or drug dosing in order to reduce water evaporation due to gas flowing above the w ells25.
Experimentally measured oxygen levels match predicted levels. The performance of the device
was first evaluated by measuring oxygen levels at the output of the manifold in single pass mode at test point 1
(TP1, Fig. 1d) and comparing the data to the model predictions (Table 1). The readings match well across each
row and demonstrate that the model is valid, and the gaskets provide good isolation in each lower channel from
the surrounding environment and from adjacent channels. Also shown in Table 1 are the measurements taken
after recirculating the gas to the upper channel and obtaining readings at the outlet (TP2, Fig. 1c). These data also
Scientific Reports | (2021) 11:4020 | https://doi.org/10.1038/s41598-021-83579-1 3
Vol.:(0123456789)www.nature.com/scientificreports/
(A) (B)
(L)
(SC)
(UG)
Gas Input 1
Permeable
Bottom Plate
(LG)
(C)
(SN) (M1)
Gas Input 2
(M2)
Figure 2. (A) A diagram showing the components of the device. The letters correspond to the structures shown
in Fig. 1 with the addition of two syringe needles (SN) to connect the gas feeds. Two different manifolds are
used. The mixing tree manifold (M1) is used to screen response to eight different oxygen environments. The gas
partitioning manifold (M2) supplies one oxygen environment to Rows A-D and a second oxygen environment
to Rows E–H. (B) Shows the assembled device with manifold M1 and (C) the assembled device with manifold
M2. The tubing loops recirculates the gas flow from below the permeable bottom wells in each row to over the
top of the media.
show that the system is gas-tight as there is little change in gas mixture content as the gas recycles from below
(TP1) to above (TP2).
The measured pO2 values in 200 μL of media in the wells at 37 °C using humidified gases in recirculating
and single pass modes are shown in Table 1. Due to the fragility of the fiber optic probes, these measurements
in the wells are obtained from a location 100 μm above the well bottom (see “Methods” section). The actual pO2
level at the well bottom where cells are cultured was calculated by averaging the values measured at 100 μm with
the TP1 measurements. Since the gas that is measured at TP1 is separated from the cells by the 125 μm thick
membrane, the top of the membrane, that is the pericellular location, is approximately half-way between these
two measured points. The pericellular pO2 levels in Rows A to H were calculated and shown in Table 1 for both
the recirculating and single pass modes. The device remains in single pass mode for most of the studies and these
levels are what are reported in the experiments performed in this study. These levels vary by < 2 mmHg from
our data presented earlier with the differences due to the use of 200 μL in this study compared to 300 μL used
earlier25. Recirculating mode is only used for feeding or dosing cells. In this mode, the calculated pO2 levels shown
in Table 1 are similar to single pass data with the biggest variation at the most hypoxic levels for cells in Row A.
The ability of the assembled device to tolerate media changes or drug doses without compromising hypoxia
was evaluated by assembling the device, recirculating humidified gases and placing the oxygen sensor in 200
μL of distilled water in a well in Row A as this row, being the lowest pO2 level, would be expected to be most
affected by a media change. The pO2 level between t = 0 and 5 min was ~ 0.5 mmHg (Fig. 3). The water was then
removed using a standard multichannel pipettor and the gas from the upper channel flooded the well, bringing
the measured pO2 level to zero. Water pre-equilibrated to pO2 = 0.5 mmHg was then added and the sensor reading
briefly spikes to ~ 1.4 mmHg but rapidly returns to a stable low reading within a minute. Overall, the pO2 levels
are perturbed for ~ 2 min during the water change.
PANC‑1 cell growth is unchanged under a range of pO2 levels between 2 and 139 mmHg. Cells
were seeded into the pre-warmed permeable-bottom 96-well plates in a standard biological safety cabinet (see
“Methods” section). The cell-filled plate was placed in a standard air/CO2 incubator to allow cells to attach for
24 h. Plates were clamped onto the manifold and gas flow was then initiated from two input gas cylinders and the
cells were grown under eight different static pO2 levels. As indicated in Table 1, the pericellular static pO2 levels
range from 2 to 139 mmHg in the single pass mode. After 72 h, the cells were stained and counted or assayed
using MTT. For counting, cell nuclei were stained and counted by image analysis as indicated in the Methods
section. This counting method was validated by seeding wells with 5,000, 10,000 and 20,000 cells, and show-
ing the resulting image-based cell counts yield the expected ratio of 1:2:4 under eight different static pO2 levels
Scientific Reports | (2021) 11:4020 | https://doi.org/10.1038/s41598-021-83579-1 4
Vol:.(1234567890)www.nature.com/scientificreports/
Figure 3. Time dependence of the oxygen levels measured at a point 100 μm above the membrane in the gas
recirculation system when mimicking media change process with each well containing 200 μL of water. Water
is removed at the 5 min timepoint and fresh pre-equilibrated water added at 6 min. The pO2 was measured in a
well in Row A.
(Supplementary Material, Fig. S1). Cell counting determined that there was no difference in the growth rate of
PANC-1 cells across the eight different static pO2 levels (Supplementary Material, Fig. S2). However, MTT
staining increased steadily from 139 to 2 mmHg (Supplementary Material; Fig. S2). Therefore, MTT absorbance
levels cannot be used to compare cell proliferation between cells grown under different oxygen conditions. MTT
absorbance does track with initial cell seeding number under a given pO2 level under both static and cycling pO2
environments (Supplementary Material, Figs. S3, S4). Therefore, the drug dosing studies presented herein are
normalized to the zero dose reading at a given pO2 level to correct for this oxygen-dependent MTT response.
Successful culture of cells in antibiotic-free media over 4 days, as demonstrated in Supplementary Material
Fig. S2, demonstrated that the pipet access holes, sealed below by the PDMS cover (PC, Fig. 2A) provided suf-
ficient protection from microbial contamination.
Drug response varies across multiple oxygen environments. After cell seeding and attachment for
24 h under standard incubator air/CO2 conditions as described above, cells were equilibrated under the eight
different static or cycling pO2 levels for 24 h. Just prior to drug dosing, the plate was switched to recirculating
mode for 1 h. Since media pre-equilibrated at eight different pO2 levels is needed to feed or dose the cells, an
identical ‘donor’ plate was filled with fresh media with or without drug and connected to the same gas mixtures
and in recirculating mode to pre-equilibrate the media with the necessary eight different pO2 conditions before
introduction to the cells. Two identical devices therefore are needed; one containing the cells cultured under the
desired eight different oxygen conditions and another donor plate to pre-equilibrate the media under these eight
different pO2 conditions.
Using mixing manifold, M1 (Fig. 2B) eight different oxygen environments were delivered to each row of the
96-well plate25. The measured eight static pO2 levels delivered by manifold M1 to the channels beneath the cells
are shown diagrammatically in Fig. 4A. In cycling experiments, all rows were exposed to a low pO2 (pO2low) level
of 2 mmHg for 20 min followed by immediate switching to eight different high pO2 (pO2hi) levels ranging from
2 to 139 mmHg for another 20 min. These cycles were repeated for 24 h. The relative amplitudes of the different
cycling patterns of gas delivered by the manifold M1 to the lower gas channels beneath each row is shown in
Fig. 4B. Note that in Row A in Fig. 4B, the gas ‘cycles’ between pO2low = 2 mmHg to pO2hi level of 2 mmHg, so
the pO2 level is essentially static. This is a convenient control and allows comparisons between sensitivity under
static and cycling environments as gas delivery to Row A is equivalent in Fig. 4A,B.
On a 96-well plate with each of eight rows exposed to a different pO2 level, 12 wells are under identical oxygen
environments. Therefore, in order to perform dose–response measurements in triplicate, four doses of drugs can
be tested at each oxygen environment. For tirapazamine, the four doses tested were 0, 10, 30 and 90 μM and were
selected based on the reported sensitivities of PANC-1 to tirapazamine ( IC50 = 77 μM (normoxia), IC50 = 14 μM
(hypoxia)26. Under static conditions, the pericellular pO2 values range from 2 mmHg (Row A) up to 139 mmHg
(Row H) in this device. Due to the dependence of MTT metabolism on oxygen content (Supplementary Material,
Fig. S2), the MTT readings at each pO2 level were normalized to the reading at zero dose at each pO2 level. The
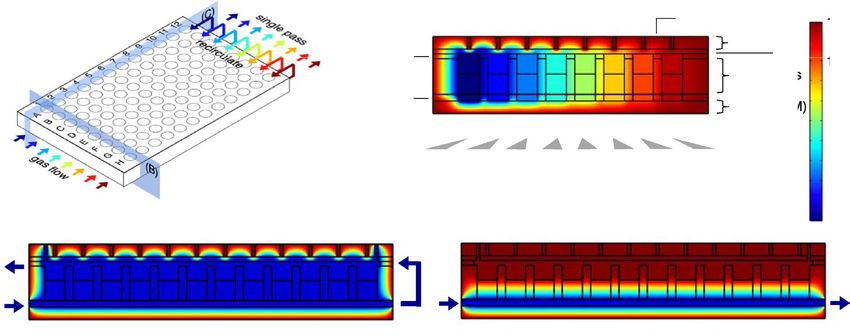
results in Fig. 4C show that PANC-1 cells were more sensitive to tirapazamine under low pO2 levels as the relative
level of MTT staining progressively decreases with decreasing pO2 levels. At most doses, there are statistically
different responses for the different oxygen levels compared to the data in Row A (pO2 = 2 mmHg).
The data for PANC-1 cells exposed to oxygen cycles and increasing doses of tirapazamine are shown in
Fig. 4D. The amplitude of the cycles (pO2low-pO2hi) is given below the graph in Fig. 4D. For this drug, only the
largest cycling amplitudes (Rows F to H) show any significant difference in response to the different drug doses
when compared to Row A.
For doxorubicin, we examined the drug dose response under 0, 1, 3 and 9 μM, based on the reported doxo-
rubicin IC50 (0.5–2 μM) for PANC-1 cells under normoxia27,28. Figure 4E shows the relative MTT staining
of PANC-1 to doxorubicin across the different oxygen environments. Compared to Row A, drug sensitivity
decreases slightly in Rows B-F, but the magnitudes of these differences are much less than those observed for
Scientific Reports | (2021) 11:4020 | https://doi.org/10.1038/s41598-021-83579-1 5
Vol.:(0123456789)www.nature.com/scientificreports/
Figure 4. Drug dose response studies of PANC1 cells under (A) static pO2 levels delivered to the lower channels
for each row and (B) and cycling pO2 levels with switching between pO2(hi) and pO2(lo) amplitudes indicated.
(C) Dose response to tirapazamine under static and (D) cycling conditions. (E) Dose response to doxorubicin
under static and (F) cycling conditions. *p < 0.05 relative to Row H at lowest dose; †p < 0.05 relative to Row H at
middle dose; ‡p < 0.05 relative to Row H at highest dose.
tirapazamine. Under cycling conditions, only Row D shows significant difference at all doses compared to Row
A. The largest cycling amplitude of 2–139 mmHg (Row H) is statistically identical at all doses when compared
to Row A.
Although the data in Fig. 4 give an indication of relative sensitivity, the few doses tested are not sufficient to
evaluate an I C50 with any confidence. Therefore, two of the pO2 levels tested were selected for a more detailed I C50
determinations using the second manifold design, M2 (Fig. 2C), that allows up to 16 doses in triplicate under
one of two different pO2 levels. For tirapazamine, a total of seven doses of drug (including the zero dose control)
were used to compare the I C50 at static levels of pO2 = 2 and 139 mmHg. Figure 5A shows that the I C50 decreases
from 99.6 μM at 139 mmHg to 6.35 μM at 2 mmHg; an approximately 16-fold decrease. For cycling, the IC50 was
determined at cycles of 2–139 mmHg and 2–2 mmHg (i.e. static) conditions. Figure 5B shows the 2–2 mmHg
IC50 = 7.45 μM which increases as PANC-1 cells are exposed to cycles of 2–139 mmHg with an I C50 = 17.72 μM.
For doxorubicin, seven doses were tested at static pO2 levels of 139 mmHg and 2 mmHg. The data show statis-
tically significant differences at many dose levels, but the fitting of the data shows only a small difference in I C50
values of 3.35 and 2.60 μM at 139 and 2 mmHg, respectively (Fig. 5C). Under the cycling pO2 level of 2–2 mmHg,
the IC50 = 2.19 μM is similar to the value found for the 2–139 mmHg cycles with an IC50 = 2.38 μM (Fig. 5D). Both
the tirapazamine and doxorubicin data shown in Fig. 5 are consistent with the four dose data shown in Fig. 4.
Discussion
Drug screening is most often done under incubator conditions of pO2 ~ 140 mmHg which is much higher than
the range found in healthy tissue (30–75 mmHg) or in tumors (30 – 0 mmHg)3. The widespread use of relatively
gas impermeable polystyrene plates with cells cultured on the bottom surface below a few millimeters of growth
media means that even in a standard incubator, the pericellular pO2 levels are likely lower than the applied
atmosphere and constantly changing as cells grow and alter their oxygen consumption29–31. Even in hypoxia
studies, usually only one low pO2 level is probed and cells are again cultured under a layer of media in imperme-
able plates, so the actual oxygen content is often unknown. Therefore, a comparison between ‘normoxia’ and
‘hypoxia’ drug response is difficult to interpret without a knowledge of the oxygen conditions at the cellular level.
Scientific Reports | (2021) 11:4020 | https://doi.org/10.1038/s41598-021-83579-1 6
Vol:.(1234567890)www.nature.com/scientificreports/
Figure 5. Drug dose response of PANC1 cells to (A) tirapazamine under static and (B) under cycling hypoxia
and (C) doxorubicin under static and (D) cycling hypoxia conditions.
Permeable bottom plates are commercially available and designed to address this p roblem21,23. However, since
tumors can display essentially an infinite range of static and cycling oxygen conditions, the drug response needs
to be assessed under a range of conditions. Clinical studies have shown that a significant fraction of hypoxic
tissue in patient tumors is a negative prognostic f actor10 and more recent work suggest that cycling hypoxia is
“…a more serious problem for cancer patient treatment…” than static h ypoxia12. Unfortunately, therapy response
studies under cycling hypoxia are rare due to the fact that the equipment (glove box, hypoxia chambers) are
not readily amenable to rapid (< 30 min) gas exchange cycles that are one component of the changing oxygen
landscape found in t umors11.
Our technologies were developed to be readily adaptable to current protocols used in oncology and phar-
macology laboratories. The 96-well plate format is a familiar culture vessel that is widely used and amenable
to standard multichannel pipettors and plate readers. The experiments outlined herein can be duplicated in
microdevices32 but these devices are not routinely used in many laboratories. In earlier devices from our previous
work, the pericellular pO2 levels in permeable bottom dishes/plates are dominated by the gas delivery from below
the membrane21,23,25. This ‘open well’ design is simple to fabricate and easy to use and works well for profiling
molecular content25 or kinetics of response to pO2 changes24. However, in those designs, if media is removed, the
cells would be exposed to the incubator or biosafety cabinet pO2 and addition of fresh media, with or without
drug, would take ~ 10–15 min25 to re-equilibrate at the desired oxygen level. The principle behind this new device
was to protect cells from the surrounding environments by temporarily blanketing the media upper surface and
cells with the same gas mixture that is delivered from below. Therefore, when media is removed, the cells do not
experience a large shift in oxygen level. Our modeling and experimental measurements show that the small pipet
access holes and PDMS cover shields the cells from the surrounding atmosphere. PDMS is highly permeable
to oxygen but the combination of gas flow and small pipet access holes in the relatively impermeable acrylic lid
provide a sufficient barrier to isolate each row of wells from the surrounding atmospheres and the gaskets are
sufficient to prevent cross-talk between gas mixtures from neighboring rows. The pipet access holes were sized
to allow the use of commercially available narrow pipet tips.
PANC-1 cell growth is unchanged under the range of static oxygen levels when determined by cell counting.
However, as oxygen levels decrease, the MTT absorbance readings significantly increase for statistically identical
cell numbers. This is likely due to the influence of oxygen on the processes that affect MTT metabolism. Therefore,
using MTT as a comparative measure of PANC-1 cell number or proliferation between two different oxygen
atmospheres would be misleading and these data serve as a caveat for the use of MTT for comparing cell growth
or response in different environments. However, under a specific pO2 level, MTT staining tracks with PANC-1
cell number so this assay is valid as long as the oxygen level within a test group is unchanged. Studies of MTT
and other proliferation assays in different cell lines as a function of oxygen environment are now underway.
This new technology is suitable for toxicity studies under static or cycling oxygen environments. As expected,
tirapazamine is significantly more effective under low oxygen levels, and the sensitivity of PANC-1 cells to this
Scientific Reports | (2021) 11:4020 | https://doi.org/10.1038/s41598-021-83579-1 7
Vol.:(0123456789)www.nature.com/scientificreports/
drug progressively increases as the oxygen levels decrease. The 16-fold increase in sensitivity to tirapazamine
on changing from normoxic to hypoxic conditions are comparable to the 6-fold26 or 14-fold33 changes observed
previously.
Our earlier work showed that cycling oxygen, between pO2 levels of 135 and 1 mmHg, induced a 2.5-fold
increase in HIF-1α levels, a 2.1-fold increase in glucose uptake and 4.0-fold increase in aldehyde dehydrogenase
activities in the PANC-1 cell line compared to static h ypoxia24,25. In this study, cycles of 139–2 mmHg produced
a 2.4-fold increase but only a 1.1-fold difference decrease in the sensitivity of PANC-1 cells to tirapazamine and
doxorubicin, respectively, compared to static hypoxia. Although the 139–2 mmHg amplitude cycle is not physi-
ologically relevant, a sample of earlier studies show similar amplitudes are often used in cycling e xperiments34,35,
and may provide a good test of the most extreme stress that can be applied to cells. However, cycles that are
physiologically possible, such as those in Row B to E in Fig. 4D,F, show only small differences in drug sensitiv-
ity compared to static hypoxia in Row A. This may change as cycle periods or durations are changed. These
parameters can easily be adjusted by altering the setting in the gas flow controllers. We will continue to focus our
studies on static and dynamically changing oxygen environments that may occur in patient tumors to determine
markers of cell physiology and to screen anticancer therapies.
Methods
Cell culture. The human PANC-1 pancreatic adenocarcinoma cell line was purchased from the American
Type Culture Collection (Cat# CRL-1469) and grown in high glucose Dulbecco’s Modified Eagle’s Medium
with 10% fetal bovine serum (Gibco) without antibiotics. For all drug dosing experiments, harvested cells were
seeded onto our custom plates that were pre-warmed to 37 °C to reduce thermal gradients in order to minimize
the ‘edge effect’ often seen in 96-well plates25. Cells were allowed to attach for 24 h under 95% air/5% CO2 atmos-
pheres before placement in the gas manifold for variable oxygen experiments.
Growth of PANC-1 cells under different oxygen conditions was determined by cell counting using automated
image analysis of cells stained with 4′,6-diamidino-2-phenylindole (DAPI). The images were acquired from
four different wells under identical conditions and nuclei were delineated and enumerated using NIH ImageJ
software36 and the average and standard deviation were computed for each pO2 level. In parallel, cell prolifera-
tion was also monitored by 3-(4,5-dimethylthiazol-2-yl)-2,5- diphenyltetrazolium bromide (MTT) a ssay37. For
analyzing MTT dose–response data, the MTT absorbance at each pO2 level was normalized to the absorbance
reading at the zero dose for that pO2 level. To validate counting or MTT assays, cells were harvested by trypsiniza-
tion, counted with a hemacytometer and seeded at levels of 5,000, 10,000 and 20,000 cells per well and allowed
to attach for 6 h under normal incubator conditions. Cells were then exposed to eight different static or cycling
conditions for 24 h before counting or MTT assays.
Device fabrication. The manifolds (M1), and (M2) (Fig. 2) and lid (L) (Fig. 2) were fabricated from cast
polymethylmethacrylate (acrylic) polymer sheets (McMaster-Carr, Catalog #8589K62) using a laser cutter to
etch the gas channels. One mm circular holes were cut into the lid using a laser cutter for pipet access. A 2 mm
thick PDMS membrane (McMaster-Carr, Catalog # 86915K16) was used to produce the cover (SC) (Fig. 2).
This cover was pierced with a razor knife to facilitate pipet access to the wells. Buna-N rubber (McMaster-Carr,
Catalog #8635K812) was used to fabricate the upper (UG) and lower gaskets (LG) (Fig. 2) and was cut with a
laser cutter. Tygon gas tubing (VWR, catalog #89404-068, OD = 5/32 in, ID = 3/32 in) was used to recirculate gas
flow from the lower to upper channels.
The permeable-bottom 96-well plates were fabricated by attaching a 125 μm thick PDMS membrane to
bottomless 96-well plates (Greiner Bio-One, Catalog# 655000-06) by the procedure outlined in our earlier
publications24,25. The PDMS membrane was coated with a 50 μg·mL−1 fibronectin solution (Sigma-Aldrich,
Product Number F1141) for 6 h and rinsed with phosphate-buffered saline prior to use in cell studies.
Drug treatment. Tirapazamine (Sigma-Aldrich, Catalog #27314-97-2), and doxorubicin (Sigma-Aldrich,
Catalog #25316-40-9) were used to treat PANC-1 cells. 5000 PANC-1 cells were seeded in each well, allowed to
attach under normoxia for 24 h and cultured in the device under the desired static or cycling low pO2 conditions
for an additional 24 h. Narrow pipet tips (VWR, Catalog #37001-152) were used to access wells to remove media
and to add fresh media/drug. After drug addition, the cells were cultured with drugs for 48 h. Cell proliferation
was determined by MTT assay.
Two gas manifolds were used in the drug dosing studies. The first was reported in our earlier study25 and
incorporates a mixing tree and combines two input gases to produce eight different static or cycling oxygen
mixtures. This design enables four drug doses to be done in triplicate at each of the eight pO2 levels. The second,
gas partitioning manifold, was reported in our later s tudy24 and allows four rows of the plate to be set to one static
or cycling oxygen level and the other four rows set to a second different pO2 level. This plate enables a maximum
of 16 different drug doses to be done in triplicate at two pO2 levels.
Oxygen sensing. Oxygen readings in gas mixtures, water and cell growth media were obtained using
140 μm diameter fiber optic sensors (Profiling Oxygen Microsensor, PreSens, Germany). PreSens specifications
indicate a sensitivity down to pO2 = 0.4 mmHg38. Sensors were calibrated each day by a two-point calibration
method as detailed p reviously25. Due to their fragility, the optical fiber is positioned within its needle bevel hous-
ing 100 μm short of the needle tip. Therefore, by placing the steel needle tip on the membrane at the bottom of
the well, the sensor provides readings at a point 100 μm above the membrane. This partially retracted position
did not measurably affect oxygen readings25.
Scientific Reports | (2021) 11:4020 | https://doi.org/10.1038/s41598-021-83579-1 8
Vol:.(1234567890)www.nature.com/scientificreports/
Gas flow control. Gas supplied to culture plates was delivered by mass flow controllers (Aalborg) directed
by LabView-based software (National Instruments). All experiments used two feed gas mixtures for delivery to
the plate mixing tree and manifold: Gas Input 1: 95% N
2/5% CO2, and Gas Input 2: 95% air/5% C
O2. For cycling
experiments, gas flow rates and switching were controlled with a LabView program.
Theoretical modeling. The designs of the gas channels, manifold, gas recycling system and 96-well plates
were evaluated by modeling the theoretical gas transfer capabilities of each design by finite element analysis
using COMSOL Multiphysics software (RRID: SCR_014767). The “Transport of Diluted Species” and “Laminar
Flow” toolboxes in COMSOL were used to create models of oxygen transport in the gas channels, manifold and
plate. The oxygen diffusion coefficients through culture media and the polymers and other materials used in this
modeling are provided in Supplementary Materials, Table S5.
Data availability
The data analyzed in this study are available from the corresponding author upon request.
Received: 7 July 2020; Accepted: 18 January 2021
References
1. Vaupel, P., Höckel, M. & Mayer, A. Detection and characterization of tumor hypoxia using pO2 histography. Antioxid. Redox Signal.
9, 1221–1235. https://doi.org/10.1089/ars.2007.1628 (2007).
2. Vaupel, P. & Mayer, A. Hypoxia in tumors: pathogenesis-related classification, characterization of hypoxia subtypes, and associated
biological and clinical implications. Adv. Exp. Med. Biol. 812, 19–24. https://doi.org/10.1007/978-1-4939-0620-8_3 (2014).
3. Carreau, A., El Hafny-Rahbi, B., Matejuk, A., Grillon, C. & Kieda, C. Why is the partial oxygen pressure of human tissues a crucial
parameter? Small molecules and hypoxia. J. Cell. Mol. Med. 15, 1239–1253. https://doi.org/10.1111/j.1582-4934.2011.01258.x
(2011).
4. Yun, Z. & Lin, Q. Hypoxia and regulation of cancer cell stemness. Adv. Exp. Med. Biol. 772, 41–53. https://doi.org/10.1007/978-
1-4614-5915-6_2 (2014).
5. Rankin, E. B. & Giaccia, A. J. Hypoxic control of metastasis. Science 352, 175–180. https://doi.org/10.1126/science.aaf4405 (2016).
6. Schito, L. & Semenza, G. L. Hypoxia-inducible factors: Master regulators of cancer progression. Trends Cancer 2, 758–770. https
://doi.org/10.1016/j.trecan.2016.10.016 (2016).
7. Vaupel, P., Mayer, A. & Hockel, M. Tumor hypoxia and malignant progression. Methods Enzymol. 381, 335–354 (2004).
8. Brown, J. M. & Wilson, W. R. Exploiting tumour hypoxia in cancer treatment. Nat. Rev. Cancer 4, 437–447. https: //doi.org/10.1038/
nrc1367 (2004).
9. Teicher, B. A. Hypoxia and drug resistance. Cancer Metastasis reviews 13, 139–168 (1994).
10. Vaupel, P. & Mayer, A. Hypoxia in cancer: Significance and impact on clinical outcome. Cancer Metastasis Rev. 26, 225–239. https
://doi.org/10.1007/s10555-007-9055-1 (2007).
11. Dewhirst, M. W. Relationships between cycling hypoxia, HIF-1, angiogenesis and oxidative stress. Radiat. Res. 172, 653–665. https
://doi.org/10.1667/RR1926.1 (2009).
12. Tellier, C. et al. Cycling hypoxia induces a specific amplified inflammatory phenotype in endothelial cells and enhances tumor-
promoting inflammation in vivo. Neoplasia 17, 66–78. https://doi.org/10.1016/j.neo.2014.11.003 (2015).
13. Strese, S., Fryknas, M., Larsson, R. & Gullbo, J. Effects of hypoxia on human cancer cell line chemosensitivity. BMC Cancer 13,
331. https://doi.org/10.1186/1471-2407-13-331 (2013).
14. Onozuka, H., Tsuchihara, K. & Esumi, H. Hypoglycemic/hypoxic condition in vitro mimicking the tumor microenvironment
markedly reduced the efficacy of anticancer drugs. Cancer Sci. 102, 975–982 (2011).
15. Byrne, M. B., Leslie, M. T., Gaskins, H. R. & Kenis, P. J. Methods to study the tumor microenvironment under controlled oxygen
conditions. Trends Biotechnol. 32, 556–563. https://doi.org/10.1016/j.tibtech.2014.09.006 (2014).
16. Pavlacky, J. & Polak, J. Technical feasibility and physiological relevance of hypoxia cell culture models. Front. Endocrinol. 11, 57.
https://doi.org/10.3389/fendo.2020.00057 (2020).
17. Young, E. W. K. Cells, tissue, and organs on chips: Challenges and opportunities for the cancer tumor microenvironment. Integr.
Biol. 5, 1096–1109 (2013).
18. Young, E. W. K. & Beebe, D. J. Fundamentals of microfluidic cell culture in controlled microenvironments. Chem. Soc. Rev. 39,
1036–1048 (2010).
19. Brennan, M. D., Rexius-Hall, M. L. & Eddington, D. T. A 3D-printed oxygen control insert for a 24-well plate. PLoS ONE 10,
e0137631. https://doi.org/10.1371/journal.pone.0137631 (2015).
20. Oppegard, S. C., Nam, K. H., Carr, J. R., Skaalure, S. C. & Eddington, D. T. Modulating temporal and spatial oxygenation over
adherent cellular cultures. PLoS ONE 4, e6891 (2009).
21. Jensen, M. D., Wallach, D. F. H. & Sherwood, P. Diffusion in tissue cultures on gas-permeable and impermeable supports. J. Theor.
Biol. 56, 443–458 (1976).
22. Minoves, M. et al. An innovative intermittent hypoxia model for cell cultures allowing fast Po2 oscillations with minimal gas
consumption. Am. J. Physiol. Cell. Physiol. 313, C460-c468. https://doi.org/10.1152/ajpcell.00098.2017 (2017).
23. Polak, J., Studer-Rabeler, K., McHugh, H., Hussain, M. A. & Shimoda, L. A. System for exposing cultured cells to intermittent
hypoxia utilizing gas permeable cultureware. Gen. Physiol. Biophys. 34, 235–247. https://doi.org/10.4149/gpb_2014043 (2015).
24. Yao, M. et al. Flow-encoded oxygen control to track the time-dependence of molecular changes induced by static or cycling hypoxia.
Anal. Chem. 91, 15032–15039. https://doi.org/10.1021/acs.analchem.9b03709 (2019).
25. Yao, M. et al. Mixing and delivery of multiple controlled oxygen environments to a single multiwell culture plate. Am. J. Physiol.
Cell Physiol. 315, C766–C775 (2018).
26. Tsakos, M. et al. Total synthesis and biological evaluation of Rakicidin A and discovery of a simplified bioactive analogue. Angew.
Chem. 55, 1030–1035. https://doi.org/10.1002/anie.201509926 (2016).
27. Varbanov, H. P., Kuttler, F., Banfi, D., Turcatti, G. & Dyson, P. J. Repositioning approved drugs for the treatment of problematic
cancers using a screening approach. PLoS ONE 12, e0171052. https://doi.org/10.1371/journal.pone.0171052 (2017).
28. Gervasoni, J. E. Jr. et al. An effective in vitro antitumor response against human pancreatic carcinoma with paclitaxel and dauno-
rubicin by induction of both necrosis and apoptosis. Anticancer Res. 24, 2617–2626 (2004).
29. Place, T. L., Domann, F. E. & Case, A. J. Limitations of oxygen delivery to cells in culture: An underappreciated problem in basic
and translational research. Free Radic. Biol. Med. 113, 311–322. https://doi.org/10.1016/j.freeradbiomed.2017.10.003 (2017).
30. Keeley, T. P. & Mann, G. E. Defining physiological normoxia for improved translation of cell physiology to animal models and
humans. Physiol. Rev. 99, 161–234. https://doi.org/10.1152/physrev.00041.2017 (2019).
Scientific Reports | (2021) 11:4020 | https://doi.org/10.1038/s41598-021-83579-1 9
Vol.:(0123456789)www.nature.com/scientificreports/
31. Al-Ani, A. et al. Oxygenation in cell culture: Critical parameters for reproducibility are routinely not reported. PLoS ONE 13,
e0204269. https://doi.org/10.1371/journal.pone.0204269 (2018).
32. Brennan, M. D., Rexius-Hall, M. L., Elgass, L. J. & Eddington, D. T. Oxygen control with microfluidics. Lab Chip 14, 4305–4318.
https://doi.org/10.1039/c4lc00853g (2014).
33. Jacobsen, K. M. et al. APD-containing cyclolipodepsipeptides target mitochondrial function in hypoxic cancer cells. Cell Chem.
Biol. 25, 1337-1349.e1312. https://doi.org/10.1016/j.chembiol.2018.07.010 (2018).
34. Hsieh, C. H. et al. NADPH oxidase subunit 4-mediated reactive oxygen species contribute to cycling hypoxia-promoted tumor
progression in glioblastoma multiforme. PLoS ONE 6, e23945 (2012).
35. Gupta, R. et al. Downregulation of uPA/uPAR inhibits intermittent hypoxia-induced epithelial-mesenchymal transition (EMT)
in DAOY and D283 medulloblastoma cells. Int. J. Oncol. 38, 733–744 (2011).
36. Schneider, C. A., Rasband, W. S. & Elcieri, K. W. NIH Image to ImageJ: 25 years of image analysis. Nat. Methods 9, 671–675 (2012).
37. Rexen, P., Klerulff, J. V. & Emborg, C. An easy-to-handle semi-automated method for media development using a colorimetric
viability assay and fractional factorial design. Cytotechnology 8, 195–205 (1992).
38. PreSens. Profiling Oxygen Microsensor PM-PSt1, https://www.presens.de/products/detail/profiling-oxygen-microsensor-pm-pst1.
html.
Author contributions
M.Y., G.W. and M.P.G. designed the study. M.Y. acquired the data. M.Y. and M.P.G. analyzed the data. M.Y.,
G.W. and M.P.G. interpreted the results. M.Y., G.W. and M.P.G. drafted and edited the manuscript and approved
the final version.
Funding
Funding was funded by National Institutes of Health (Grant no. R21CA202804).
Competing interests
The authors declare no competing interests.
Additional information
Supplementary Information The online version contains supplementary material available at https://doi.
org/10.1038/s41598-021-83579-1.
Correspondence and requests for materials should be addressed to M.P.G.
Reprints and permissions information is available at www.nature.com/reprints.
Publisher’s note Springer Nature remains neutral with regard to jurisdictional claims in published maps and
institutional affiliations.
Open Access This article is licensed under a Creative Commons Attribution 4.0 International
License, which permits use, sharing, adaptation, distribution and reproduction in any medium or
format, as long as you give appropriate credit to the original author(s) and the source, provide a link to the
Creative Commons licence, and indicate if changes were made. The images or other third party material in this
article are included in the article’s Creative Commons licence, unless indicated otherwise in a credit line to the
material. If material is not included in the article’s Creative Commons licence and your intended use is not
permitted by statutory regulation or exceeds the permitted use, you will need to obtain permission directly from
the copyright holder. To view a copy of this licence, visit http://creativecommons.org/licenses/by/4.0/.
© The Author(s) 2021
Scientific Reports | (2021) 11:4020 | https://doi.org/10.1038/s41598-021-83579-1 10
Vol:.(1234567890)You can also read