THE CLINICAL INFECTION WITH PIGEON CIRCOVIRUS (PICV) LEADS TO LYMPHOCYTE B APOPTOSIS BUT HAS NO EFFECT ON LYMPHOCYTE T SUBPOPULATION
←
→
Page content transcription
If your browser does not render page correctly, please read the page content below
pathogens
Article
The Clinical Infection with Pigeon Circovirus (PiCV)
Leads to Lymphocyte B Apoptosis But Has No Effect
on Lymphocyte T Subpopulation
Tomasz Stenzel 1, * , Daria Dziewulska 1 , Bartłomiej Tykałowski 2             and Andrzej Koncicki 1
 1   Department of Poultry Diseases, Faculty Veterinary Medicine, University of Warmia and Mazury in Olsztyn,
     10-719 Olsztyn, Poland; daria.pestka@uwm.edu.pl (D.D.); koncicki@uwm.edu.pl (A.K.)
 2   Department of Microbiology and Clinical Pathology, Faculty of Veterinary Medicine, University of Warmia
     and Mazury in Olsztyn, 10-719 Olsztyn, Poland; bartlomiej.tykalowski@uwm.edu.pl
 *   Correspondence: tomasz.stenzel@uwm.edu.pl; Tel.: +48-89-523-38-11

 Received: 16 July 2020; Accepted: 1 August 2020; Published: 3 August 2020

 Abstract: The pathology of pigeon circovirus (PiCV) is still unknown, but it is regarded as an
 immunosuppressant. This study aimed to find a correlation between PiCV natural infection and
 immunosuppression. The study was conducted with 56 pigeons divided into the following groups:
 PiCV-positive but showing (group S) or not (group I) non-specific clinical symptoms and asymptomatic
 pigeons negative for PiCV (group H). The percentage and apoptosis of T CD3+ and B IgM+ splenocytes;
 the expression of CD4, CD8, and IFN-γ genes in splenic mononuclear cells; the number of PiCV viral
 loads in the bursa of Fabricius; and the level of anti-PiCV antibodies were analyzed. The results
 showed that the percentage of B IgM+ cells was almost two-fold lower in group S than in group H,
 and that ca. 20% of the lymphocytes were apoptotic. No increased apoptosis was detected in TCD3+
 subpopulation. The PiCV viral loads were approximately one thousand and ten thousand times
 higher in group S than in groups I and H, respectively. Our results indicate a possible correlation
 between the number of PiCV viral loads and severity of PiCV infection and confirm that PiCV
 infection leads to the suppression of humoral immunity by inducing B lymphocyte apoptosis.

 Keywords: apoptosis; digital droplet PCR; flow cytometry; lymphocytes; pigeons; pigeon circovirus

1. Introduction
     One of the most significant infectious agents found in pigeons is the pigeon circovirus (PiCV),
which belongs to the genus Circovirus and the family Circoviridae [1]. The circovirus infection in pigeons
was initially documented almost 30 decades ago in Canada, the USA, and Australia [2,3]. Today, PiCV is
distributed worldwide with an average prevalence at ca. 70% [4]. Asymptomatic infections with this
virus are quite common and were noted in ca. 44% of domestic pigeons, on average, in Poland and in ca.
63% of domestic pigeons in China [5–7]. The virus is transmitted mainly horizontally through ingestion
or inhalation of virus-contaminated fecal material and feather dust [8]. The high PiCV prevalence
results from the specifics of pigeon breeding and rearing system. Bird racing, pigeon exhibitions,
and “one loft race” breeding facilities could contribute to the rapid spread of PiCV infections in pigeon
populations and to the production of recombinant variants of the virus, as has been noted for other
avian circoviruses such as those infecting parrots [9]. The recombination events often detected in
pigeon circovirus genome could result from the procedures mentioned above [5,10,11].
     The pathology of PiCV infections in pigeons has not been fully investigated to date. PiCV mainly
targets the bursa of Fabricius (bF), but its genetic material has also been detected in other organs
associated with the immune system, including the thymus and the spleen. The virus or its genetic

Pathogens 2020, 9, 632; doi:10.3390/pathogens9080632                          www.mdpi.com/journal/pathogens
Pathogens 2020, 9, x FOR PEER REVIEW 2 of 14
PathogensThe 9, 632
2020,pathology 2 of 12
of PiCV infections in pigeons has not been fully investigated to date. PiCV mainly
targets the bursa of Fabricius (bF), but its genetic material has also been detected in other organs
associated with the immune system, including the thymus and the spleen. The virus or its genetic
material have also been detected in various organs of the digestive tract and also in the skin,
material have also been detected in various organs of the digestive tract and also in the skin, thyroid
thyroid gland, and third eyelid [5,12,13]. Pigeon circovirus infections have led to the loss of lymphoid
gland, and third eyelid [5,12,13]. Pigeon circovirus infections have led to the loss of lymphoid tissue
tissue in immune system organs, and for this reason, PiCV is regarded as an immunosuppressive
in immune system organs, and for this reason, PiCV is regarded as an immunosuppressive agent in
agent in pigeons [14,15]. A higher prevalence of accompanying infections with various pathogens
pigeons [14,15]. A higher prevalence of accompanying infections with various pathogens in PiCV-
in positive
PiCV-positive
pigeons pigeons suggests
suggests that thatcould
this virus this induce
virus immunosuppression
could induce immunosuppression
[15–17]. The mechanism[15–17].
Theofmechanism of immunosuppression
immunosuppression induced by PiCV induced
has notbybeen
PiCVthoroughly
has not been thoroughly
elucidated, but elucidated, but it
it appears that
appears that PiCV infections cause lymphocyte damage [15]. The porcine circovirus
PiCV infections cause lymphocyte damage [15]. The porcine circovirus type 2 and duck circovirus type 2 and duck
circovirus can activate
can activate lymphocyte lymphocyte
apoptosis apoptosis [18,19],
[18,19], and and a mechanism
a similar similar mechanism
could becould be involved
involved in PiCV in
PiCV infection.
infection. TheThe laboratory
laboratory protocol
protocol for PiCV
for PiCV culturing
culturing has nothas notdeveloped
been been developed yet,iswhich
yet, which is why
why there
there is no possibility of performing an experimental challenge with this
is no possibility of performing an experimental challenge with this virus. The above makes virus. The above makes
performing
performing experiments
experiments with
withPiCV
PiCVdifficult,
difficult,but
butinvestigations with pigeons
investigations with pigeonsnaturally
naturallyinfected
infected with
with
thethe circovirus
circovirus areare a possible
a possible alternative[20].
alternative [20].
ThisThis study
study aimed
aimed totoanswer
answerwhether
whetherthere
thereisis any
any correlation
correlation between
betweenPiCV
PiCVnatural
naturalinfection
infectionand
and
immunosuppression and, if yes, which main mechanisms of immunity are
immunosuppression and, if yes, which main mechanisms of immunity are impaired by the virus. impaired by the virus.
2. Results
2. Results
2.1.2.1.
Flow Cytometry
Flow Analyses
Cytometry Analyses
2.1.1. The Percentage ofofT TCD3+ +and B IgM+ Lymphocytesininthe
theSpleen
Spleen
2.1.1. The Percentage CD3 and B IgM+ Lymphocytes
Representative figures
Representative figuresofofallallcytometric
cytometricanalyses
analyses of splenic mononuclearcells
splenic mononuclear cellsisolated
isolated from
from thethe
examined pigeons are shown in
examined pigeons are shown in Figure 1.Figure 1.
Figure 1. Representative
Figure 1. Representativefigures
figuresofofresults
resultsof
ofthe
theflow
flow cytometry
cytometry of of mononuclear
mononuclearcellscellsisolated
isolated from
from
thethe
spleen of pigeons with different PiCV infectious status: (A) the lymphocyte gate;
spleen of pigeons with different PiCV infectious status: (A) the lymphocyte gate; (B) density plots (B) density
plots of the extracellular staining for +Tand
CD3 + and B IgM+ ; (C) density plots of the Annexin V
of the extracellular staining for T CD3 B IgM +; (C) density plots of the Annexin V and 7-AAD
andstaining.
7-AADThreestaining. Three states of the cells were
states of the cells were identified: viable identified: viable
cells, located cells,
lower located
left/Q3 (Annexinlower left/Q3
V-APC/
(Annexin
7-AAD V-APC/ 7-AAD
= −/−); early = −/−);cells,
apoptotic earlylocated
apoptotic cells,
lower located
right/Q4 lower right/Q4
(Annexin V-APC/(Annexin
7-AAD = V-APC/ 7-AAD
+/−); necrotic
= +/−); necrotic and late apoptotic cells, located upper part/Q1 and Q2 (Annexin V-APC/ 7-AAD = −/+
and +/+). The samples were standardized to 1 × 10⁶ of mononuclear cells.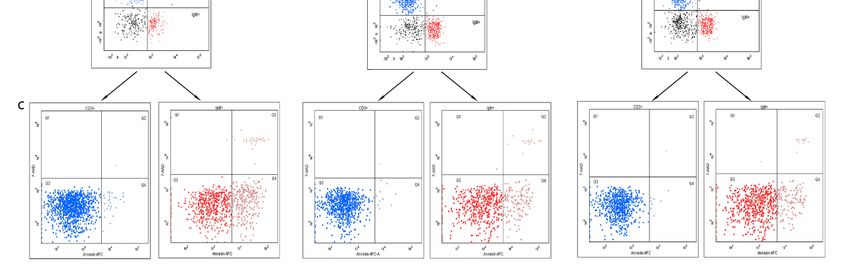
Pathogens 2020, 9, x FOR PEER REVIEW 3 of 14
and late apoptotic cells, located upper part/Q1 and Q2 (Annexin V-APC/ 7-AAD = -/+ and +/+). The
Pathogens 2020, 9, 632 3 of 12
samples were standardized to 1 x 10⁶ of mononuclear cells.
The
The average
average percentage
percentage of TCD3++ lymphocytes
of TCD3 lymphocyteswas wasthe
the highest
highest inin the
the spleen
spleen samples
samples isolated
isolated
from
from group
group SS pigeons (75.22 +/−
pigeons (75.22 +/− 8.92%).
8.92%).TheThevalues
valuesofofthis
this parameter
parameter differed
differed statistically
statistically (p
(p == 0.00)
0.00)
between birds from group I (59.05 +/− 9.20%) and group H (50.45 +/− 10.56%). In
between birds from group I (59.05 +/− 9.20%) and group H (50.45 +/− 10.56%). In turn, the average turn, the average
percentage
percentage of of splenic
splenicBBIgMIgM++ cells
cellswas
wasthethehighest
highestinin the
the control
control group
group (H)(H) pigeons,
pigeons, reaching
reaching 30.6830.68
+/−
+/− 8.82%,
8.82%, andand differed
differed statistically
statistically (p0.00)
(p = = 0.00) between
between groups
groups I (15.81+/−
I (15.81 +/−6.38%)
6.38%)and
andSS (6.55
(6.55 +/−
+/− 2.44%).
2.44%).
The
The percentage
percentage of this lymphocyte
of this lymphocyte subpopulation
subpopulation also
also differed
differedbetween
betweenpigeons
pigeonsfrom
fromgroups
groupsSSand andI
I(p(p==0.00)
0.00)(Figure
(Figure2).
2).
Figure 2.
Figure The results
2. The results of
of the
the flow
flow cytometry
cytometry analyses. The samples
analyses. The samples werewere standardized
standardized to 1×
to 1 1066 of
× 10 of
mononuclear cells.
mononuclear cells. The
Themean
mean percentage
percentage and
and the
the ratio
ratio ofof T
T CD3+
CD3+ to to B
B IgM+ splenic lymphocytes
IgM+ splenic lymphocytes
isolated from the examined pigeons. The different letters (A,B,C ) indicate a statistically significant
isolated from the examined pigeons. The different letters ( A,B,C) indicate a statistically significant
difference between
difference betweeninvestigated
investigatedgroups
groups(p(p < 0.01
< 0.01 andand < 0.05,
p < p0.05, respectively)
respectively) in theinKruskal–Wallis
the Kruskal–Wallis
non-
non-parametric test for independent samples. Error bars represent the standard error of the mean.
parametric test for independent samples. Error bars represent the standard error of the mean.
2.1.2. Apoptosis and Necrosis in Splenic T and B Lymphocytes
2.1.2. Apoptosis and Necrosis in Splenic T and B Lymphocytes
The percentage of apoptotic T CD3+ cells was the highest in group H pigeons (4.33 +/− 1.25%) and
differed (ppercentage
The of compared
apoptotic to
T CD3 + cells was the highest in group H pigeons (4.33 +/− 1.25%)
= 0.02) only the birds from group I (2.60 +/− 0.96%). There was no statistically
and differed
significant (p = 0.02)
difference only compared
in apoptotic TCD3+to the
cell birds from
percentage groupbirds
between I (2.60 +/-group
from 0.96%). There
S (3.00 +/−was no
1.56%)
statistically significant
and the other two groups. difference in apoptotic TCD3+ cell percentage between birds from group S
(3.00 The
+/− 1.56%) and the
percentage of other two groups.
apoptotic B IgM+ in group S pigeons reached 19.51 +/− 5.63% and was
statistically different (p = 0.00) from theIgM
The percentage of apoptotic B + in group S pigeons reached 19.51 +/− 5.63% and was
respective values noted in birds from group I (10.90 +/− 3.79%)
statistically different (p = 0.00)
and H (10.78 +/− 4.71%) (Figure 3A).from the respective values noted in birds from group I (10.90 +/− 3.79%)
and H (10.78 +/− 4.71%) (Figure 3A).
There were no statistically significant differences in the percentage of necrotic T CD3+ cells between
There were no statistically significant differences in the percentage of necrotic T CD3+ cells
all the investigated groups of pigeons. The average percentage of this splenocyte subpopulation was
between all the investigated groups of pigeons. The average percentage of this splenocyte
at 0.13 +/− 0.11%.
subpopulation was at 0.13 +/− 0.11%.
The highest percentage of necrotic B IgM+ cells was detected in group S pigeons and reached
The highest percentage of necrotic B IgM+ cells was detected in group S pigeons and reached
2.38 +/− 1.64%. It differed statistically (p = 0.00) from the values reported in groups I (1.14 +/− 0.58%)
2.38 +/− 1.64%. It differed statistically (p = 0.00) from the values reported in groups I (1.14 +/− 0.58%)
and H (0.70 +/− 0.35%), while there were no statistically significant differences between these two latter
and H (0.70 +/− 0.35%), while there were no statistically significant differences between these two
groups (Figure 3B).
latter groups (Figure 3B).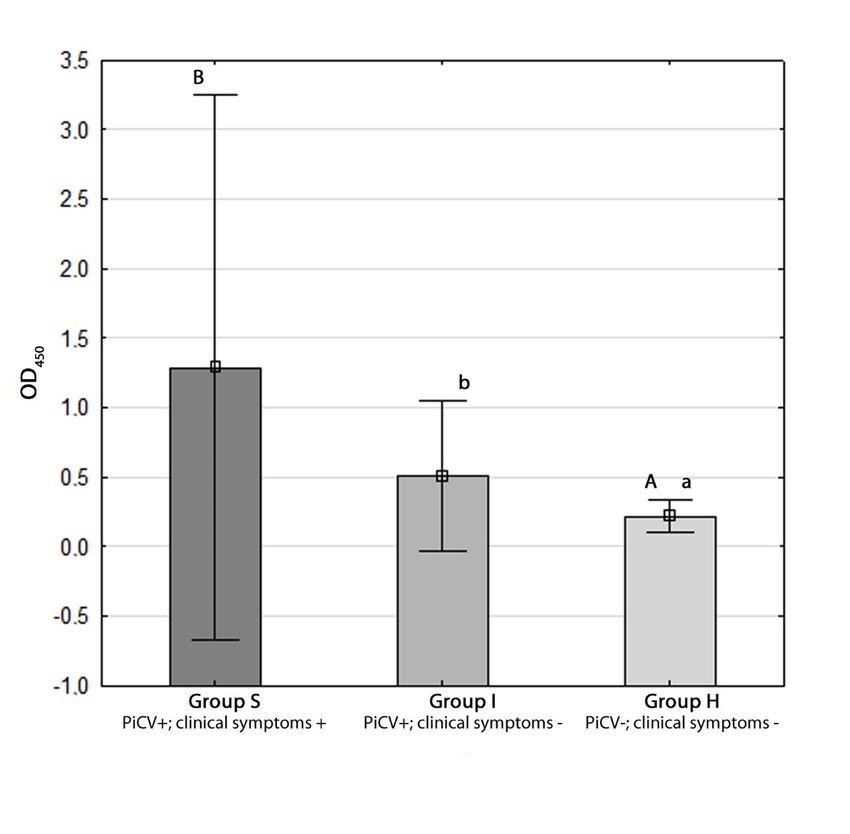
Pathogens 2020, 9, 632                                                                                                          4 of 12
      Pathogens 2020, 9, x FOR PEER REVIEW                                                                                4 of 14

      Figure 3. The results of the flow cytometry analyses. The samples were standardized to 1 × 10⁶ of
      mononuclear cells. (A) The mean percentage and the ratio of apoptotic (early apoptosis) 6T CD3+
            Figure 3. The results of the flow cytometry analyses. The samples were standardized to 1 × 10 of
      to B IgM   + splenic lymphocytes isolated from the examined pigeons. (B) The mean percentage and
            mononuclear    cells. (A) The mean percentage and the ratio of apoptotic (early apoptosis) T CD3+ to B
      the ratio                                                    + to B IgM+ splenic lymphocytes isolated from the
            IgM+ of  necrotic
                  splenic       and lateisolated
                          lymphocytes       apoptotic
                                                   from TtheCD3examined   pigeons. (B) The mean percentage and the ratio
      examined     pigeons.     Theapoptotic
                                      different   letters    A,B,C
                                                       + to( B IgMor    a,b ) indicate a statistically significant difference
            of necrotic and late               T CD3                 + splenic   lymphocytes isolated from the examined
      between    investigated
            pigeons.  The different       (p < 0.01
                                groupsletters          or p
                                                (A,B,Cand  a,b)< indicate
                                                                 0.05, respectively)   in the
                                                                           a statistically    Kruskal–Wallis
                                                                                           significant         non-parametric
                                                                                                       difference between
            investigated
      test for independentgroups   (p < 0.01Error
                               samples.      and pbars
                                                    < 0.05,  respectively)
                                                         represent           in the Kruskal–Wallis
                                                                       the standard    error of thenon-parametric
                                                                                                     mean.         test for
            independent samples. Error bars represent the standard error of the mean.
2.2. The Expression of CD4, CD8, and IFN-γ Genes
      2.2. The Expression of CD4, CD8, and IFN-γ Genes
     The mean relative expression of all analyzed genes in both infected groups was similar to that
found in theThe control
                  mean relative
                              groupexpression       of all analyzed
                                        (H). The highest            geneswas
                                                             expression   in both  infected
                                                                              detected    in groups
                                                                                              the casewas
                                                                                                        of similar
                                                                                                           the IFN-γ  to that
                                                                                                                          gene in
      found   in  the  control     group   (H).  The highest  expression was detected  in  the case of the
splenocytes isolated from group S pigeons (1.90 +/− 2.68). However, the difference was not statistically   IFN-γ     gene  in
      splenocytes isolated from group S pigeons (1.90 +/− 2.68). However, the difference was not
significant due to a high standard deviation. The expression of the CD8 gene was insignificantly higher
      statistically significant due to a high standard deviation. The expression of the CD8 gene was
in the splenocytes isolated from group I pigeons (1.34 +/− 0.45) than group S birds (0.94 +/− 0.26).
      insignificantly higher in the splenocytes isolated from group I pigeons (1.34 +/− 0.45) than group S
In turn,  the expression of CD4 gene was statistically higher (p = 0.00) in the lymphocytes isolated
      birds (0.94 +/− 0.26). In turn, the expression of CD4 gene was statistically higher (p = 0.00) in the
from lymphocytes
       the spleensisolated
                         of group    fromS pigeons    (1.23
                                            the spleens      +/− 0.24)
                                                         of group       than(1.23
                                                                  S pigeons  in those    isolated
                                                                                  +/− 0.24)  than infrom
                                                                                                     thosethe    group
                                                                                                            isolated       I birds
                                                                                                                        from
      +/−group
(0.86 the   0.24)  I(Figure
                     birds
             Pathogens          x 4).
                       2020, 9,(0.86
                                  FOR+/−  0.24)
                                       PEER     (Figure 4).
                                            REVIEW                                                              5 of 14

      Figure 4. Mean relative expression of the genes encoding CD4 and CD8 lymphocyte receptors and
      IFN-γ in splenic
                Figure 4.mononuclear       cells of of
                          Mean relative expression    the
                                                        theexamined    pigeons.
                                                             genes encoding  CD4 and The
                                                                                       CD8 mean    relative
                                                                                            lymphocyte        expression
                                                                                                          receptors and   values
                IFN-γ in splenic
      above 1 (horizontal        mononuclear
                              black  line) in cells   of theS examined
                                                 groups                pigeons. a
                                                               and I indicate    The  mean relative
                                                                                    higher            expression values
                                                                                              gene expression       compared to
                above 1 (horizontal black line) in groups S and I indicate a higher gene expression compared to the
      the control group (H). The different letters (A,B         ) indicate a statistically significant difference between
                control group (H). The different letters (A,B) indicate a statistically significant difference between
      investigated groups    (p < 0.01)  in  the  Mann–Whitney
                investigated groups (p < 0.01) in the Mann–Whitney U  Utest.
                                                                         test. Error
                                                                             Error barsbars   represent
                                                                                        represent          the standard
                                                                                                   the standard error of error of
      the mean. the mean.

             2.3. Determination of Anti-PiCV IgY
                  The OD450 value reached 1.28 +/− 0.97, 0.51 +/− 0.27 and 0.22 +/− 0.05 in groups S, I, and H,
             respectively. The statistical difference was detected only between group H and the other two groups
             at confidence levels of 99% and 95% (p = 0.00 and p = 0.02 for groups S and I, respectively) (Figure 5).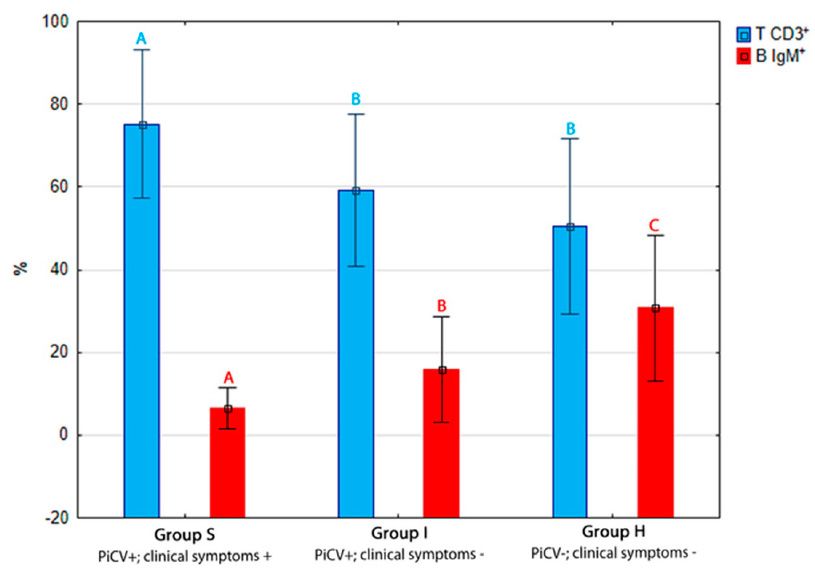
Pathogens 2020, 9, 632 5 of 12
2.3. Determination of Anti-PiCV IgY
The OD450 value reached 1.28 +/− 0.97, 0.51 +/− 0.27 and 0.22 +/− 0.05 in groups S, I, and H,
Pathogens 2020, 9, x FOR PEER REVIEW
respectively. The statistical difference was detected only between group H and the other two groups6 at
of 14
confidence levels of 99% and 95% (p = 0.00 and p = 0.02 for groups S and I, respectively) (Figure 5).
Figure 5. Detection of anti-pigeon circovirus (PiCV) IgY in sera of the examined pigeons using in-house
ELISA. The different letters (A,B or a,b ) indicate a statistically significant difference between investigated
groups in the Kruskal–Wallis non-parametric test for independent samples. Error bars represent the
standard error of the mean.
Figure 5. Detection of anti-pigeon circovirus (PiCV) IgY in sera of the examined pigeons using in-
house
2.4. PiCV ELISA.
Viral LoadsThe different
in the Bursa ofletters (A,B or
Fabricius
a,b) indicate a statistically significant difference between
Samples
investigated groups in the Kruskal–Wallis non-parametric test for independent samples. Error bars
The resultsthe
represent of standard
ddPCR for PiCV
error of theviral
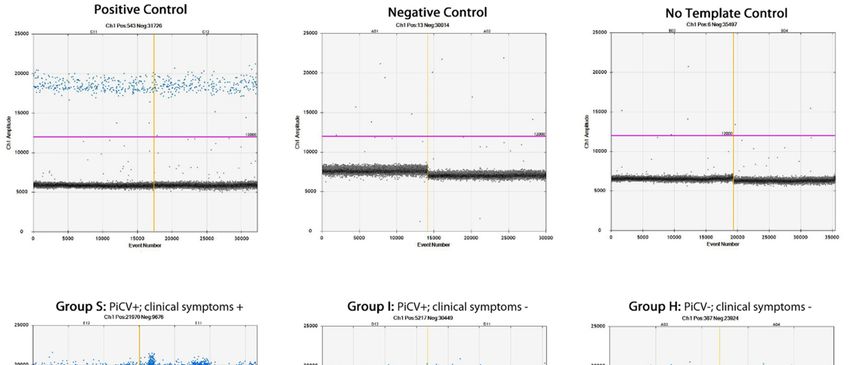
mean.loads are presented in Table 1 and Figure 6. The highest
number of PiCV viral loads was detected in the bursa of Fabricius samples of pigeons from group
2.4. PiCV Viral +/−
S (36,019,604.61 in the Bursa of/ Fabricius
Loads66,136,956.68 22 µL), and it was statistically different (p = 0.00) from PiCV
Samples
viral loads in the samples of pigeons from group I (38,236.72 +/− 63,281.49 / 22 µL). Surprisingly,
The results of ddPCR for PiCV viral loads are presented in Table 1 and Figure 6. The highest
the samples of pigeons from group H were also positive, with the lowest PiCV gene copy number
number of PiCV viral loads was detected in the bursa of Fabricius samples of pigeons from group S
(3488.94 +/− 3695.72 / 22 µL).
(36,019,604.61 +/− 66,136,956.68 / 22 µL), and it was statistically different (p = 0.00) from PiCV viral
loads in the samples
Table of pigeons
1. The PiCV genomefrom group Iin(38,236.72
copy number the bursa of+/− 63,281.49
Fabricius / 22 (ddPCR).
samples µL). Surprisingly, the
samples of pigeons from group H were also positive, with the lowest PiCV gene copy number
(3488.94 +/− 3695.72 / 22 µL). Group
PiCV Genome Copy Number/ 22 µL
S I H
Min. 239,794.61 1413.61 533.61
MN 36,019,604.61 A 38,236.72 B 3488.94 B
SD 66,136,956.68 63,281.49 3695.72
Max. 215,599,994.60 195,354.61 10,774.61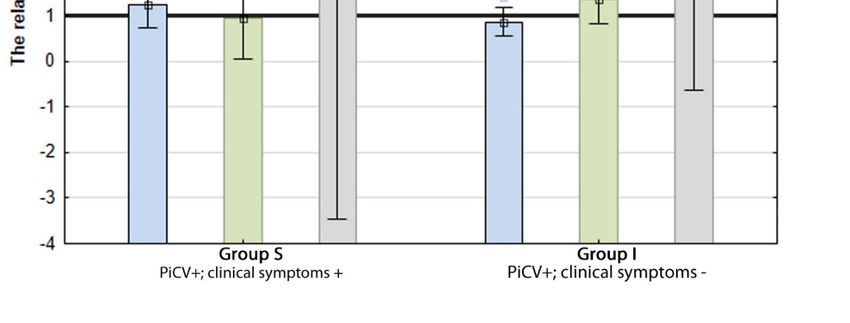
Pathogens 2020, 9, 632 6 of 12
Pathogens 2020, 9, x FOR PEER REVIEW 7 of 14
Figure Representative
6. 6.
Figure Representative figures
figuresofofdimensional
dimensionalplots
plotsofofthe
theddPCR
ddPCRassay
assayshowing
showing PiCV
PiCV viral
viral loads
loads in
theinselected samples.
the selected The value
samples. The of y axisof(Ch1
value amplitude)
y axis reflects toreflects
(Ch1 amplitude) amplitude of EvaGreen
to amplitude of fluorescence
EvaGreen
in afluorescence
detecting channel of a ddPCR
in a detecting channeldevice. The sample
of a ddPCR device.repetitions
The sampleare dividedare
repetitions by divided
vertical by
yellow lines.
vertical
The unbroken
yellow lines. pink line is the
The unbroken threshold,
pink line is theabove which
threshold, therewhich
above are positive
there aredroplets
positive (blue)
dropletswith PCR
(blue)
with PCR amplification
amplification and underneath andwhich
underneath which
there are theredroplets
negative are negative
(gray)droplets
without (gray) without any
any amplification.
amplification.
3. Discussion
Table 1. The PiCV genome copy number in the bursa of Fabricius samples (ddPCR).
Because good-quality racing pigeons are very valuable domestic animals, it is essential to discover
mechanismsPiCV of the pathology
Genome of the most
Copy Number/ 22 common pathogens occurring in those birds, which is
Group
fundamental for the development µL of proper preventive schedules. One of the most significant infectious
S I H
agents found in pigeons is the PiCVs. The circoviruses are well known immunosuppressive factors for
various animals. The pigeon Min. circovirus is characterized
239,794.61 by bursotropism,
1413.61 and the533.61
intracytoplasmic
MN 36,019,604.61 A 38,236.72
inclusion bodies are found mainly in bursal macrophages [13–15]. Histologic examination of
B 3488.94 B
SD 66,136,956.68 63,281.49 3695.72
the bF section positive for PiCV inclusion bodies revealed lymphocyte depletion and necrosis.
Max. 215,599,994.60 195,354.61 10,774.61
However, lymphocytic depletion and inclusion bodies were also found in another primary lymphatic
organ—thymus. This has underlain a theory that circoviruses could be important factors causing
3. Discussion
general immunosuppression in pigeons by affecting both T and B lymphocytes [14]. Additionally,
Because
one of the previousgood-quality racing
studies has pigeons
indicated are veryofvaluable
apoptosis domestic
bursal cells animals,
in pigeons it is for
positive essential
PiCV to[15];
however, pigeon thymus samples were not investigated with methods allowing the detection ofbirds,
discover mechanisms of the pathology of the most common pathogens occurring in those cellular
which
death. One is offundamental
the methodsfor the for
useful development
such analyses of is
proper preventiveItsschedules.
flow cytometry. application One of the because
is feasible most
significant infectious agents found in pigeons is the PiCVs. The circoviruses are well known
in the early stage of apoptosis, membrane-bound phosphatidylserine is transferred from the cytosol
immunosuppressive factors for various animals. The pigeon circovirus is characterized by
side to the outside of the cell. If fluorochrome-labelled Annexin V is added to the samples, it will create
bursotropism, and the intracytoplasmic inclusion bodies are found mainly in bursal macrophages
a complex with phosphatidylserine present outside the cells. In this way, the use of Annexin V staining
[13–15]. Histologic examination of the bF section positive for PiCV inclusion bodies revealed
allows distinguishing between viable, necrotic, and apoptotic cells. However, the flow cytometry has
lymphocyte depletion and necrosis. However, lymphocytic depletion and inclusion bodies were also
some limitations in staining for an apoptosis – the isolated mononuclear cells used for extracellular
found in another primary lymphatic organ—thymus. This has underlain a theory that circoviruses
staining
could behave to be alive.
important factorsFor this reason,
causing every method used in
general immunosuppression forpigeons
cell isolation should
by affecting bothnot leadB to
T and
cellular death. Unfortunately, bF as well as thymus contain high amounts of fibrous
lymphocytes [14]. Additionally, one of the previous studies has indicated apoptosis of bursal cells connective tissue,
in
and therefore, collagenase needs to be used during mononuclear cell isolation [21].
pigeons positive for PiCV [15]; however, pigeon thymus samples were not investigated with methods The treatment with
collagenase
allowing leads to cellular
the detection ofdeath, which
cellular is why
death. Oneneither
of the bF nor thymus
methods usefulwas forused foranalyses
such flow cytometry
is flow in
our study. One of our previous studies has revealed that the secondary immune organ—spleen—could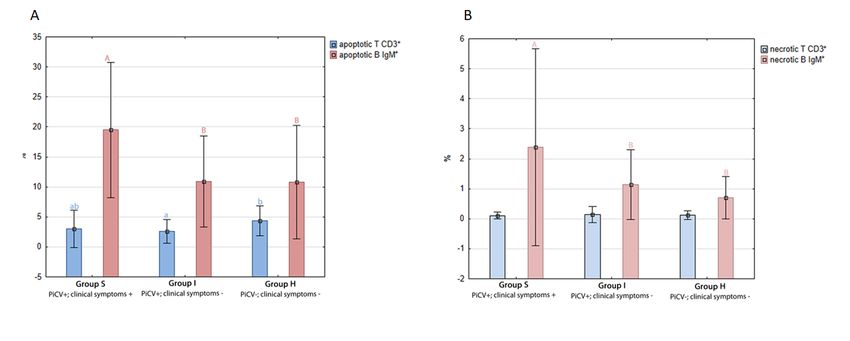
Pathogens 2020, 9, 632                                                                             7 of 12

be useful for flow cytometry, because the isolation of splenic mononuclear cells does not require
digestion with collagenase, and simple tissue homogenization with the use of a manual grinder is
enough. Moreover, high populations of both T and B cells are present in this organ [21,22], and for this
reason, we decided to use spleen samples for the isolation of mononuclear cells.
      The results of flow cytometry seem very interesting to us. We detected the significant differences
in percentages of both analyzed lymphocyte subpopulations, depending on the PiCV infection status.
There were two opposite trends. The percentage of TCD3+ lymphocytes increased depending on
the PiCV infection severity (PiCV viral loads) and was the highest in group S. In contrast, the B
IgM+ cells subpopulation was almost two times lower in the birds from group S than in these from
group H. The ratio of T CD3+ lymphocytes to B IgM+ varied from 1.6:1 in group H to 11:1 in group
S. Those differences suggest that PiCV infection could affect the B lymphocytes. The Annexin V
staining revealed that, despite a difference in group H, apoptosis was at a similar level in T CD3+ cells
subpopulation isolated from spleens of the examined pigeons. The lack of any trend in the group H
birds suggests that this difference could be random and result from the fact that the examined birds
originated from different clinical cases, not from experimental inoculation. Much clearer results were
present for B IgM+ cells. We noted that approximately 20% (two times more than in the subclinically
infected pigeons) of those cells were in the early apoptosis state. The mutual proportions between
apoptotic T CD3+ and B IgM+ lymphocytes ranged from 1:2 in group H to 1:6 in group S. Apoptosis is
a form of cellular death, which regulates cellular homeostasis by removing unnecessary or damaged
cells. The role of virus-induced apoptosis in the lymphocyte depletion and the progression of viral
disease has been reported for the best-known animal circovirus—porcine circovirus 2 (PCV-2) [23].
One of the most common biochemical signs of apoptosis is the irreversible fragmentation of genomic
DNA, resulting from the activation of nuclear endonucleases that cleave DNA between nucleosomal
units. These DNA fragments can be detected at the cellular level on tissue sections by the TUNEL assay,
which was performed by Abadie et al. (2001) [15] in pigeons infected with PiCV. The results of those
assays partially correspond to ours, because different patterns of lesions (based on apoptosis intensity)
were observed in pigeons regarding the PiCV infection status. The number of bF apoptotic cells in sick
and PiCV-infected birds was much higher than in the uninfected individuals. Besides, the atrophy
of bursal cells was detected. Similar observations were also made for other avian circoviruses like
goose circovirus and psittacine beak and feather disease virus [24,25]. Until now, the mechanism of
PiCV-induced apoptosis remains unknown. However, in the case of PCV-2, the ORF C3 protein is
responsible for lymphocyte depletion and further immunosuppression [26]. The apoptotic activity
of ORF 3 protein was also confirmed for duck circovirus [19]. The ORF C3 protein is present in the
pigeon circovirus genome [1]; however, its role is still unclear.
      The highest percentage of T CD3+ cells in pigeons clinically infected with PiCV suggests the
cellular immune response to viral infection. The CD3 receptor is present on all T cells, and, for this
reason, we decided to investigate the expression of genes encoding TCD4 and CD8 cellular receptors.
Our results showed that the expression of both genes in groups S and I was a slightly higher than
in group H. However, those differences were not so apparent like those detected in our previous
study [20]. In our opinion, it could be because in the previous study we compared the cellular immune
response in PiCV-positive and PiCV-negative pigeons in the context of an additional stimulating factor,
which was the immunization with PiCV recombinant capsid protein. However, there is no other
literature data to compare our findings. The IFN-γ gene plays a significant role in both immediate
and long-term immune responses to a viral infection; hence, its expression was also evaluated in this
study. The changes in IFN-γ gene expression were the highest amongst all genes analyzed in this
study; however, the result was blurred by massive variation between the samples, especially those
collected from pigeons classified as group S. The above could be due to using birds naturally infected
with PiCV, which originated from various clinical cases. Those birds were likely to be at different
stages of infection.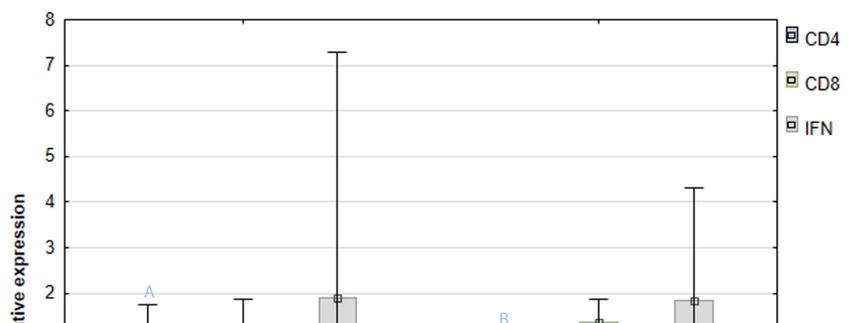
Pathogens 2020, 9, 632                                                                              8 of 12

      A surprising observation was made for anti-PiCV IgY. All of the examined birds were seropositive,
which corresponds with the results of our previous study, which revealed that PiCV seroprevalence was
ca. 70% regardless of pigeons’ infectious status [6]. The highest antibody levels as well as variability
between samples were observed in group S. In this group of pigeons, the values of standard deviation
were significantly higher than in the other groups. This phenomenon is typical of investigations
conducted with clinical field cases and, similarly like IFN-γ gene expression, suggests that the examined
pigeons could be at different stages of infection, which fully corresponds with findings from one of
our previous studies [6]. However, due to a lack of possibility of performing experimental infection
with PiCV under controlled conditions, experiments conducted with birds originated from clinical
cases are the only possible method. One doubt could arise because the B IgM+ lymphocyte percentage
was the lowest, whereas the IgY antibody level was the highest in pigeons from group S. It must be
remembered, however, that IgY antibodies appear later than IgM. Moreover, the half-life of antibodies
may be longer than the life of the lymphocyte. Therefore, with time since infection, the antibody level
increases, and the virus-infected cells gradually die.
      Until recently, PiCV was considered as one of the putative factors contributing to the complex
disease, called Young Pigeon Disease Syndrome, YPDS [27]. This theory was based on the fact that
each pigeon presenting symptoms of YPDS was PiCV positive. Moreover, semi-quantitative analyses
showed that the amount of PiCV genetic material in bF samples was much higher in the PiCV-positive
and diseased birds than in the healthy pigeons [28]. Those observations were partially confirmed
by using the qPCR method developed by Duchatel et al. (2009) [29], who revealed that PiCV viral
loads were significantly higher in liver samples collected from birds suffering from YPDS than in
the subclinically infected individuals. A similar trend was noted for bF and spleen samples, but the
differences were not significant, probably because of the small number of examined pigeons. In our
study, we decided to use ddPCR for PiCV viral loads quantification, because of its high sensitivity,
which allows detecting even single copies of the PiCV genome [20]. The results obtained indicate a
strong correlation between PiCV viral loads in bF and the pigeons’ clinical status, because the number
of PiCV genome copies was approximately a thousand times higher in the group S pigeons than in
the subclinically infected birds. These results correspond to those obtained by the authors mentioned
above. Very interesting is also that pigeons classified as group H (negative for PiCV in cloacal swabs
and showing no clinical symptoms of YPDS) proved to be positive in ddPCR. The average PiCV viral
load was the lowest in this group and was approximately ten times lower than in bF from pigeons
classified as subclinically infected. The above indicates that screening pigeons for PiCV based on
swab sample examination is not a perfect method and could lead to a false-negative result. However,
the swab samples are much better material for PiCV screening than blood samples, which was described
earlier [29]. The experimental infection with PiCV performed by Schimdt et al. (2008) [30] has revealed
that it is impossible to induce YPDS by pigeon inoculation with this virus and that the combined effect
of various factors, like stress factors and virus-induced immunosuppression, could occur. However,
since confirmation of rotavirus infection (RVA) in domestic pigeons in Australia, causing the disease
similar to YPDS [31], the role of PiCV in the etiology of the disease syndrome has been depreciated.
One of the most recent theories says that the characteristic clinical symptoms of the disease are directly
related to RVA infection [32,33].
      Given the current state of knowledge as well as facts found in this study, it should be noted that,
despite no evidence for the role of PiCV in the etiology of YPDS, infection with this virus cannot be
ruled out as an immunosuppression-inducing trigger. Our results indicate that the pigeon circovirus
induces B cell apoptosis, which may affect the impairment of humoral immunity. The above can
also explain the slower-developing post-vaccination immunity demonstrated in one of our earlier
studies [20].
      Given the current epizootic situation of PiCV, the intensity of circoviral infections in pigeons
showing clinical symptoms of YPDS and the emergence of RVA, it seems reasonable to conduct further
studies to determine the real/ potential role of these two viruses in the etiology of YPDS.
Pathogens 2020, 9, 632 9 of 12
4. Materials and Methods
4.1. Ethical Statement
The experiment was carried out in strict observance of the Local Ethics Committee on Animal
Experimentation of the University of Warmia and Mazury in Olsztyn (Authorization No. 41/2019).
The researchers made every effort to minimize the suffering of birds.
4.2. Pigeons
The experiment was conducted in three groups of pigeons. The first group included pigeons
naturally infected with PiCV showing non-specific symptoms of the disease (Sick group—S; n = 14);
the second one included pigeons that were positive for PiCV but clinically healthy (Infected group—I;
n = 35); and the third one included PiCV-negative pigeons showing no clinical symptoms (control
group—H; n = 7). All birds were purchased from private breeding facilities. The classification into each
group was based on the clinical status of birds and the presence of PiCV genetic material in cloacal
swabs. The pigeons showing no less than five of the following clinical symptoms were classified
as group S: apathy, decreased body weight, decreased food intake, watery droppings or greenish
diarrhea, crop filled with liquid or regurgitation from the crop, increased water intake, extensive
diphtheria lesions in beak cavity, respiratory disorders and ruffled feathers. The birds classified as
group I showed none of the above clinical symptoms but were positive in PCR screening for PiCV.
The pigeons were free of most common pigeon viruses such as avian orthoavulavirus 1, pigeon
adenovirus, pigeon herpesvirus, and pigeon rotavirus, which was confirmed by PCR. All investigated
birds were young (6–9 weeks old) racing/carrier pigeons. From each bird, blood samples were collected
to separate the serum for the detection of anti-PiCV antibodies. Afterward, the birds were euthanized
in the CO2 chamber, and organs of their immune system (spleen and bursa of Fabricius) were collected
for further analyses.
4.3. Isolation of Mononuclear Cells from the Spleen
Mononuclear cells from the whole spleens collected from each bird were isolated with the method
described previously [21]. Afterward, the absolute lymphocyte count (ALC) was determined in each
sample with a Vi-cell XR automatic cell viability analyzer (Beckman Coulter, Brea, CA, USA). Next,
each sample was divided into two parts: the first was used for flow cytometry examination, whereas
the second one for RNA extraction for expression of selected genes.
4.4. Flow Cytometry Analyses
4.4.1. Extracellular Staining for TCD3+ and B IgM+ Lymphocytes
The mononuclear cells isolated from spleen samples were standardized to 1 × 10⁶ . Next, they were
stained for T cells with anti-CD3 (PE) specific monoclonal antibodies obtained in our previous study [21]
and for B cells with anti-IgM (FITC) polyclonal antibodies (Biorad, Hercules, CA, USA). After staining,
the samples were incubated in darkness on ice for 30 min. Next, the cells were rinsed twice in PBS,
centrifuged, and the resulting pellets were resuspended and used for staining for apoptosis evaluation.
4.4.2. Staining for Apoptosis and Necrosis Evaluation
The staining was performed acc. to the protocol described by Maślanka et al. [34]. Cells stained for
CD3 and IgM extracellular markers were washed on ice in the Annexin V binding buffer (BD Biosciences,
Franklin Lakes, NJ, USA). The supernatants were removed by centrifugation, and the cells were
suspended in the same buffer. Next, the APC-conjugated Annexin V (BD Biosciences, Frnaklin Lakes, NJ,
USA) and 7-AAD (BD Biosciences, Frnaklin Lakes, NJ, USA) were added to the cells. After incubation,
the cells were diluted in the Annexin V binding buffer and analyzed with flow cytometry within 1 h
using a FACSCanto II flow cytometer (BD Biosciences, Franklin Lakes, NJ, USA). Data were acquiredPathogens 2020, 9, 632 10 of 12
in FACSDiva Software 6.1.3. (BD Biosciences, Franklin Lakes, NJ, USA). Cells were analyzed and
immunophenotyped in FloJo 10.6.2 (BD Biosciences, Franklin Lakes, NJ, USA). Data were expressed as
the mean percentage of a particular subpopulation of lymphocytes +/− standard deviation.
4.5. RNA Isolation and qPCR for Selected Genes Expression
The number of mononuclear cells isolated from spleen samples was standardized to 5 × 10⁶
and used for RNA isolation. Genomic RNA was isolated using a commercial reagent kit (RNeasy
Mini Kit; Qiagen, Hilden, Germany). Reverse transcription was conducted with the commercial kit
(High-Capacity cDNA Reverse Transcription Kit; Life Technologies, Carlsbad, CA, USA) according
to the manufacturer’s guidelines. The relative expression of the genes encoding CD4 and CD8 T cell
receptors and IFN-γ was determined as described previously [22], using a commercial reagent kit
(Power SYBR® Green PCR Master Mix kit; Life Technologies, Carslbad, CA, USA) and a LightCycler
96 (Roche, Basel, Switzerland). The relative expression was calculated using the 2−∆∆Cq method [35]
normalized to efficiency corrections, average RT and qPCR repeats, control group (H), and reference
gene coding glyceraldehyde 3-phosphate dehydrogenase (GAPDH) in GenEx v. 6.1.0.757 data analysis
software (MultiD Analyses, Göteborg, Sweden).
4.6. In-House ELISA for Determination of Anti-PiCV IgY
The assay was performed according to the protocol described in the previous study [6].
The concentration of detecting antigen was 20 µg/mL, and pigeon sera were diluted at 1:400.
The dilution rate of primary antibodies (rabbit anti-pigeon IgG; Antibodies-online, Atlanta, GA, USA)
was 1:30,000, whereas the dilution of secondary antibodies (goat anti-rabbit IgG with horseradish
peroxidase (HRP); BD biosciences, Franklin Lakes, NJ, USA) was 1:1000. Each rinsing step was
performed with an ELx 405 automatic washer (Biotek, Winooski, VT, USA). Optical density was
measured with an ELx 800 spectrophotometer (Biotek, Winooski, VT, USA) at the wavelength of 450 nm.
Data were expressed as mean OD450 +/− standard deviation.
4.7. Digital Droplet PCR (ddPCR) for PiCV Viral Loads in the Bursa of Fabricius Samples
The genomic DNA was extracted with the use of DNeasy Blood & Tissue Kit (Qiagen, Hilden,
Germany) in accordance with the manufacturer’s instructions. The volume of the tissue homogenate
used for DNA extraction was 200 µL. The homogenate was obtained by homogenization (TissueLyser II;
Qiagen, Hilden, Germany) of 400 µg of the bursa of Fabricius in 500 µL of the Phosphate Buffered Saline
(PBS, Sigma-Aldrich, Schnelldorf Germany). The ddPCR was carried out in a C1000 Touch thermal
cycler (Bio-Rad, USA) with the use of ddPCRTM EvaGreen Supermix (Bio-Rad, Hercules, CA, USA).
The primer sequences, the composition of the reaction mixture, and thermal cycler conditions were
described in our previous study [20]. After amplification, the plate containing the samples was placed
in a QX 200 droplet reader (Bio-Rad, Hercules, CA, USA) for analysis. The results were calculated with
the following formula: the mean number of positive droplets in the sample minus the mean number of
the positive droplets in the negative control (background). The results were expressed as mean PiCV
genome copy number +/− standard deviation per 22 µL of the sample.
4.8. Statistical Analysis
The statistical analysis of the values of parameters determined in the investigated groups was
conducted with the Kruskal–Wallis non-parametric test for independent samples (flow cytometry,
ddPCR, in-house ELISA) and Mann–Whitney U test (gene expression) using Statistica.pl v.10.0 software
(Statsoft, Kraków, Poland). Differences were considered significant at p < 0.05 and p < 0.01.
Author Contributions: Conceptualization, T.S.; methodology, T.S., D.D., and B.T.; investigation, T.S.; data curation,
T.S. and B.T.; Writing—Original draft preparation, T.S.; Writing—Review and editing, D.D. and A.K.; supervision,
T.S.; project administration, T.S.; funding acquisition, T.S. All authors have read and agreed to the published
version of the manuscript.Pathogens 2020, 9, 632 11 of 12
Funding: Project financially co-supported by Minister of Science and Higher Education in the range of the program
entitled “Regional Initiative of Excellence” for the years 2019–2022, Project No. 010/RID/2018/19, amount of
funding 12,000,000 PLN.
Conflicts of Interest: The authors declare no conflict of interest. The funders had no role in the design of the
study; in the collection, analyses, or interpretation of data; in the writing of the manuscript; or in the decision to
publish the results.
References
1. Mankertz, A.; Hattermann, K.; Ehlers, B.; Soike, D. Cloning and sequencing of columbid circovirus (CoCV),
a new circovirus from pigeons. Arch. Virol. 2000, 145, 2469–2479. [CrossRef]
2. Woods, L.W.; Latimer, K.S.; Barr, B.C.; Niagro, F.D.; Campagnoli, R.P.; Nordhausen, R.W.; Castro, A.E.
Circovirus-like infection in a pigeon. J. Vet. Diagn Invest. 1993, 5, 609–612. [CrossRef] [PubMed]
3. Paré, J.A.; Brash, M.L.; Hunter, D.B.; Hampson, R.J. Observations on pigeon circovirus infection in Ontario.
Can. Vet. J. 1999, 40, 659–662. [PubMed]
4. Stenzel, T.; Koncicki, A. The epidemiology, molecular characterization and clinical pathology of circovirus
infections in pigeons—Current knowledge. Vet. Q. 2017, 37, 166–174. [CrossRef] [PubMed]
5. Stenzel, T.; Piasecki, T.; Chrzastek,
˛ K.; Julian, L.; Muhire, B.M.; Golden, M.; Martin, D.P.; Varsani, A. Pigeon
circoviruses display patterns of recombination, genomic secondary structure and selection similar to those of
beak and feather disease viruses. J. Gen. Virol. 2014, 95, 1338–1351. [CrossRef] [PubMed]
6. Stenzel, T.; Woźniakowski, G.; Pestka, D.; Choszcz, D.; Tykałowski, B.; Śmiałek, M.; Koncicki, A. Application of
pigeon circovirus recombinant capsid protein for detecting anti-PiCV antibodies in the sera of asymptomatic
domestic pigeons and the potential use of a combination of serological and molecular tests for controlling
circovirus infections in pigeon breeding flocks. Poult. Sci. 2017, 96, 303–308. [PubMed]
7. Zhang, Z.; Lu, C.; Wang, Y.; Wang, S.; Dai, D.; Chen, Z.; Fan, H. Molecular characterization and epidemiological
investigation of Pigeon circovirus isolated in eastern China. J. Vet. Diagn Invest. 2011, 23, 665–672. [CrossRef]
8. Franciosini, M.P.; Fringuelli, E.; Tarhuni, O.; Guelfi, G.; Todd, D.; Casagrande Proietti, P.; Falocci, N.;
Asdrubali, G. Development of polymerase chain reaction-based in vivo method in the diagnosis of subclinical
pigeon circovirus infection. Avian Dis. 2005, 49, 340–343. [CrossRef]
9. Julian, L.; Piasecki, T.; Chrzastek,
˛ K.; Walters, M.; Muhire, B.; Harkins, G.W.; Martin, D.P.; Varsani, A.
Extensive recombination detected among beak and feather disease virus isolates from breeding facilities in
Poland. J. Gen. Virol. 2013, 94, 1086–1095. [CrossRef]
10. Loiko, M.R.; Junqueira, D.M.; Varela, A.P.M.; Tochetto, C.; Scheffer, C.M.; Lima, D.A.; Morel, A.P.; Cerva, C.;
Paim, W.P.; Quoos Mayer, F.; et al. Columbid circoviruses detected in free ranging pigeons from Southern
Brazil: Insights on PiCV evolution. Arch. Virol. 2018, 163, 3083–3090. [CrossRef]
11. Sarker, S.; Das, S.; Ghorashi, S.A.; Forwood, J.K.; Raidal, S.R. Pigeon circoviruses from feral pigeons in
Australia demonstrate extensive recombination and genetic admixture with other circoviruses. Avian Pathol.
2019, 48, 512–520. [CrossRef] [PubMed]
12. Dolka, B.; Dolka, I.; Ledwoń, A.; Sapierzyński, R.; Koralewski, A.; Szeleszczuk, P. Investigations into feather
abnormalities in racing pigeons. Med. Water 2016, 72, 693–698. [CrossRef]
13. Huang, Y.L.; Castaneda, O.A.; Thongchan, D.; Khatri-Chhetri, R.; Tsai, S.S.; Wu, H.Y. Pigeon circovirus
infection in disqualified racing pigeons from Taiwan. Avian Pathol. 2017, 46, 359–366. [CrossRef] [PubMed]
14. Coletti, M.; Franciosini, M.P.; Asdrubali, G.; Passamonti, F. Atrophy of the primary lymphoid organs of meat
pigeons in Italy associated with circoviruslike particles in the bursa of Fabricius. Avian Dis. 2000, 44, 454–459.
[CrossRef]
15. Abadie, J.; Nguyen, F.; Groizeleau, C.; Amenna, N.; Fernandez, B.; Guereaud, C.; Guigand, L.; Robart, P.;
Lefebvre, B.; Wyers, M. Pigeon circovirus infection: Pathological observations and suggested pathogenesis.
Avian Pathol. 2001, 30, 149–158. [CrossRef]
16. Stenzel, T.; Pestka, D.; Tykałowski, B.; Śmiałek, M.; Koncicki, A. Epidemiological investigation of selected
pigeon viral infections in Poland. Vet. Rec. 2012, 171, 562. [CrossRef]
17. Stenzel, T.; Pestka, D.; Choszcz, D. The prevalence and genetic characterization of Chlamydia psittaci from
domestic and feral pigeons in Poland and the correlation between infection rate and incidence of pigeon
circovirus. Poult. Sci. 2014, 93, 3009–3016. [CrossRef]Pathogens 2020, 9, 632 12 of 12
18. Lv, Y.; Dai, L.; Han, H.; Zhang, S. PCV2 induces apoptosis and modulates calcium homeostasis in piglet
lymphocytes in vitro. Res. Vet. Sci. 2012, 93, 1525–1530. [CrossRef]
19. Xiang, Q.W.; Wang, X.; Xie, Z.J.; Sun, Y.N.; Zhu, Y.L.; Wang, S.J.; Liu, H.J.; Jiang, S.J. ORF3 of duck circovirus:
A novel protein with apoptotic activity. Vet. Microbiol. 2012, 159, 251–256. [CrossRef]
20. Stenzel, T.; Dziewulska, D.; Śmialek, M.; Tykałowski, B.; Kowalczyk, J.; Koncicki, A. Comparison of the
immune response to vaccination with pigeon circovirus recombinant capsid protein (PiCV rCP) in pigeons
uninfected and subclinically infected with PiCV. PLoS ONE 2019, 14, e0219175. [CrossRef]
21. Stenzel, T.; Dziewulska, D.; Tykałowski, B.; Śmiałek, M.; Kowalczyk, J.; Koncicki, A. Immunogenicity of
Pigeon Circovirus Recombinant Capsid Protein in Pigeons. Viruses 2018, 10, 596. [CrossRef] [PubMed]
22. Dziewulska, D.; Stenzel, T.; Śmiałek, M.; Tykałowski, B.; Koncicki, A. The impact of Aloe vera and licorice
extracts on selected mechanisms of humoral and cell-mediated immunity in pigeons experimentally infected
with PPMV-1. BMC Vet. Res. 2018, 14, 148. [CrossRef] [PubMed]
23. Pan, Y.; Li, P.; Jia, R.; Wang, M.; Yin, Z.; Cheng, A. Regulation of Apoptosis during Porcine Circovirus Type 2
Infection. Front. Microbiol. 2018, 9, 2086. [CrossRef] [PubMed]
24. Guo, J.; Tian, J.; Tan, X.; Yu, H.; Ding, S.; Sun, H.; Yu, X. Pathological observations of an experimental infection
of geese with goose circovirus. Avian Pathol. 2011, 40, 55–61. [CrossRef]
25. Robino, P.; Grego, E.; Rossi, G.; Bert, E.; Tramuta, C.; Stella, M.C.; Bertoni, P.; Nebbia, P. Molecular analysis
and associated pathology of beak and feather disease virus isolated in Italy from young Congo African grey
parrots (Psittacus erithacus) with an “atypical peracute form” of the disease. Avian Pathol. 2014, 43, 333–344.
[CrossRef]
26. Liu, J.; Chen, I.; Kwang, J. Characterization of a previously unidentified viral protein in porcine circovirus
type 2-infected cells and its role in virus-induced apoptosis. J. Virol. 2005, 79, 8262–8274. [CrossRef]
[PubMed]
27. Raue, R.; Schmidt, V.; Freick, M.; Reinhardt, B.; Johne, R.; Kamphausen, L.; Kaleta, E.F.; Müller, H.;
Krautwald-Junghanns, M.E. A disease complex associated with pigeon circovirus infection, young pigeon
disease syndrome. Avian Pathol. 2005, 34, 418–425. [CrossRef]
28. Todd, D.; Duchatel, J.P.; Weston, H.; Ball, N.W.; Borghmans, B.J.; Moffett, D.A.; Smyth, J.A. Evaluation of
polymerase chain reaction and dot blot hybridisation tests in the diagnosis of pigeon circovirus infections.
Vet. Microbiol. 2002, 89, 1–16. [CrossRef]
29. Duchatel, J.P.; Todd, D.; Willeman, C.; Losson, B. Quantification of pigeon circovirus in serum, blood, semen
and different tissues of naturally infected pigeons using a real-time polymerase chain reaction. Avian Pathol.
2009, 38, 143–148. [CrossRef]
30. Schmidt, V.; Schlömer, J.; Lüken, C.; Johne, R.; Biere, B.; Müller, H.; Krautwald-Junghanns, M.E. Experimental
infection of domestic pigeons with pigeon circovirus. Avian Dis. 2008, 52, 380–386. [CrossRef]
31. McCowan, C.; Crameri, S.; Kocak, A.; Shan, S.; Fegan, M.; Forshaw, D.; Rubbenstroth, D.; Chen, H.;
Holmes, C.; Harper, J.; et al. A novel group A rotavirus associated with acute illness and hepatic necrosis in
pigeons (Columba livia), in Australia. PLoS ONE 2018, 13, e0203853. [CrossRef] [PubMed]
32. Rubbenstroth, D.; Peus, E.; Schramm, E.; Kottmann, D.; Bartels, H.; McCowan, C.; Schulze, C.; Akimkin, V.;
Fischer, N.; Wylezich, C.; et al. Identification of a novel clade of group A rotaviruses in fatally diseased
domestic pigeons in Europe. Transbound. Emerg. Dis. 2019, 66, 552–561. [CrossRef] [PubMed]
33. Rubbenstroth, D.; Ulrich, R.; Wylezich, C.; Rautenschlein, S.; Beer, M.; Mohr, L. First experimental proof of
Rotavirus A (RVA) genotype G18P [17] inducing the clinical presentation of ‘young pigeon disease syndrome’
(YPDS) in domestic pigeons (Columba livia). Transbound. Emerg. Dis. 2020, 67, 1507–1516. [CrossRef]
[PubMed]
34. Maślanka, T.; Jaroszewski, J.J.; Markiewicz, W.; Jasiecka, A.; Ziółkowski, H.; J˛edrzkiewicz, D. Effects of
dexamethasone and meloxicam on bovine CD25+ CD8+ and CD25- CD8+ T cells-in vitro study. Res. Vet. Sci.
2013, 94, 662–674. [CrossRef] [PubMed]
35. Livak, K.J.; Schmittgen, T.D. Analysis of relative gene expression data using real-time quantitative PCR and
the 2 (-Delta Delta C(T)) method. Methods 2001, 25, 402–408. [CrossRef]
© 2020 by the authors. Licensee MDPI, Basel, Switzerland. This article is an open access
article distributed under the terms and conditions of the Creative Commons Attribution
(CC BY) license (http://creativecommons.org/licenses/by/4.0/).You can also read