Heat Waves Occurrence and Outdoor Workers' Self-assessment of Heat Stress in Slovenia and Greece - MDPI
←
→
Page content transcription
If your browser does not render page correctly, please read the page content below
International Journal of
           Environmental Research
           and Public Health

Article
Heat Waves Occurrence and Outdoor Workers’
Self-assessment of Heat Stress in Slovenia and Greece
Tjaša Pogačar 1, *, Zala Žnidaršič 2 , Lučka Kajfež Bogataj 1 , Andreas D. Flouris 3,4 ,
Konstantina Poulianiti 3 and Zalika Črepinšek 1
 1    Centre of Agrometeorology, Department of Agronomy, Biotechnical Faculty, University of Ljubljana,
      Jamnikarjeva 101, 1000 Ljubljana, Slovenia; lucka.kajfez.bogataj@bf.uni-lj.si (L.K.B.);
      zalika.crepinsek@bf.uni-lj.si (Z.Č.)
 2    Faculty of Mathematics and Physics, University of Ljubljana, Jadranska 19, 1000 Ljubljana, Slovenia;
      zala.znidarsic@gmail.com
 3    FAME Laboratory, Department of Exercise Science, University of Thessaly, Karies, 42100 Trikala, Greece;
      andreasflouris@gmail.com (A.D.F.); poulianitikon@gmail.com (K.P.)
 4    Human and Environmental Physiological Research Unit, Faculty of Health Sciences, University of Ottawa,
      Ottawa, ON K1N 6N5, Canada
 *    Correspondence: tjasa.pogacar@bf.uni-lj.si; Tel.: +386-1-320-3133

 Received: 30 January 2019; Accepted: 16 February 2019; Published: 19 February 2019

 Abstract: Changing patterns of heat waves are part of the global warming effect and the importance
 of changes is reinforced by their negative impact on society. Firstly, heat waves were analyzed
 in Brnik (Slovenia) and Larisa (Greece) in the period 1981–2017 to reflect the environment which
 workers are exposed to. Secondly, outdoor workers (70 from Greece, 216 from Slovenia) provided a
 self-assessment of heat stress. The heat wave timeline is presented as an effective way of illustrating
 long-term changes in heat waves’ characteristics for various stakeholders. In both countries, workers
 assessed as significant the heat stress impact on productivity (Greece 69%, Slovenia 71%; p > 0.05),
 and in Slovenia also on well-being (74%; p < 0.01). The main experienced symptoms and diseases
 were thirst (Greece 70%, Slovenia 82%; p = 0.03), excessive sweating (67%, 85%; p = 0.01), exhaustion
 (51%, 62%; p > 0.05) and headache (44%, 53%; p > 0.05). The most common way to reduce heat stress
 was drinking more water (Greece 64%, Slovenia 82%; p = 0.001). Among the informed workers, the
 prevalent source of information was discussions. Therefore, educational campaigns are recommended,
 together with the testing of the efficiency of mitigation measures that will be proposed on the
 Heat-Shield project portal.

 Keywords: heat wave; outdoor workers; occupational health; heat stress; climate change; productivity

1. Introduction
     Heat waves are typically known as prolonged periods of excessive heat or “summertime episodes
with extremely high surface air temperatures and lasting for several days or longer” [1]. Several studies
have assessed that heat waves are becoming more intense, more frequent, and lasting longer [2–5];
and across the globe, they have been linked with substantial increase in morbidity and mortality [6].
     The Intergovernmental Panel on Climate Change [7] classified heat waves as one of the most
extreme weather events associated with climate change. Studies of heat waves’ climatology provide
important background for the research of several heat wave consequences, such as increasing heat stress
among the general and working population, because their knowledge, behavior, and acclimatization,
in general, reflect the environment they have been living in. Thus, analyses of the long-term occurrence
of heat waves at specific locations, including changes due to climate change, help better understand
the variability in the assessment of heat stress, the perceived symptoms, and workers’ knowledge.

Int. J. Environ. Res. Public Health 2019, 16, 597; doi:10.3390/ijerph16040597    www.mdpi.com/journal/ijerph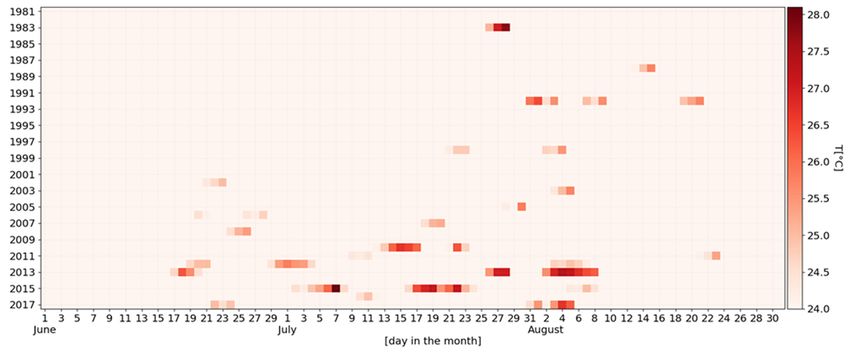
Int. J. Environ. Res. Public Health 2019, 16, 597                                                    2 of 12

     The number of vulnerable people exposed to heat waves around the world increased by about
125 million between 2000 and 2015. In the same period, the productivity of the outdoor working
population decreased by 5.3% worldwide [8]. Hot working environments are considered to be an
occupational health problem affecting the body’s major organs, including heart, kidneys, and brain [9].
However, even before the manifestation of clinical symptoms, heat exhaustion has a negative impact on
workers’ ability to carry out physical and mental work [10], especially continuous work on an hourly
basis. Consequently, apart from the detrimental effects of heat waves on human health, reduced labor
productivity and economic loss are also among the serious outcomes. When productivity becomes
affected, company management may show a particularly high incentive to address the heat issue [11],
but the development and evaluation of preventive measures depend also on the quality of heat stress
assessments [12].
     The successful design and implementation of a prevention plan require an effective and complete
heat warning system based on critical thresholds [13]. According to a comprehensive assessment of
the development of heat preparedness planning among the 53 WHO European Region member states,
using a unique methodology based on criteria developed and pre-tested by the WHO, only 18 countries
have developed heat-health action plans [3]. However, while there are some improvements and actions
in the eyes of the general public, during the last decade, only 7 out of 12 European countries that had
prepared heat wave early warning systems described outdoor workers as a risk group [14]. The recent
systematic review and meta-analysis by Flouris et al. [15] showed that occupational heat stress has
serious health and productivity outcomes and should be recognized as a public health problem.
Europe cannot afford to overlook workers, who are vulnerable especially in economic sectors like
agriculture [16–18], construction [19], and the manufacturing industry [20].
     In this light, the purpose of the study was, first, to analyze the climatological background of heat
waves and outdoor working conditions in two climate-heterogeneous European countries, Slovenia and
Greece. Additionally, we obtained Slovenian and Greek outdoor workers’ self-assessments of their heat
stress symptoms, heat-induced diseases, and their own capacity to reduce their exposure to heat stress.
Our aim was to compare both countries to identify the main differences and similarities between them
with respect to the occurrence of heat waves, their impacts, and workers’ perceptions of heat stress.

2. Materials and Methods

2.1. Heat Wave Climatology
     The impact and the perception of a heat wave vary considerably from region to region.
For example, multi-day air temperatures above 30 ◦ C in summer in Central or even North Europe
would be expected to create more problems than similar temperatures in South Europe [21].
For this reason, heat waves should be defined based on a high percentile base and not on absolute
air temperature thresholds, since the latter method does not ensure that local climatology and
acclimatization have been assessed. In our case, two European countries, Slovenia and Greece,
with distinct differences in climate and weather conditions, were included in the study. To perform
a detailed analysis of the heat wave events in the two countries, we examined data from two
meteorological stations, Brnik (Airport Ljubljana, Slovenia; 46◦ 130 4” N, 14◦ 280 39” E, 364 m a.s.l.)
and Larisa (Greece; 39◦ 380 19” N, 22◦ 240 32” E, 85 m a.s.l.). For Slovenia, the weather data were obtained
from the Slovenian Environment Agency’s archive, and for Greece from the ECA&D dataset [22].
     Lacking a universal definition of heat waves, national meteorological offices have adopted their
own definitions in order to be able to issue heat alarms. In Slovenia, a new definition of a heat wave was
developed by the Slovenian Meteorological Society, the Slovenian Environment Agency, the National
Health Institute, and the Biotechnical Faculty, based on the daily mean air temperature (Tmean): In the
continental part of Slovenia, a heat wave occurs when Tmean is equal to or exceeds 24 ◦ C for at least
three days [23]. The threshold approximately coincides with the 97th percentile of Tmean in the period
Int. J. Environ. Res. Public Health 2019, 16, 597 3 of 12
1986–2015 and with the 96th percentile of Tmean in the period 2006–2015; thus, the same percentile
was used to set the threshold of 28.5 ◦ C for Larisa (Greece).
Since the scientific definitions and the graphical presentations of heat waves are often too
complicated for the general public and workers to understand, an effective way of illustrating all
the main characteristics (quantity, intensity, duration, date of occurrence) of heat waves is proposed.
In addition, a comparison of annual temperature sums (Tsum) has been performed. Tsum is the
cumulative Tmean excess above the threshold during all heat waves in one year. According to
Kysely [24], temperature sum is probably the most appropriate parameter to determine the severity of
a heat wave.
2.2. Workers’ Perception of Heat Stress
In the context of the HEAT-SHIELD project [25], a cross-sectional study has been carried out in
both countries, as mentioned above. A slightly modified questionnaire, previously utilized in the
HOTHAPS (The High Occupational Temperature, Health, and Productivity Suppression) Program [26],
was used, aiming specifically at workers’ perception of heat stress. The survey was conducted in
Slovenia in 2017, and in Greece in 2018. A sample of more than 800 workers from various industrial
sectors (mainly agriculture, tourism, and construction) was asked to participate in the study, providing
verbal consent and answering in their own language. This analysis considered all those who spent
more than one-third of their daily working time outdoors (286), 216 from Slovenia and 70 from
Greece. The questionnaire included questions on the demographics, the workers’ knowledge of the
companies’ heat plans, perceived symptoms of heat stress or heat-induced illnesses and possible
protective measures. Respondents were provided with possible answers.
Results were compared between the two countries using Pearson Chi-square tests and
Independent Samples t-tests. A p-value (p) lower than 0.05 was considered to be statistically significant.
Data were analyzed using the software SPSS for Windows.
3. Results
3.1. Comparison of Heat Waves in Slovenia and Greece
As mentioned above, the percentile-based thresholds for the occurrence of a heat wave were 24 ◦ C
for the central part of Slovenia and 28.5 ◦ C for Larisa, Greece. Despite the fact that the threshold was
much higher in Greece, a greater number of heat waves was observed throughout the examined period
(Figure 1). During the heat waves, the average daily air temperature reached a maximum of 28 ◦ C
(4 ◦ C above the threshold) in Slovenia and 35 ◦ C (6.5 ◦ C above the threshold) in Greece. The number,
duration and distribution of heat waves throughout the summer season have been more similar in the
two countries in the recent years than previously.
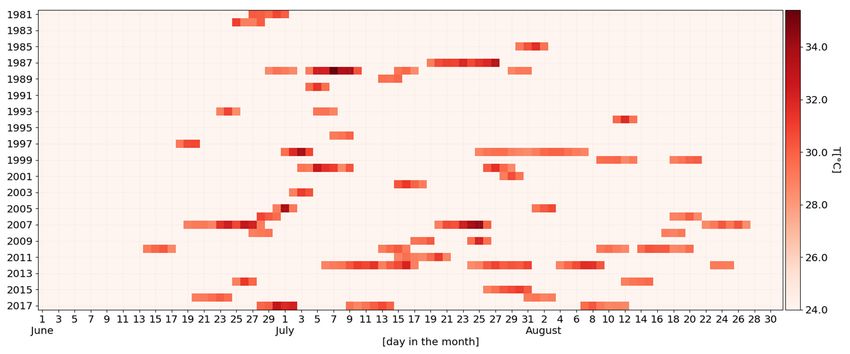
From 1981 to 2000, heat waves were common in the summer months in Larisa, while in Brnik they
were restricted to few extreme days in July and August. In most of the examined period, the duration
of heat waves was much longer in Larisa than in Brnik (Figure 2). Moreover, the longest duration of
heat waves was observed in the month of July in both countries. If the annual heat waves’ temperature
sum (Figure 3) in Brnik was very low (almost zero) for a long period of time (1981–2009), it has
dramatically increased in recent years (2010, 2013, 2015, and 2017). On the other hand, in the city of
Larisa, much higher temperature sums were sporadically distributed throughout the period 1981–2017.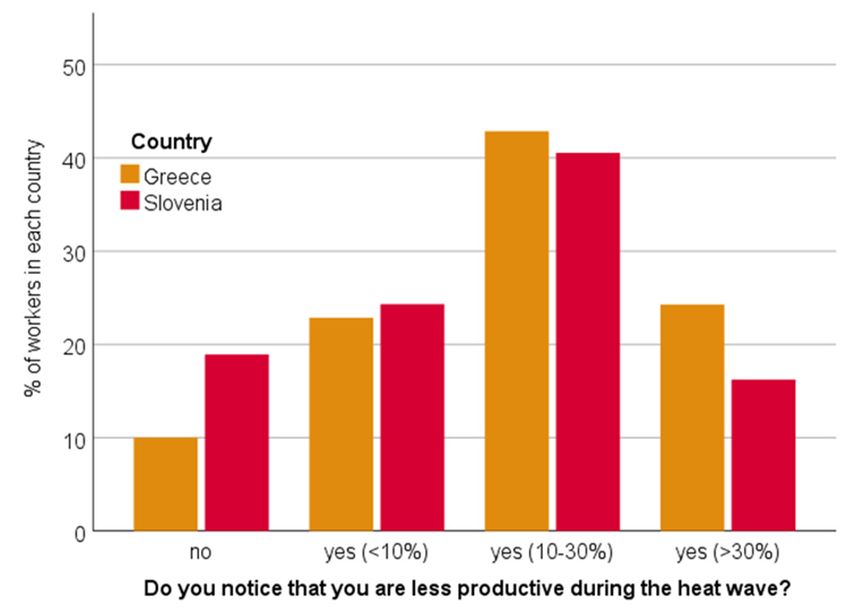
Int. J. Environ. Res. Public Health 2019, 16, 597                                                                               4 of 12
     Int. J. Environ. Res. Public Health 2019, 16, x                                                                  4 of 13

      Figure     1. A1.daily
             Figure            overview
                          A daily          of heat
                                     overview        waves
                                                  of heat   and their
                                                          waves        intensity
                                                                  and their       in the
                                                                             intensity inperiod 1981–2017
                                                                                          the period       in Brnik
                                                                                                     1981–2017      (Slovenia;
                                                                                                                in Brnik
      top) (Slovenia;
              and Larisa  top)(Greece;    bottom)
                                 and Larisa          from
                                              (Greece;     1 June
                                                       bottom)      to131
                                                                 from      August.
                                                                        June          Only days
                                                                              to 31 August.       in heat
                                                                                            Only days     waves
                                                                                                       in heat    areare
                                                                                                               waves  colored,
    Int. J. Environ.
             colored,Res. Public
                       darker    Health
                                 red    2019, 16,
                                     designating  x higher daily
      darker red designating higher daily mean air temperatures.  mean air temperatures.                             5 of 13

              2. The
          Figure
      Figure          annual
                  2. The      number
                         annual number(divided
                                         (divided monthly
                                                  monthly byby colors)
                                                               colors)ofofdays
                                                                           daysininheat
                                                                                    heat waves
                                                                                        waves in in
                                                                                                 thethe period
                                                                                                     period    1981–2017
                                                                                                            1981–
          2017 in
      in Brnik    Brnik (Slovenia;
                (Slovenia;         top)Larisa
                            top) and    and Larisa (Greece;
                                              (Greece;      bottom).
                                                        bottom).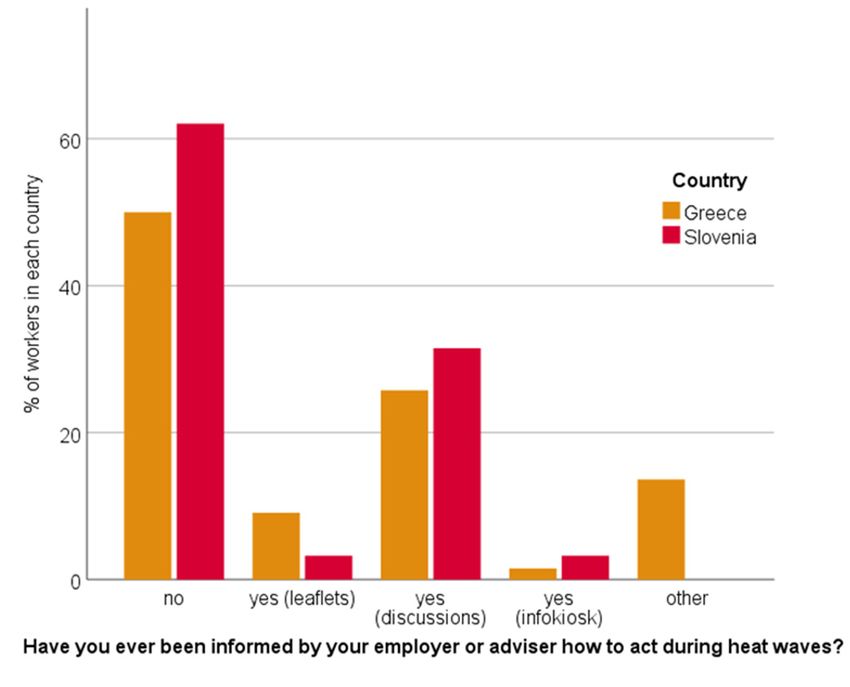
Figure
 Int. J.       2. Res.
         Environ. ThePublic
                       annual number
                            Health       (divided
                                   2019, 16, 597  monthly by colors) of days in heat waves in the period 1981– 5 of 12
     2017 in Brnik (Slovenia; top) and Larisa (Greece; bottom).

       Figure 3. The heat waves’ temperature sums (above the threshold) for the period 1981–2017 in Brnik
     Figure 3. The heat waves’ temperature sums (above the threshold) for the period 1981–2017 in Brnik
       (Slovenia) and Larisa (Greece).
     (Slovenia) and Larisa (Greece).
  3.2. Worker’s Self-Assessment of Heat Stress Impacts
3.2. Worker’s Self-Assessment of Heat Stress Impacts
        A total of 286 workers were assessed, 70 from Greece and 216 from Slovenia. In both countries,
      A  total of
  the highest      286 workers
                 percentage       were assessed,
                              of workers            70 from
                                           participating    inGreece   andwere
                                                               the study    216 from
                                                                                male,Slovenia.   In share
                                                                                       the highest  both countries,
                                                                                                          of workers
the  highest  percentage    of workers   participating    in the study  were   male, the  highest
  were in the age group of 31 to 40 years, and the education level of workers in both countries   share  of workers
                                                                                                                  was
were   in the
  similar.  Asage    group
                 it has  beenofmentioned
                                31 to 40 years,
                                            in theand   the education
                                                    methodology,     onlylevel of workers
                                                                            workers         in bothatcountries
                                                                                      who spend                  was
                                                                                                      least one-third
similar.
  of theirAsworking
              it has been   mentioned
                         hours  outdoorsin were
                                            the methodology,
                                                   analyzed. Inonly bothworkers   whoapproximately
                                                                           countries,   spend at least one-third   of
                                                                                                        half of them
their working
  worked          hoursone
            outdoors      outdoors   were analyzed.
                            to two-thirds              In bothtime
                                            of their working     countries,  approximately
                                                                      while the               half ofoutdoors
                                                                                 other half worked    them worked
                                                                                                                two to
outdoors    one  to  two-thirds  of their working    time   while  the other  half worked   outdoors
  three-thirds of their time. The majority of workers in both countries were healthy, while Slovenian  two  to three-
thirds  of their
  workers    hadtime.    The rate
                   a higher  majority  of workers
                                  of chronic  diseasein in
                                                        both  countries were
                                                           comparison          healthy,
                                                                          to Greek       whileThe
                                                                                    workers.    Slovenian   workersof
                                                                                                    characteristics
had
  theasample
       higher rate    of chronicin
                are presented    disease
                                    Table in
                                          1. comparison to Greek workers. The characteristics of the sample
are presented in Table 1.
       Table 1. A comparison of the questionnaire’s results in Greece and Slovenia—description of the samples.

                                                      Greece (n = 70)       Slovenia (n = 216)
                                Gender
                                 Male                      77.1%                   57.4%
                                Female                     22.9%                   42.6%
                                 Age
                                20–30                      20.0%                   14.8%
                                31–40                      44.3%                   30.6%
                                41–50                      10.0%                   23.1%
                                51–60                      15.7%                   22.2%
                             61 and more                   10.0%                    9.3%
                            Education level
                        Primary school or none             20.0%                    5.6%
                           Secondary school                21.4%                   43.5%
                               College                     25.7%                   26.4%
                           Bachelor’s degree               24.3%                   21.3%
                         Master’s degree/PhD                8.6%                    3.2%
                          Working outdoors
                            one–two thirds                 44.3%                   50.9%
                           two–three thirds                55.7%                   49.1%
                           Chronic disease
                                Yes                        15.7%                   30.6%
                                No                         84.3%                   69.4%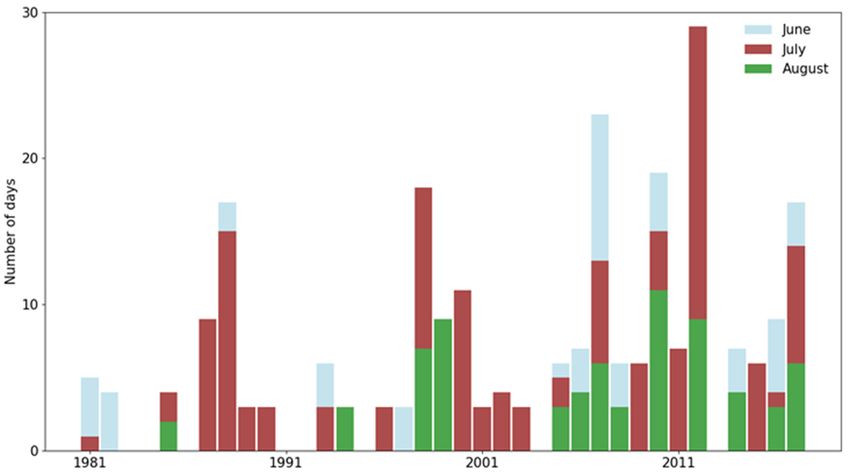
Working outdoors
                                   one–two thirds                   44.3%                50.9%
                                  two–three thirds                  55.7%                49.1%
                                  Chronic disease
                                          Yes                       15.7%                30.6%
  Int. J. Environ. Res. Public Health 2019, 16, 597                                                                       6 of 12
                                          No                        84.3%                69.4%

     Regarding the workers’ assessment of workplace temperature conditions during heat waves, the
        Regarding the workers’ assessment of workplace temperature conditions during heat waves,
vast majority of Greek (~ 95%) and Slovenian (~ 85%) workers described their workplace conditions
   the vast majority of Greek (~95%) and Slovenian (~85%) workers described their workplace conditions
as warm, hot and very hot. (Figure 4). However, in Slovenia, a small percentage of the workers (~15%)
   as warm, hot and very hot. (Figure 4). However, in Slovenia, a small percentage of the workers (~15%)
characterized the working conditions as “neither cool nor hot” or “slightly warm”.
   characterized the working conditions as “neither cool nor hot” or “slightly warm”.

           Figure
        Figure    4. Workers’
               4. Workers’    assessment
                           assessment     of their
                                      of their     workplace
                                               workplace     temperature
                                                          temperature    conditions
                                                                      conditions    during
                                                                                 during    heat
                                                                                        heat    waves.
                                                                                             waves.

        In both countries, the vast majority of the workers said that the heat stress impact was not
     In both countries, the vast majority of the workers said that the heat stress impact was not
   negligible for their work (Greece 93%, Slovenia 94%; p > 0.05) (Table 2). Furthermore, a high share
negligible for their work (Greece 93%, Slovenia 94%; p > 0.05) (Table 2). Furthermore, a high share of
   of the workers (Greece 69%, Slovenia 71%; p > 0.05) assessed the heat stress impact on productivity
the workers (Greece 69%, Slovenia 71%; p > 0.05) assessed the heat stress impact on productivity as
   as significant. According to the workers’ report, heat stress also had a significant impact on their
significant. According to the workers’ report, heat stress also had a significant impact on their well-
   well-being (a statistically significant difference between the percentages of workers in Greece (60%)
being (a statistically significant difference between the percentages of workers in Greece (60%) and
   and Slovenia (74%); p = 0.03), but not on their concentration (Greece 74%, Slovenia 62%; p > 0.05).
Slovenia (74%); p = 0.03), but not on their concentration (Greece 74%, Slovenia 62%; p > 0.05). All the
   All the stated impacts are statistically significant (p < 0.01) for the whole sample and for each country
stated impacts are statistically significant (p < 0.01) for the whole sample and for each country
   separately, with the impact on well-being in Greece being the only exception.
separately, with the impact on well-being in Greece being the only exception.
       Table 2. A comparison of the questionnaire’s results in Greece and Slovenia—personal experiences of
       workers (* statistically significant difference between the countries).

                                                                       Greece (n = 70)     Slovenia (n = 216)   p-Value
                       Heat stress impact is negligible
                                     Yes                                     7.1%                 6.0%           0.763
                                     No                                     92.9%                94.0%
             Heat stress has a significant impact on well-being
                                      Yes                                   60.0%                74.1%          0.025 *
                                      No                                    40.0%                25.9%
            Heat stress has a significant impact on concentration
                                      Yes                                   25.7%                38.0%           0.062
                                      No                                    74.3%                62.0%
             Heat stress has a significant impact on productivity
                                      Yes                                   68.6%                71.3%           0.664
                                       No                                   31.4%                28.7%
                     Experienced heat stress symptoms
                                  None                                       2.9%                 0.0%          0.013 *
                                  Thirst                                    70.0%                82.4%          0.026 *
                                Tiredness                                   51.4%                62.0%           0.116
                                Dizziness                                   18.6%                24.1%           0.340
                                Confusion                                   15.7%                10.6%           0.255
                             Enhanced stress                                12.9%                25.9%          0.023 *
                            Excessive sweating                              67.1%                84.7%          0.010 *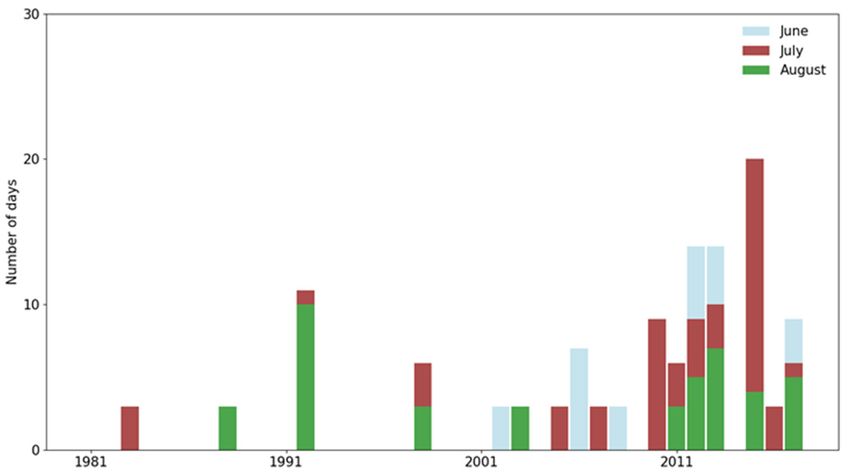
Int. J. Environ. Res. Public Health 2019, 16, 597                                                                  7 of 12

                                                          Table 2. Cont.

                                                                 Greece (n = 70)   Slovenia (n = 216)   p-Value
                    Experienced heat induced diseases
                               Headache                              44.3%               52.8%            0.217
                               Exhaustion                            51.4%               62.0%            0.116
                              Prickly heat                            5.7%               13.0%            0.095
                             Muscle cramps                            7.1%                6.0%            0.736
                                Fainting                              4.3%                8.3%            0.259
                            Nausea/vomiting                           5.7%               13.9%            0.066
                              Heat cramps                             4.3%                0.5%           0.018 *
                               Heat stroke                            5.7%                0.0%           0.05) and headache (Greece 44%, Slovenia 53%; p > 0.05). However,
in Greece there were more instances (difference statistically significant) of heat cramps (4%, 0.5%;
p = 0.02) and also more examples of heat stroke (6%, 0%; p < 0.001). Even though these two are the
most serious problems, there were slightly fewer hospitalizations due to heat stress in Greece (6%,
in Slovenia 7%; p > 0.05). All reported occurrences of heat stress symptoms, heat-induced diseases,
and hospitalizations are statistically significant (p < 0.01) for the whole sample and both countries
separately, with the exception of tiredness and exhaustion in Greece, and headache in all three samples.
     On the other hand, the share of workers who do not see any options to reduce their own exposure
to heat stress is significantly higher among Greek workers than Slovenian (24% and 13%; p = 0.02).
In both countries, drinking more water was found as the most common way to reduce heat stress
(64%, Slovenia 82%; p = 0.001). This was followed by measures including adjustment of the working
schedule (Greece only 34%, Slovenia 66%; p < 0.001), retreat to a cooler place during breaks (Greece 41%,
Slovenia 54%; p > 0.05), wearing more appropriate clothes (Greece 40%, Slovenia 49%; p > 0.05) and
increasing the number of breaks during the workday, which is also much less common in Greece
(Slovenia 33%, Greece 20%; p = 0.04). The shares of workers using the measures ‘retreat to a cooler
place’ and ‘wearing more appropriate clothes’ (p > 0.05) are statistically significant neither for Greece
nor for Slovenia, or for the whole sample, while the other shares are (p < 0.02).
     Very similar percentages of workers from both countries reported either a small impact on
productivity—reduced by less than 10% (more than 20% of workers from each country); or a medium
impact—10 to 30% fall in productivity (more than 40%; Figure 5).
(Slovenia 33%,
(Slovenia 33%, Greece
Greece 20%;20%; pp == 0.04).
0.04). The
The shares of workers using the measures ‘retreat‘retreat to
to aa cooler
cooler
place’and
place’ and‘wearing
‘wearing more
more appropriate
appropriate clothes’
clothes’ (p > 0.05) are statistically significant neither
neither for
for Greece
Greece
norfor
nor forSlovenia,
Slovenia, or or for
for the
the whole
whole sample,
sample, while the other shares are (p < 0.02).
Very similar
Very similar percentages
percentages of of workers
workers from both countries reported either a small small impact
impact on on
productivity—reduced by
productivity—reduced by less
less than
than 10%
10% (more than 20% of workers from each country);country); or
or aa medium
medium
Int. J. Environ. Res. Public Health 2019, 16, 597 8 of 12
impact—10to
impact—10 to 30%
30% fall
fall in
in productivity
productivity (more
(more than 40%; Figure 5).
Figure
Figure 5.Workers’
5. 5.
Figure Workers’
Workers’ assessment
assessment
assessment of
of of their
their
their reduced
reduced productivity
productivity
reduced due
due
productivity to to
due heat
heat
to stress
stress
heat during
during
stress heat
heat
during waves.
waves.
heat waves.
On On
Onthe
theother
the other
other hand,
hand,
hand, more
more
moreGreek
Greek
Greekworkers
workers
workers (24%,
(24%,
(24%,in inSlovenia
in Slovenia
Slovenia16%; p>
16%;
16%; pp >0.05) assessed
> 0.05)
0.05) assessedthe
assessed the
theloss
lossofof
loss of
productivity
productivityto be
to higher
be than
higher 30%.
than The
30%. study
The also
study revealed
also that
revealed the
thatmajority
the of
majority bothof
productivity to be higher than 30%. The study also revealed that the majority of both Greek (~50%) Greek
both (~50%)
Greek and
(~50%)
Slovenian
and workers
and Slovenian
Slovenian (~60%)(~60%)
workers
workers were not
(~60%) informed
were
were not by theirby
not informed
informed employer
by about how
their employer
their employer about
about to act
how
howduring
to actheat
to act waves.
during
during heat
heat
Among
waves. Among the informed workers, ‘discussions’ seem to be the most prevalent sourceinof
waves.the informed
Among theworkers,
informed‘discussions’
workers, seem to be
‘discussions’ the most
seem prevalent
to be the source
most of information
prevalent source of
both countries in
information
information (Greece:
in both ~25%, Slovenia:
both countries
countries (Greece:~30%)
(Greece: ~25%, (Figure
~25%, Slovenia:
Slovenia: 6).~30%)
~30%) (Figure
(Figure 6).
6).
Figure 6. Workers’ reports on how they were (or were not) informed about heat stress.
4. Discussion
The observed changes in the number, duration and intensity of heat waves (e.g., [4,20]),
which coincide with the perceived effect on the health and well-being of workers [15], mark an
important guideline for European research. The climatological background of heat waves in two
regions in Slovenia (Brnik) and Greece (Larisa) was analyzed and used as a framework to understand
different outdoor working conditions and acclimatization or knowledge bases. Questionnaire-based
research among outdoor workers provided an overview of the already experienced problems and the
ways of reducing heat stress.
The first part of the study showed the main differences in the climates of Brnik and Larisa in
terms of heat waves. Daily mean air temperatures were much higher in Larisa and heat waves were
already present in the earlier years of the period 1981–2017. Although the definition of a heat wave
is still an unresolved issue within the scientific community (e.g., [3,4,8,24,27]), the analysis followed
the recommendation of Pascal et al. [13] to use a high percentile of the meteorological indicators’Int. J. Environ. Res. Public Health 2019, 16, 597 9 of 12
distribution. The comparison of the heat waves’ characteristics in Brnik and Larisa looks similar to
the report of Kuglitsch et al. [28], who found that in the eastern Mediterranean, the intensity, length,
and number of heat waves have increased by a factor of 6 to 8 since the 1960s. Heat waves that are
unusual in the current climate will become more common along with rising global mean temperatures,
and could occur in any country in Europe [4]. To prepare prevention plans and share this information,
an appropriate means of public communication is needed, as the general public may not understand
the technical meteorological jargon. In Slovenia, the heat wave timeline (Figure 1) seems to work fine
for this purpose, as it combines a lot of information about each heat wave and is easy to understand.
Therefore, we recommend its use when explaining the climatology of heat waves to employers and
workers, which is a necessary step in expanding their knowledge of the topic and helping them
understand that the problem is escalating and how important it is to start implementing mitigation
and adaptation measures.
The second part provides an important insight into how wide the common range of experienced
health problems already is, and shows that productivity loss due to heat stress was noted.
Working people are particularly affected by high heat exposures in occupational settings [15], and this
situation will become harder as climate change progresses [29]. As older adults have a higher
susceptibility to heat stress [30], not only the increase in temperature but also the aging of the population
may contribute to higher numbers of people sensitive to heat—however, the acclimatization of the
population is also possible [13]. On the other hand, older workers are more experienced and more
familiar with the work, and hence more efficient [19]. According to Luther et al. [31], risk factors
for heat-related illnesses are mainly strenuous outdoor physical activity during the hottest day-time
hours, age above 64 years, limited access to air-conditioning, medication and substance use (alcohol),
mental illness, physical disability/impaired mobility, cognitive impairment, heart and lung disease.
Significant positive associations between temperature and acute work-related injury are also known for
a wider range of vulnerable worker subgroups, with the odds of injury increasing by 0.8% for each 1 ◦ C
increase in daily maximum temperature [32].
Although the climates of both cities differ in heat intensity, the results showed that workers from
both countries assessed heat stress impact on productivity as significant. Additionally, a slightly higher
percentage of Greek workers (not statistically significant) assessed the loss of productivity due to heat
stress to be higher than 30%. The majority of respondents considered heat stress to have no impact on
concentration, but to significantly affect well-being. Symptoms and diseases are mainly the same as
described by Luther et al. [31] to be the strongest indicators of heat stress: fainting, nausea and/or
vomiting, confusion, dizziness, diarrhea, headache, irritability, hallucination, loss of coordination,
weakness. There are several factors such as humidity, demography or people’s adaptation to heat
that may explain why a similar anomaly of temperature results in different health outcomes [13]. It is
interesting that despite lower temperatures, fewer and shorter heat waves, a statistically significant
higher share of Slovenian workers perceived the impact on well-being, and experienced thirst, excessive
sweating, and tiredness, followed by more heat-induced diseases than in Greece. The only exceptions
are heavier disease occurrence, like muscle and heat cramps and heat stroke, which prevailed in Greece,
the reason possibly being the higher temperature extremes. There were slightly more hospitalizations
due to heat stress in Slovenia, which could be due to the fact that Greek workers are more accustomed
to the hot climate, as it has not changed as much as in Slovenia in the last decade or two.
Considering the stated high impacts on the productivity and well-being of workers, it is urgent
to provide measures or guidelines to mitigate the impacts of heat stress. First of all, there is still
room for improvement in the provision of information, as more than half of the workers have not yet
been informed about possible impacts and actions during heat waves. At a later stage, even when
the knowledge level of individuals is good, there can be a misconception of people’s own risk [33]
or abilities. Even if ‘drinking more water’ was most commonly and naturally used as the measure
to lower heat stress, it does not mean that workers did, in fact, drink enough water. The study by
Piil et al. [34] showed that ~70% of workers in Europe often come to work dehydrated and stayInt. J. Environ. Res. Public Health 2019, 16, 597 10 of 12
dehydrated until the end of the work-shift. This is in line with a recent meta-analysis assessing global
literature, which reported that urine specific gravity is increased by 14.5% during a single work shift
under heat stress [15]. It is not surprising, therefore, that 15% of individuals working in heat stress
conditions suffer from kidney disease or acute kidney injury [15]. This is markedly higher compared
to the prevalence rates reported for kidney disease (10%) [35], as well as for acute kidney injury in
high- (2%) [36,37] and low- (3–9%) [38,39] income countries. Taken together, these results raise serious
concerns for the kidney function of individuals typically/frequently working in heat stress conditions,
because even a single episode of acute kidney injury can lead to chronic kidney disease with significant
socioeconomic and public health outcomes [40].
Despite our best intentions, it is important to note that the results obtained in this study should
be considered through the prism of certain limitations. For instance, the results are not necessarily
representative for Greece and Slovenia as only two stations were included in the analysis of heat
waves and due to the small size of the samples. However, the research gives a first indication of the
heat stress perception in these countries. Also, the workers’ self-assessments may be too subjective or
misinterpreted, but the majority is consistent with the already detected impacts of heat stress.
5. Conclusions
Our study showed the significance of heat stress impacts on outdoor workers, bearing in mind
that the data is limited to two stations in Greece and Slovenia. The assessed high negative impact
on productivity and well-being, endangering health, is consistent with the other findings of the
Heat-Shield project, where we aim to improve both health and productivity. An exchange of experiences
and lessons learned can substantially accelerate and improve the process of ensuring more heat resilient
working conditions in Europe. In communication with health institutions, policymakers, employers,
workers or others outside of the scientific field, it is of great importance to find out how to communicate
results in a clear and easy to understand way. Here, the representation of heat waves used in this paper
can be a good example, illustrating the increase in the frequency, intensity, duration and time span of
heat waves to the point.
The comparison of two stations in Greece and Slovenia showed higher temperatures and more
heat waves in Greece, but more noticeable changes in this field in Slovenia. Therefore, the lower degree
of acclimatization among Slovenian outdoor workers may be one of the main reasons they have more
often described conditions as very hot and perceived more heat stress symptoms and heat-induced
diseases than Greek workers. On the other hand, much higher temperature extremes in Greece could
be the reason higher productivity loss was perceived in Greece and why some heavier diseases were
experienced mainly there. As workers in both locations share a similar level of knowledge about
heat stress, educational campaigns are needed and further research of the problem, which includes
the testing of the efficiency of several mitigation measures, will be proposed on the Heat-Shield
project portal.
Author Contributions: Conceptualization, T.P., L.K.B. and Z.Č.; Formal analysis, T.P. and Z.Ž.; Investigation, Z.Ž.,
A.D.F. and K.P.; Methodology, T.P.; Supervision, L.K.B. and Z.Č.; Visualization, T.P. and Z.Ž.; Writing—original
draft, T.P.; Writing—review & editing, A.D.F., K.P. and Z.Č.
Funding: The present work has received funding from the European Union’s Horizon 2020 research and
innovation program under grant agreement No 668786 (HEAT-SHIELD).
Acknowledgments: The authors are indebted to Profs. Lars Nybo and Tord Kjellstrom, for their assistance and
fruitful discussions in the context of HEAT-SHIELD.
Conflicts of Interest: The authors declare no conflict of interest. The funders had no role in the design of the
study; in the collection, analyses, or interpretation of data; in the writing of the manuscript, or in the decision to
publish the results.Int. J. Environ. Res. Public Health 2019, 16, 597 11 of 12
References
1. Lau, N.C.; Nath, M.J. A Model Study of Heat Waves over North America: Meteorological Aspects and
Projections for the Twenty-First Century. J. Clim. 2012, 25, 4761–4784. [CrossRef]
2. Meehl, G.A.; Tebaldi, C. More Intense, More Frequent, and Longer Lasting Heat Waves in the 21st Century.
Science 2004, 305, 994–997. [CrossRef] [PubMed]
3. Bittner, M.I.; Matthies, E.F.; Dalbokova, D.; Menne, B. Are European countries prepared for the next big
heat-wave? Eur. J. Public Health 2013, 24, 615–619. [CrossRef] [PubMed]
4. Russo, S.; Sillman, J.; Fischer, E.M. Top ten European heatwaves since 1950 and their occurrence in the
coming decades. Environ. Res. Lett. 2015, 10, 124003. [CrossRef]
5. Pereira, S.C.; Marta-Almeida, M.; Carvalhocand, A.C.; Rocha, A. Heat wave and cold spell changes in Iberia
for a future climate scenario. Int. J. Climatol. 2017, 37, 5192–5205. [CrossRef]
6. WMO; WHO. Heatwaves and Health: Guidance on Warning-System Development; McGregor, G.R.,
Bessemoulin, P., Ebi, K., Menne, B., Eds.; World Meteorological Organization (WMO): Geneva, Schwitzerland,
2015; p. 96. ISBN 978-92-63-11142-5.
7. IPCC. Managing the Risks of Extreme Events and Disasters to Advance Climate Change Adaptation; Field, C.B.,
Barros, V., Stocker, T.F., Qin, D., Dokken, D.J., Ebi, K.L., Mastrandrea, M.D., Eds.; A Special Report of Working
Groups I and II of the Intergovernmental Panel on Climate Change; Cambridge University Press: Cambridge,
UK; New York, NY, USA, 2012; p. 582, ISBN 978-1-107-02506-6 Hardback, ISBN 978-1-107-60780-4 Paperback.
8. Watts, N.; Amann, M.; Ayeb-Karlsson, S.; Belesova, K.; Bouley, T.; Boykoff, M.; Byass, P. Countdown on
health and climate change: From 25 years of inaction to a global transformation for public health. Lancet
2017, 391, 581–630. [CrossRef]
9. Bouchama, A.; Knochel, J.P. Heat stroke. N. Engl. J. Med. 2002, 346, 1978–1988. [CrossRef]
10. Parsons, K. Human Thermal Environments. The Effects of Hot, Moderate and Cold Temperatures on Human Health,
Comfort and Performance, 3rd ed.; CRC Press; Taylor & Francis Group: London, UK, 2012; ISBN-10 146659599X,
ISBN-13 978-1466595996.
11. Nybo, L.; Kjellstrom, T.; Flouris, A.D.; Kajfež Bogataj, L. Global heating: Attention is not enough; we need
acute and appropriate actions. Temperature 2017, 4, 199–201. [CrossRef]
12. Gao, C.; Kuklane, K.; Östergren, P.O.; Kjellstrom, T. Occupational heat stress assessment and protective
strategies in the context of climate change. Int. J. Biometeorol. 2017, 62, 359–371. [CrossRef]
13. Pascal, M.; Wagner, V.; Le Tertre, A.; Laaidi, K.; Honoré, C.; Bénichou, F.; Beaudeau, P. Definition of
temperature thresholds: The example of the French heat wave warning system. Int. J. Biometeorol. 2013, 57,
21–29. [CrossRef]
14. Lowe, D.; Ebi, K.L.; Forsberg, B. Heatwave Early Warning Systems and Adaptation Advice to Reduce
Human Health Consequences of Heatwaves. Int. J. Environ. Res. Public Health 2011, 8, 4623–4648. [CrossRef]
[PubMed]
15. Flouris, A.D.; Dinas, P.C.; Ioannou, L.G.; Nybo, L.; Havenith, G.; Kenny, G.P.; Kjellstrom, T. Workers’ health
and productivity under occupational heat strain: A systematic review and meta-analysis. Lancet Planet Health
2018, 2, 521–531. [CrossRef]
16. Bethel, J.W.; Harger, R. Heat-Related Illness among Oregon Farmworkers. Int. J. Environ. Res. Public Health
2014, 11, 9273–9285. [CrossRef] [PubMed]
17. Ioannou, L.G.; Tsoutsoubi, L.; Samoutis, G.; Kajfez Bogataj, L.; Kenny, G.P.; Nybo, L.; Kjellstrom, T.;
Flouris, A.D. Time-motion analysis as a novel approach for evaluating the impact of environmental heat
exposure on labor loss in agriculture workers. Temperature 2017, 4, 330–340. [CrossRef] [PubMed]
18. Pogačar, T.; Črepinšek, Z.; Kajfež Bogataj, L.; Nybo, L. Comprehension of climatic and occupational heat
stress amongst agricultural advisers and workers in Slovenia. Acta Agriculturae Slovenica 2017, 109, 545–554.
[CrossRef]
19. Yi, W.; Chan, A.P.C. Effects of Heat Stress on Construction Labor Productivity in Hong Kong: A Case Study
of Rebar Workers. Int. J. Environ. Res. Public Health 2017, 14, 1055. [CrossRef] [PubMed]
20. Pogačar, T.; Casanueva, A.; Kozjek, K.; Ciuha, U.; Mekjavić, I.B.; Kajfež Bogataj, L.; Črepinšek, Z. The effect
of hot days on occupational heat stress in the manufacturing industry: Implications for workers’ well-being
and productivity. Int. J. Biometeorol. 2018, 62, 1251–1264. [CrossRef] [PubMed]Int. J. Environ. Res. Public Health 2019, 16, 597 12 of 12
21. Hunt, B.G. A Climatology of Heat Waves from a Multimillennial Simulation. J. Clim. 2007, 20, 3802–3821.
[CrossRef]
22. ECA&D project. Available online: https://www.ecad.eu/ (accessed on 18 October 2017).
23. SMD (Slovenian Meteorological Society). Available online: http://www.smd.v-izdelavi.si/data/upload/
vrocinski_val(1).pdf (accessed on 11 October 2017).
24. Kysely, J. Recent severe heat waves in central Europe: How to view them in a long-term prospect?
Int. J. Climatol. 2010, 30, 89–109. [CrossRef]
25. HEAT-SHIELD Project. Available online: https://www.heat-shield.eu/ (accessed on 23 January 2019).
26. Kjellstrom, T.; Odland, J.O.; Nilsson, M. Progress in the Hothaps program assessing impacts and prevention
of heat effects on working people in relation to local climate change. Asia Pacific Newslett. Occup. Heal Saf.
2011, 18, 24–25.
27. De Boeck, H.J.; Dreesen, F.E.; Janssens, I.A.; Nijs, I. Climatic characteristics of heat waves and their simulation
in plant experiments. Glob. Change Biol. 2010, 16, 1992–2000. [CrossRef]
28. Kuglitsch, F.G.; Toreti, A.; Xoplaki, E.; Della-Marta, P.M.; Zerefos, C.S.; Türkeş, M.; Luterbacher, J. Heat wave
changes in the eastern Mediterranean since 1960. Geophys. Res. Lett. 2010, 37, L04802. [CrossRef]
29. Kjellstrom, T.; Freyberg, C.; Lemke, B.; Otto, M.; Briggs, D. Estimating population heat exposure and impacts
on working people in conjunction with climate change. Int. J. Biometeorol. 2017, 62, 291–306. [CrossRef]
[PubMed]
30. Flouris, A.D.; McGinn, R.; Poirier, M.P.; Louie, J.C.; Ioannou, L.G.; Tsoutsoubi, L.; Sigal, R.J.; Boulay, P.;
Hardcastle, S.G.; Kenny, G.P. Screening criteria for increased susceptibility to heat stress during work or
leisure in hot environments in healthy individuals aged 31–70 years. Temperature 2017, 5, 86–99. [CrossRef]
[PubMed]
31. Luther, M.; Gardiner, F.W.; Hansen, C.; Caldicott, D. Hot of Not: Physiological versus Meteorological
Heatwaves–Support for a Mean Temperature Threshold. Int. J. Environ. Res. Public Health 2016, 13, 753.
[CrossRef]
32. McInnes, J.A.; Akram, M.; MacFarlane, E.M.; Keegel, T.; Sim, M.R.; Smith, P. Association between high
ambient temperature and acute work-related injury: A case-crossover analysis using workers’ compensation
claims data. Scand. J. Work Environ. Health 2017, 43, 86–94. [CrossRef] [PubMed]
33. Van Loenhout, J.A.F.; Guha-Sapir, D. How resilient is the general population to heatwaves? A knowledge
survey from the ENHANCE project in Brussels and Amsterdam. BMC Res. Notes 2016, 9, 499. [CrossRef]
34. Piil, J.F.; Lundbye-Jensen, J.; Christiansen, L.; Ioannou, L.; Tsoutsoubi, L.; Dallas, C.N.; Mantzios, K.;
Flouris, A.D.; Nybo, L. High prevalence of hypohydration in occupations with heat stress—Perspectives for
performance in combined cognitive and motor tasks. PLoS ONE 2018, 13, e0205321. [CrossRef]
35. Eckardt, K.U.; Coresh, J.; Devuyst, O.; Johnson, R.J.; Köttgen, A.; Levey, A.S.; Levin, A. Evolving importance
of kidney disease: From subspecialty to global health burden. Lancet 2013, 382, 158–169. [CrossRef]
36. Waikar, S.S.; Curhan, G.C.; Wald, R.; McCarthy, E.P.; Chertow, G.M. Declining mortality in patients with
acute renal failure, 1988 to 2002. J. Am. Soc. Nephrol. 2006, 17, 1143–1150. [CrossRef]
37. Xue, J.L.; Daniels, F.; Star, R.A.; Kimmel, P.L.; Eggers, P.W.; Molitoris, B.A.; Himmelfarb, J.; Collins, A.J.
Incidence and mortality of acute renal failure in Medicare beneficiaries, 1992 to 2001. J. Am. Soc. Nephrol.
2006, 17, 1135–1142. [CrossRef] [PubMed]
38. Krishnamurthy, S.; Mondal, N.; Narayanan, P.; Biswal, N.; Srinivasan, S.; Soundravally, R. Incidence and
etiology of acute kidney injury in southern India. Indian J. Pediatr. 2013, 80, 183–189. [CrossRef] [PubMed]
39. Naicker, S.; Aboud, O.; Gharbi, M.B. Epidemiology of acute kidney injury in Africa. Semin. Nephrol. 2008, 28,
348–353. [CrossRef] [PubMed]
40. Lameire, N.H.; Bagga, A.; Cruz, D.; De Maeseneer, J.; Endre, Z.; Kellum, J.A.; Liu, K.D.; Mehta, R.L.;
Pannu, N.; Van Biesen, W.; et al. Acute kidney injury: An increasing global concern. Lancet 2013, 382,
170–179. [CrossRef]
© 2019 by the authors. Licensee MDPI, Basel, Switzerland. This article is an open access
article distributed under the terms and conditions of the Creative Commons Attribution
(CC BY) license (http://creativecommons.org/licenses/by/4.0/).You can also read