Future
Forward:
An Economic Development Plan
for New Westminster, 2018-2023
←
→
Page content transcription
If your browser does not render page correctly, please read the page content below
Future Forward: An Economic Development Plan for New Westminster, 2018-2023

TABLE OF
     CONTENTS

     Future
4

     Forward

     Engagement
6

     Economy At
8

     A Glance

     Vision
     & Goals
14

     The
     Plan
18

     Appendix A:
     Sectoral Analysis
30
                         Table of Contents
Future Forward

FUTURE
FORWARD                                                   This economic development plan has been
                                                          developed in consultation with the local business
                                                                                                                       4. Drive continuous innovation in delivery of
                                                                                                                          city programs, projects and processes
                                                          community with a clear purpose to both support                  through implementation of Intelligent
                                                          and foster business growth. Future Forward                      New West.
Future Forward is a priority initiative for the City of   establishes an overarching strategy for guiding
                                                                                                                       5. Leverage Royal Columbian Hospital
                                                          activity of the City’s Economic Development Office
New Westminster and reflects City Council’s vision of     (EDO) that is synchronous with other city plans,
                                                                                                                          expansion activities to attract and retain
                                                                                                                          business, promote investment and
New Westminster as a sustainable, livable and thriving    policies and initiatives. It ensures New Westminster’s
                                                                                                                          support new employment in health care,
community, fueled by a strong local economy and           economic development efforts remain responsive
                                                                                                                          education and tech and creative sectors.
                                                          to current and future realities, leverages city
supported by active, engaged residents.                   initiatives, and provides a clear framework for              6. Communicate to business the value
                                                          guiding pursuit of new opportunities in Metro                   proposition of locating in New Westminster.
                                                          Vancouver’s evolving economy. Future Forward
                                                          also establishes a foundation for the City of            In addition, business retention and attraction
                                                          New Westminster to effectively engage with our           efforts will focus on the key sectors of education,
                                                          key economic development stakeholders and                healthcare, and technology and creative. These
                                                          other levels of government.                              sectors all share something in common: well-
                                                                                                                   paying jobs and growth potential, critical factors
                                                          While the success of local entrepreneurs and             for business in the larger Metro Vancouver region.
                                                          businesses is credited to hard work, perseverance        At the same time, the strategies and actions
                                                          and customer service, City Hall can play a vital         outlined in Future Forward will aid business
                                                          role by fostering an environment that meets the          growth in retail, arts and culture, and other
                                                          needs of both existing and new business while            important sectors that contribute to making
                                                          enabling continued local economic growth.                New Westminster a great place to work, live,
                                                                                                                   shop, and invest.
                                                          As New Westminster continues to grow, it is
                                                          imperative that continued proactive efforts be           Finally, New Westminster’s economic development
                                                          made to positively shape the local economic              efforts must fit into those of the broader regional
                                                          context. To do this, Future Forward outlines six         economy. Metro Vancouver’s Regional Prosperity
                                                          strategies that, together, will nurture a resilient      Initiative consists of key stakeholders from
                                                          and sustainable New Westminster economy.                 municipal government, post-secondary education
                                                                                                                   and the business community that are committed
                                                              1. Market and promote New Westminster’s              to improving and expanding economic growth in
                                                                 competitive advantage.                            the region. New Westminster is proud to play a
                                                              2. Formalize the leadership role of the              role in this initiative and through this plan will
                                                                 Economic Development Office as                    continue to collaborate with neighbouring
                                                                 the business community’s advocate at              municipalities and stakeholders on projects and

                                                                                                                                                                                          Future Forward
                                                                 City Hall.                                        initiatives that strengthen the regional economy.

                                                              3. Build a fertile environment for growth
                                                                 and expansion of business through
                                                                 ongoing collaboration and engagement
                                                                 with key stakeholders.
                                                                                                                                                                                            5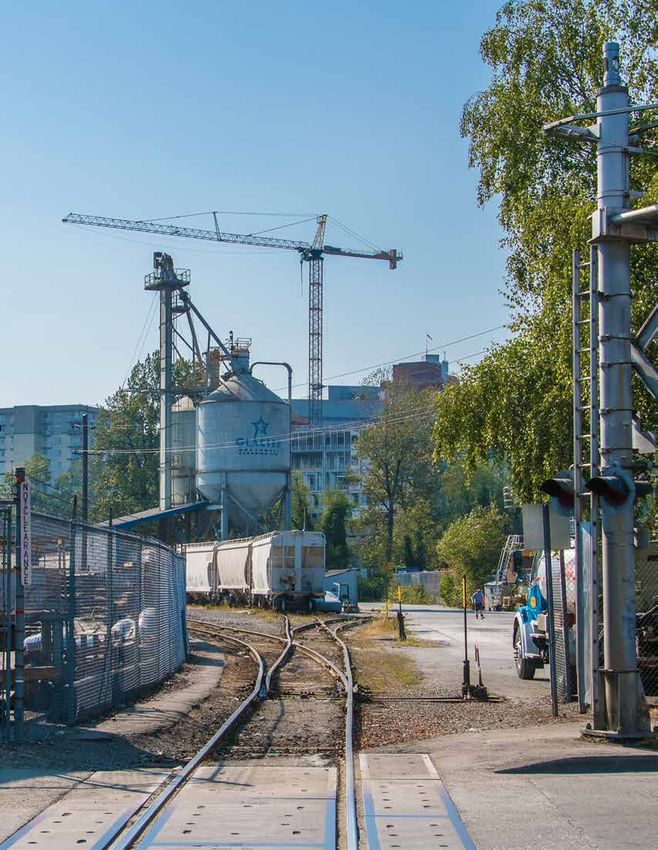
Engagement
                                                                                                                                                                                                                                                Vision, Goals, and Action

ENGAGEMENT
An extensive consultation process was conducted to gain business
community input and secure broad-based support for Future Forward.
City Council and staff acknowledge and appreciate the insight and
time contributed by the many businesses, stakeholder organizations,
and committees that participated throughout the process. The
following is a summary of the engagement activities that took place
in the development of the plan.

               Business Survey:                                       Economic Development                                  Engagement with the local business                      Alignment with
               Mustel Group conducted a survey consisting             Advisory Committee:                                   community revealed four themes that                     other plans and initiatives
               of nearly 600 interviews with local community          Given their advisory role to New Westminster’s        guided the development of the goals and                 Future Forward establishes an overarching strategy for guiding activity
               business owners/managers. One-on-one                   economic development efforts and knowledge of         strategies within this plan and provided                of the City’s EDO that is synchronous with other city plans, policies and
               interviews were also conducted with senior             existing practices and initiatives, the City’s        focus for specific actions. The four                    initiatives and ensures collaboration with the same. In some cases,
               business leaders, key business community               Economic Development Advisory Committee was           themes were:                                            further details on implementation of relevant policy areas can be found
               stakeholders, and economic development partners.       consulted through all stages of plan formulation.                                                             in the other plans such as the Official Community Plan Employment &
                                                                                                                               • Promotion and Marketing,                           Economy chapter, BridgeNet and IDEA Centre Roadmap.
               Business Community Workshops:                          Urban Development Institute                              • Business Experience,
               Local business owners and managers participated        Focus Group:                                                                                                  Taken together, these efforts are meeting with success. Future Forward
                                                                                                                               • Business Recruitment, Retention,                   seeks to build upon these plans and initiatives through a series of
               in a series of focus groups held throughout            Due to the significant impact development has
                                                                                                                                 Expansion and Economic
               New Westminster to provide input on the local          on the growth and prosperity of local economies,           Diversification, and                               targeted strategies and actions that facilitate local economic growth and
               business environment, interactions with city hall      and given potential insights into appropriate                                                                 business success. X
               and perspectives on data and information               business mix and sectors necessary to ensure             • Social and Livability.
               required for important business decisions.             community livability, members of the Urban
                                                                      Development Institute board and staff participated
               Business Stakeholder Workshops:                        in a development community focus group to
                                                                      share their perspectives.                                 Envision                     Official                    Intelligent City            Regional Prosperity                   Arts
               Key business stakeholders including the                                                                           2032                     Community Plan                 Strategic Plan                   Initiative                     Strategy
               New Westminster Chamber of Commerce,
               local business associations and Tourism New            Intelligent City Knowledge
               Westminster participated in a focus group to           Workforce Sub-committee Focus Group:
               share their knowledge of local business                With an objective to “create sustainable program(s)

                                                                                                                                                                                                                                                                            Future Forward
               strategic planning needs as well as perspectives       to connect education with employment in the
               on how the city can align economic development         knowledge workforce economy” (City of New
               activities and processes to foster business success.   Westminster, 2017), a focus group was held with
                                                                      the ICAC Knowledge Workforce sub-committee                                 Master                    IDEA Centre                      Waterfront              Electrical Utility
                                                                                                                                           Transportation Plan              Roadmap                          Vision                   Commission
                                                                      to solicit their expertise and input.                                                                                                                          Strategic Plan
                                                                                                                                                                                                                                                                               7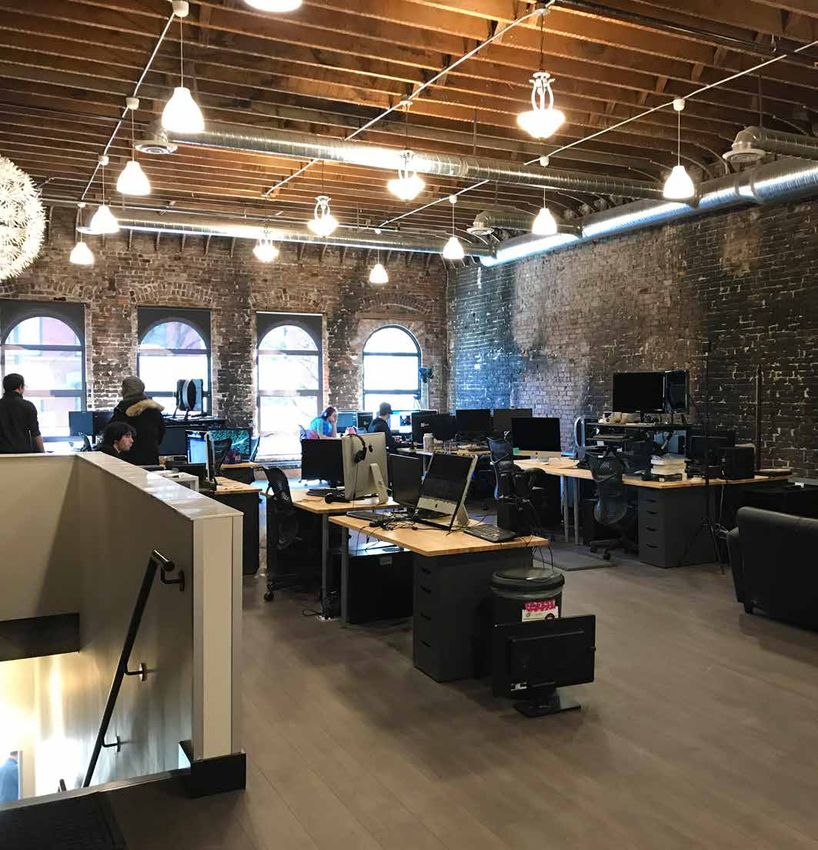
Economy at a Glance
ECONOMY
AT A GLANCE
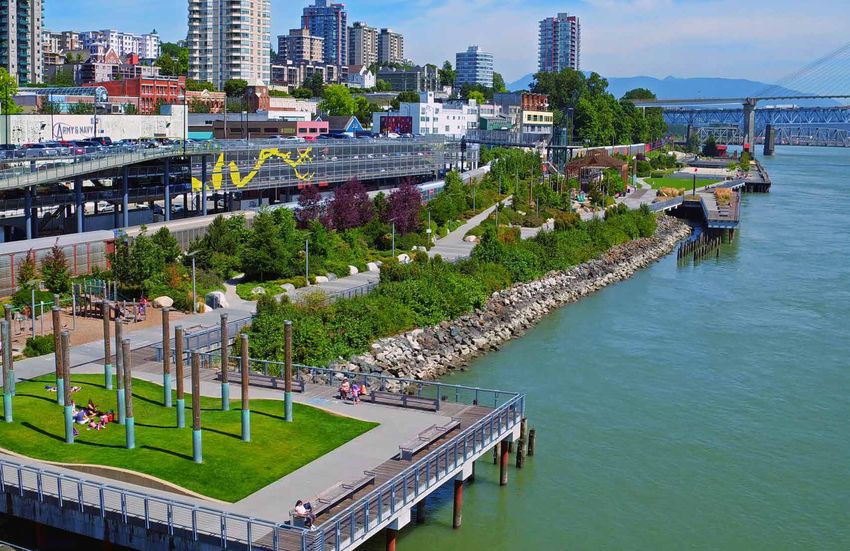
New Westminster, British Columbia is a historic and
compact community of approximately 70,000 residents.
At 15 square kilometers and located at the geographic
Economic Evolution largest employment sector, with over 6,000 people
centre of Metro Vancouver, our city is neighboured by employed. At the same time, professional,
New Westminster’s early years saw the community
larger municipalities that tend to overshadow the regional develop into a bustling centre of commerce on scientific and technical job growth has been
Canada’s west coast. Arrival of the railway continued significant, with job numbers between 2006 and
economic landscape (i.e. Vancouver, Burnaby, Surrey).
a pattern of industrial growth with lumber mills 2016 increasing by 35.7%. New Westminster’s
and manufacturing industries dotting the city’s creative sector also experienced significant growth
Fraser River shoreline. The vibrant commercial over the same period at 20.5% for information and
district in the downtown core that had flourished cultural industry jobs and a 44.3% for those in the
from the city’s founding and established New arts, entertainment, and recreation sector.
Westminster as the financial, cultural and services
destination of BC’s lower mainland continued to Analysis, along with the local context, provides the
thrive into the twentieth century. following justification for highlighting these
sectors for future growth:
While past decades have seen New Westminster’s
local economy endure its share of challenges, our >> Health care and social assistance:
city possesses the essential ingredients for growth significant increase in number of jobs, key
due to our compact size, central location in an part of local economy, well-paying stable
expanding region and ready access to rapid transit. jobs, positive growth prospects.
In recent years these factors, combined with
>> Professional, scientific and technical
concerted revitalization efforts have placed New
services: positive growth prospects,
Westminster in an enviable position to harness
well-paying jobs.
expanded economic activity, promote existing
business growth and attract new investment. >> Educational services: well-paying,
stable jobs, existing concentration of
education facilities.
Key Employment
Sectors and Current State >> Creative and knowledge-based sector:
Between 2006 and 2016, the number of employed positive growth prospects, well-paying jobs.
workers in New Westminster increased by 15.5%,
Future Forward
from 23,465 to 27,100 (Statistics Canada, 2006 A detailed local employment sector analysis is
and 2016 Censuses). Over this period, change found in Appendix A.
varied greatly by industry, with significant decreases
in manufacturing and wholesale trade sectors and
large increases in key sectors such as health care
and social services. Currently, health care is the 9
Economy at a Glance Vision, Goals, and Action
Demographic Snapshot
New Westminster’s characteristics have shifted over the past 25 years in a number of
ways. Substantial growth around the city has occurred, such as in the Downtown,
Uptown and, more recently, Sapperton neighbourhoods. New Westminster’s strengths
can partly be attributed to its history, centrality in the region, prevalence of SkyTrain
stations, and the contributions made by institutions located here, such Douglas College,
Justice Institute of British Columbia and Royal Columbian Hospital. As important,
census figures provide solid proof that ours is a dynamic, multicultural, and growing city.
Population & Housing
Over the past 25 years, New Westminster has experienced steady population growth,
increasing from 43,585 in 1991 to 70,996 people in 2016 (Statistics Canada, 1991 and
2016 Censuses), a growth rate of nearly 63%. This strong population growth has driven
housing starts, with 12,626 new housing units added over the same period. (CMHC,
Starts and Completions Survey).
Census Populations New Westminster
New Westminster, 1991-2016 Age Distribution of Population by 20-year Age Groups
New Westminster, 2016
120,000
50.0%
Census Population
100,000
40.0%
% of Population
70,996 31.1% 30.4%
80,000
65,976 30.0%
54,656 58,549
60,000 49,350 16.8% 17.6%
20.0%
43,585
40,000
10.0%
4.0%
20,000
0.0%
1991 1996 2001 2006 2011 2016 0-19 years old 20-39 years old 40-59 years old 60-79 years old 80+ years old
Age Groups
Age profile – In 2016, the majority of New Westminster residents were either 20-39
years old (31.1% of population) or 40-59 years old (30.4% of population). (Statistics
Canada, 2016 Census).
Immigration – As of 2016, over one-third of New Westminster residents were
immigrants (34.9%), with 3,500 new Canadians settling in New Westminster during
the 2011-2016 period. (Statistics Canada, 2016 Census).
Income – New Westminster families have higher median before-tax incomes
($83,100/year) than for Metro Vancouver as a whole ($79,930/year). In 2015, New
Westminster singles also had higher median before-tax incomes ($32,590/year)
than for Metro Vancouver as a whole ($27,890/year) (Statistics Canada, 2015
Future Forward
Taxfiler data).
Education – Working age (25-64 years old) residents of New Westminster are
well-educated, with approximately seven in ten (69.5%) having post-secondary
education and more than one in three (35.6%) holding a bachelor’s degree or higher
level of education (Statistics Canada, 2016 Census). 11
Economy at a Glance
Retail and Service Commercial Floor Space – (Coriolis Consulting Corporation, Urban Development
New Westminster could support 65,000 square Forecast 2013 to 2041). This increase in industrial
metres (approximately 700,000 square feet) of floor space will be achieved by the protection and
additional neighbourhood-serving retail and service better utilization of existing industrial land.
space by 2041 (Coriolis Consulting Corporation,
Urban Development Forecast 2013 to 2041). To Institutional Floor Space – A majority of the
ensure existing commercial nodes are supported increase in institutional floor space is anticipated
and to avoid market dilution, the OCP has reduced to occur through expansion of existing institutions
the amount of land designated for retail and such as Royal Columbian Hospital, the Justice
service commercial. This will ensure that existing Institute of BC and Douglas College. These institutions
commercial areas of the city remain vibrant and are major employers in the city and combined they are
businesses can thrive. projected to add over 2,600 new jobs by 2041 (Coriolis
Consulting Corporation, Urban Development Forecast
Industrial Floor Space – The city could see an 2013 to 2041).
additional 200,000 square metres (over 2,000,000
Future Growth square feet) of industrial floor space by 2041
Metro Vancouver’s regional growth strategy (Metro 2040) anticipates New Westminster’s
population will expand to over 90,000 by 2031 and surpass 100,000 by 2041. This is
Figure 13: Anticipated Additional Neighbourhood-Serving Retail and Service Space by Area (2011-2041)
consistent with the projections done by Coriolis Consulting Corporation for the City for Source: Coriolis Consulting Corp, City of New Westminster Urban Development Forecast – 2013-2041
the 2013-2041 period, as shown below. The City’s Official Community Plan (OCP) seeks
to manage this growth in a balanced and sustainable way. Area Additional Neighbourhood-Serving Retail and Service Space (2013-2041)
The Rest of the City 25,560 sq.m. (275,131 sq. ft.)
Figure 11: New Westminster’s Anticipated City-Wide Growth Downtown 28,133 sq.m. (302,808 sq. ft.)
Source: Coriolis Consulting Corp, City of New Westminster Urban Development Forecast – 2013-2041
Queensborough 12,425 sq.m. (133,738 sq. ft.)
City Wide 66,118 sq.m. (711,688 sq. ft.)
Year 2013 2021 2031 2041
Total Population 68,280 79,061 92,098 103,871
Total Housing Units 31,611 36,602 42,638 48,088 Figure 14: Anticipated Additional Office Floor Space by Area (2011-2041)
Source: Coriolis Consulting Corp, City of New Westminster Urban Development Forecast – 2013-2041
Total Jobs 24,845 Not Available Not Available 46,030
Area Additional Neighbourhood-Serving Retail and Service Space (2013-2041)
Note: Jobs discussed in this section reflect any employment position, not just full-time positions.
The Rest of the City 120,203 sq.m. (1,293,858 sq. ft.)
Downtown 47,913 sq.m. (515,729 sq. ft.)
Employment Trends
Queensborough 21,263 sq.m. (228,874 sq. ft.)
Additional retail, office, industrial and institutional floor space city-wide will
City Wide 189,379 sq.m. (2,038,461 sq. ft.)
correspond with an estimated 21,000 new jobs by 2041 (Coriolis Consulting
Corporation, Urban Development Forecast 2013 to 2041).
Office Floor Space – The City is forecasting close to 200,000 square metres (over Figure 15: Summary of Anticipated Additional Floor Space and Employment Growth (2011-2041)
Source: Coriolis Consulting Corp, City of New Westminster Urban Development Forecast – 2013-2041
2 million square feet) of office floor space will be added locally by 2041 (Coriolis
Consulting Corporation, Urban Development Forecast 2013 to 2041). Some of this floor Area Additional Floor Space (2013-2041) Employment Growth ( Jobs)
Future Forward
space will be accommodated in upper floors of mixed-use buildings in Downtown,
Retail/Service 135,000 sq.m. (1,500,000 sq. ft.) 4,230
Uptown, and along transit-oriented corridors such as Twelfth Street. The majority of
Office 190,000 sq.m. (2,000,000 sq. ft.) 11,325
this new space will be accommodated in major new developments located in Sapperton
Green and the Brewery District. In addition, additional office space is being encouraged Industrial 200,000 sq.m. (2,200,000 sq. ft.) 2,945
within a five-minute walk of Royal Columbian Hospital to accommodate health services Institutional Not Available 2,685
connected to hospital expansion activity currently underway. City Wide 525,000sq.m. (5,800,000 sq. ft.) 21,185 13
Vision & Goals

VISION
& GOALS      VISION FOR NEW WESTMINSTER

             New Westminster’s OCP provides a broad
             framework for managing future growth and
             change in our community over the next 25 years.
             The strategies and actions outlined in
             Future Forward are consistent with OCP
             objectives and focus cultivating a nurturing
             environment for business to thrive.

             The OCP’s vision sees New Westminster as a healthy, inclusive and thriving
             community where people feel connected with each other. This sustainable
             city showcases a spectacular natural environment, public spaces and
             unique neighbourhoods that are well-connected and accessible. Superior
             urban design integrates its distinctive character, heritage assets and
             cultural identity. Growth and development provide a variety of services and
             employment opportunities that contribute to a high quality of life for all.

          OCP Economy &
          Employment Goal:
                                        New Westminster has a diverse

                                                                                                       Future Forward
                                        and adaptive economy and is a
                                        desirable place to work, live,
                                        shop and invest.
                                                                                                       15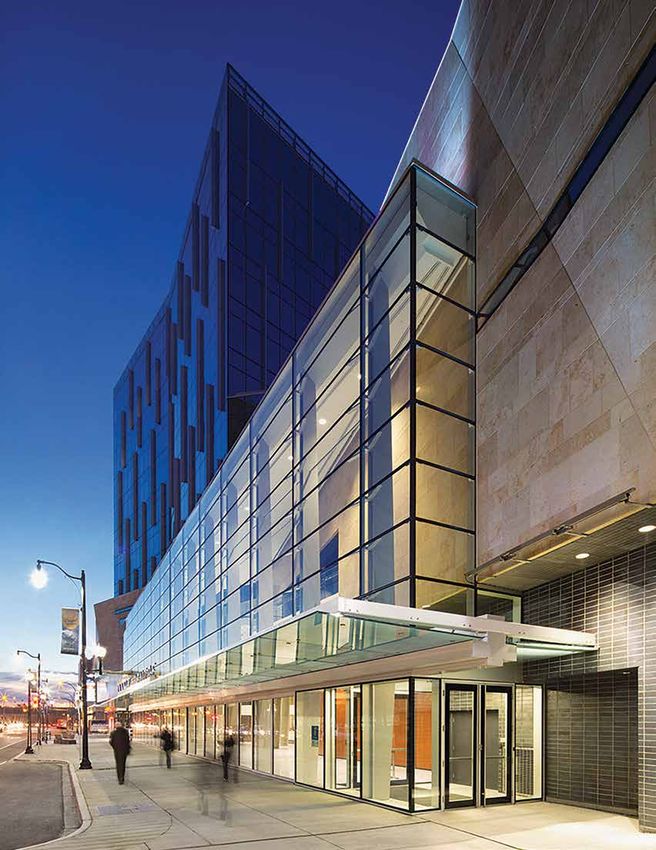
Vision & Goals

Guided by feedback from the local business
community, City priorities and consideration of
current context, New Westminster’s EDO
activity will pursue the following four goals:

  Goal 1                                                   Goal 2                                                                       Goal 3                                                              Goal 4

Establish New Westminster’s                              Drive New Westminster’s                                                      Secure diversity in the local economic                               Support livability initiatives that
reputation as an ideal location for                      commitment to delivery of a positive                                         base through recruitment, retention                                  make New Westminster a great place
both start-ups and established                           business experience at city hall.                                            and expansion activities.                                            to live, work and invest.
businesses to thrive and grow.
                                                         Businesses thrive on a stable, predictable business                          Business recruitment, retention, expansion                           Great cities offer a range of housing options,
EDO promotion and marking efforts will focus on          climate and successful cities require less time                              and diversification are cornerstones of economic                     recreational activities and a variety of business
New Westminster’s key strengths. Activities will         and energy addressing challenges presented by                                development practice. Remaining aware of the                         and employment opportunities. EDO activity will
target growth sectors, will be designed to ensure        undue process. Through ongoing cultivation of                                surrounding local context, economic development                      support social and livability initiatives including
the city is well positioned to capitalize on Metro       an entrepreneur-friendly spirit at city hall, and                            initiatives will be tailored to support sectoral needs,              investments in public services and infrastructure
Vancouver’s pull and will attract interest, investment   streamlining of processes where possible, we will                            economic diversity, community desire and the ability                 that contribute to quality of life and make
and long-term sustainability for local business.         create a positive environment for business to                                to accommodate the growth of both established                        New Westminster a great place for business and
                                                         prosper and grow.                                                            and new business.                                                    their employees.

                                                                                                                                                                     What is
                                                                                                                                                                 Economic Development?
                                                                                                                                                                                       Economic development in the local context can be
                                                                                                                                                                                       defined as efforts designed to promote and encourage

                                                                                                                                                                                                                                                                     Future Forward
                                                                                                                                                                                       economic growth and expansion, in targeted ways,
                                                                                                                                                                                       that ensure a community has sustainable employment
                                                                                                                                                                                       opportunities and can provide enhanced livability for
                                                                                                               Credit: River Market

                                                                                                                                                                                       its residents into the future.                                                17
The Plan

THE PLAN
                                                     Strategy 1

                                                    Market and promote New Westminster’s
                                                    competitive advantage.
                                                    New Westminster’s central location, access to rapid             Primary Actions
The work of the EDO will focus on six strategies    transit, distinct heritage buildings, and riverfront location      a. Develop a marketing strategy that leverages
in pursuit of our goals. Actions will concentrate   make us unique in the region and an attractive place for              New Westminster’s advantages in education
                                                    businesses and their employees. To compete in today’s                 and health care and targets business in these
on marketing and promoting the city as a place      economy it is important for New Westminster to highlight              growth sectors.
for business, solidifying key stakeholder           the very characteristics that make us competitive. At the
                                                    same time, as a key player in the Metro Vancouver                  b. Develop a marketing strategy that targets
relationships and development of collaboration                                                                            tech and creative businesses and includes
                                                    economy, we benefit from business growth experienced
initiatives while laying the foundation for         by neighbouring municipalities.                                       ongoing identification of businesses in these
                                                                                                                          growth sectors.
continued economic growth.
                                                    While working as a Regional Prosperity Initiative member           c. Actively engage with key local stakeholders as
                                                    to promote the region as a place for investment, the EDO              well as Metro Vancouver’s Regional Prosperity
                                                    will continue to build a strong economic development                  Initiative to ensure New Westminster’s
                                                    brand for New Westminster through the development of                  competitive advantages are promoted in
                                                    a compelling suite of economic development resources                  regional efforts to secure investment and
                                                    and marketing assets. Through collaboration with our                  job growth.
                                                    business stakeholders, brand and marketing material
                                                    will effectively highlight our key advantages and be               d. Explore actions that respond to the need for
                                                    designed with target sectors and evolving demographics                office space in a dynamic and growing local
                                                    in mind.                                                              economy, including preservation of office floor
                                                                                                                          space in redevelopment scenarios.
                                                    Ensuring a supply of suitable industrial, office and retail        e. Work with the Planning Division in the
                                                    floor space throughout the city is also important,                    development of the Lower Twelfth Street Plan
                                                    providing options to new businesses locating here as well             that facilitates the area as a creative
                                                    as existing businesses needing to expand.                             employment zone that supports a mix of uses
                                                                                                                          such as ultra light industrial, maker space,
                                                                                                                          commercial, and retail.
                                                      The Evolution Of Retail                                          f.   Collaborate with Internet Service Providers to
                                                                                                                            market BridgeNet to existing and prospective
                                                                        The face of retail is changing and the
                                                                                                                            businesses, as well as property owners.
                                                                        sector remains both an important
                                                                        component of a vibrant local economy
                                                                        and significant employer in New             Supporting Actions
                                                                        Westminster. Experiential retail               g. Collaborate with local partners on programs
                                                                        – providing consumers with a positive             and initiatives that encourage residents and
                                                                        experience or brand encounter to                  businesses to spend dollars locally.
                                                                        compel a bricks and mortar visit – is
                                                                                                                       h. Develop a business package that illustrates
                                                                        vital. The EDO will work with local

                                                                                                                                                                                        Future Forward
                                                                                                                          New Westminster’s investment attractiveness
                                                                        business stakeholders to develop
                                                                                                                          and competitive advantage that can be used by
                                                                        initiatives that help local retailers
                                                                                                                          key local stakeholders to promote the city.
                                                                        respond to the changing retail
                                                                        landscape as well as encourage                 i.   Continue to support the tourism sector through
                                                                        residents to spend their dollars locally.           collaboration with local organizations in the
                                                                                                                                                                                        19
                                                                                                                            promotion of local assets including heritage,
                                                                                                                            the riverfront, and arts and culture.
The Plan VISION, GOALS, AND ACTION
Strategy 2
Formalize the leadership role of the
Economic Development Office as
the business community’s advocate
at City Hall.
Time is money and no one understands this more than Primary Actions
entrepreneurs and business owners. The City wants to a. Explore a ‘Business Hub’ function at City Hall.
support business success and the EDO has a
significant role to play as the advocate for business at b. Conduct an audit of the City Hall customer
City Hall. journey and develop an associated customer
service strategy for business.
In collaboration with other City departments, the EDO c. Create a ‘how-to establish a business in
will work to ease process and red tape, ensuring local New Westminster’ guide.
businesses are able to focus efforts on their bottom
line. This involves making City Hall entrepreneur- d. Work with city departments to review and
friendly through the streamlining and clarification of revise, as necessary, business-related bylaws
policies and processes, underscored by a commitment and policies.
to customer service. Given the fast pace of change
today, it is essential the City remains open to reviewing Supporting Actions
and responding to the evolving location and space e. Conduct a review and update of digital resources
needs of business, such as shared office space and for prospective and existing businesses.
home-based business.
f. Implement quarterly meetings between city
As important, we will remain aware of the need to departments for continuous monitoring and
effectively engage with all audiences, whether a improving of business-related processes.
FUTURE FORWARD
start-up, existing business, home-based entrepreneur, g. Implement customer service strategy for
or new Canadian business owner. business at City Hall.
Business Hub Concept
Future Forward
Many municipalities are pursuing a ‘business hub’ concept for establishing a positive business
experience at City Hall. These one-stop assistance centres can be a valuable business tool
that benefits business by eliminating frustrating referrals from one department to another in
addition to time saved when procuring necessary information.
20 DThe Plan
Strategy 3
Build a fertile environment for growth
and expansion of business through
ongoing collaboration and engagement
with key stakeholders.
New Westminster offers new and existing businesses a Primary Actions
wealth of opportunities and local stakeholders have a a. Identify and engage business community
strong voice in how we build our economy. We recognize stakeholders by sector for regular dialogue with
that collaboration is an essential ingredient for success. the city to identify challenges and opportunities.
The EDO will continue to work with partners on local
economic development efforts and promote existing b. Develop a business plan that identifies
and new business mentoring initiatives. Through our opportunities for a maker-space that supports
collaborative efforts, we enhance business attraction a start-up culture as well as entrepreneurs.
and retention and ensure a dynamic and diverse c. Develop an inventory of existing local
economic base for the future. businesses by sector to monitor growth
and identify opportunities for retention in
New Westminster.
CNW/NWCoC Business
d. Evaluate Economic Development Advisory
Roundtable Series Committee Terms of Reference to reflect
support of economic development plan activity
Recently, the EDO and the New
and ensure formal representation from target
Westminster Chamber of Commerce
growth sectors.
collaborated on a business roundtable
series held in commercial areas e. Ensure BridgeNet is accessible for small and
throughout the city. These meetings medium enterprises.
provided both the EDO and the f. Administer a business survey every 3 years.
Chamber with a better understanding
of issues impacting local business and
an opportunity to share updates on Supporting Actions
key programs and initiatives. g. Support local business organizations in
Future Forward
business mentorship and networking initiatives.
h. Facilitate the connection of businesses,
organizations and stakeholders to public
Credit: River Market
sector agencies, leasing agents, building
owners and investors.
23The Plan Vision, Goals, and Action
Strategy 4
Drive continuous innovation in
delivery of city programs,
projects and processes through
implementation of Intelligent
New West.
The Intelligent New West initiative is fostering a culture of continuous innovation
through the harnessing of city-owned fibre infrastructure (BridgeNet) and an
open government philosophy to enhance opportunities in the digital economy.
Future Forward recognizes the positive impact that innovation and technology
has on local economies. New Westminster’s EDO will continue to play an integral
part in the development and implementation of Intelligent New West initiatives,
growing our employment base, improving access to digital tools and solutions
and increasing opportunities for business.
Primary Action
a. Collaborate on the updating and implementation of the Intelligent
New West Strategy.
Supporting Action
b. Work with city departments to incorporate digital solutions that drive
operational efficiencies.
BridgeNet
The City is investing in the digital economy with BridgeNet,
a high-speed fibre network stretching from one end of the city
to the other. Connecting commercial districts and many of
New Westminster’s multi-unit residential buildings, BridgeNet
provides greater access and accessibility to high-speed internet
services by facilitating a broader range of choice of Internet
Future Forward
Future Forward
Service Providers. Through BridgeNet, New Westminster aims
to attract more innovative companies and knowledge workers
to the city and provide existing businesses with a competitive
advantage in today’s digital economy.
24 25The Plan
Strategy 5
Leverage Royal Columbian
Hospital expansion activity to
attract and retain business,
promote investment and
support new employment in
health care, education and
tech and creative sectors.
Healthcare is an important economic sector in New Westminster with
Royal Columbian Hospital (RCH) the city’s largest employer and a major
healthcare anchor within the region. Through operating expenditures,
visitor spending and investments in research, RCH generates an annual
economic output of $66 million in New Westminster and $495 million
across British Columbia.
IDEA Centre is an initiative being developed in concert with RCH expansion
and redevelopment activity currently underway in order to create
expanded economic opportunity in the Sapperton business area that
surrounds the hospital and elsewhere in New Westminster. The IDEA
Centre Roadmap provides a clear vision and actions for regional partners
to drive health-related economic development in the city while promoting
cost efficiencies and successful clinical outcomes within RCH and Fraser
Health. Work includes connecting with other regional partners, such as
Surrey’s Innovation Boulevard, post-secondary institutions, research and
development organizations and businesses and with city-owned assets,
such as the Sapperton District Energy System and BridgeNet.
Future Forward
Primary Action
a. Collaborate with stakeholders, including post-secondary
institutions, Fraser Health, and local developers to implement
the IDEA Centre strategy and road map.
27The Plan Vision, Goals, and Action
Strategy 6
Communicate to business the
value proposition of locating
in New Westminster.
What gets measured gets done. To build success and stay on course with
Future Forward goals and strategies we must understand and measure
our progress on the actions outlined. Through a commitment to continual
review, revision and improvement of our approach as necessary, we will
ensure optimization of EDO resources and outcomes.
Primary Actions
a. Develop a public communication piece that highlights
Economic Development Plan strategy action items and
implementation progress.
b. Work with the Economic Development Advisory Committee to
determine appropriate baseline metrics for evaluating economic
development plan progress and develop dashboard for tracking
the same.
c. Provide regular update reports to the Economic Development
Advisory Committee and City Council on economic development
plan progress and metrics.
Future Forward
Future Forward
28 29Appendix A: Sectoral Analysis
Economic Strategy – Sectoral Analysis
APPENDIX A: Change in number of workers by industry,
SECTORAL
employed workers working in New Westminster, 2006-2016
The number of employed workers working in New Westminster accommodation and food services (+815) and professional,
(regardless of municipality of residence) increased from scientific and technical services (+505). There was also a
ANALYSIS
23,465 in 2006 to 27,100 in 2016, an increase of 3,635 large increase in transportation and warehousing (+725).
employed workers (an 15.5% increase)(Table 1). There were
large decreases in some goods industries such as Health care and social assistance (6,270 employed
manufacturing (a decrease of -1,375 employed workers) and workers), retail trade (3,170), accommodation and food
wholesale trade (-260) and large increases in some service services (2,425) and education services (2,205) were the
industries such as health care and social assistance (an four largest sectors in 2016. Health care and social
increase of +965 employed workers), retail trade (+910), assistance, manufacturing, retail trade, and educational
services were the four largest sectors in 2006.
Table 1: Number of employed workers working in New Westminster
(regardless of municipality of residence), by industry sector (2-digit NAICS 2012), 2006 and 2016i,ii
Number of Number of # change in number % change in number
Industry
workers, 2006 workers, 2016 of workers, 2006-2016 of workers, 2006-2016
Total employed workers 23,465 27,100 3,635 15.5%
11 Agriculture, forestry, fishing and hunting 120 105 -15 -12.5%
21 Mining and oil and gas extraction 0 20 20 n/a
22 Utilities 50 0 -50 -100.0%
23 Construction 805 755 -50 -6.2%
31-33 Manufacturing 2,475 1,100 -1,375 -55.6%
41 Wholesale trade 815 555 -260 -31.9%
44-45 Retail trade 2,260 3,170 910 40.3%
48-49 Transportation and warehousing 895 1,620 725 81.0%
51 Information and cultural industries 440 530 90 20.5%
52 Finance and insurance 1,150 1,020 -130 -11.3%
53 Real estate and rental and leasing 515 715 200 38.8%
54 Professional, scientific and technical services 1,415 1,920 505 35.7%
55 Management of companies and enterprises 20 15 -5 -25.0%
56 Administrative and support, waste
475 925 450 94.7%
management and remediation services
61 Educational services 2,080 2,205 125 6.0%
62 Health care and social assistance 5,305 6,270 965 18.2%
71 Arts, entertainment and recreation 485 700 215 44.3%
72 Accommodation and food services 1,610 2,425 815 50.6%
81 Other services (except public administration) 1,105 1,285 180 16.3%
91 Public administration 1,415 1,760 345 24.4%
It is also worth noting that employed workforce for place of of the total number of employed workers who worked in
Future Forward
work information was only available for workers who had a New Westminster at these times. These underestimates
fixed place of work (e.g., office, store, school, etc.) or worked were probably larger for industries in which a large
from home and not for workers who had no fixed workplace proportion of employed workers had no fixed workplace
location (e.g., work on different construction sites). location, such as the construction industry, the
Therefore, the numbers of employed workers who worked in transportation and warehousing industry and the
New Westminster at the time of the long-form Censuses in administrative and support, waste management and 31
2006 and 2016 shown in the data represent underestimates remediation services industry.Appendix A: Sectoral Analysis Appendix A: Sectoral Analysis
Employed workers working in New Westminster Table 2: Number of employed workers working in New Westminster and Metro Vancouver
(regardless of municipality or region of residence), by industry sector (2-digit NAICS 2012), 2016iii,iv
and Metro Vancouver, by industry, 2016
In 2016, the predominance of industry sectors for the employed workforce New Westminster Metro Vancouver Difference in percentage
that worked in New Westminster (regardless of municipality of Industry
of workers by industry,
Number % of Number New Westminster -
residence) were somewhat different from Metro Vancouver as a whole % of workers
of workers workers of workers Metro Vancouver
(Table 2). The health care and social assistance sector (23.1% in
New Westminster – 11.2% in Metro Vancouver = +11.9% difference) and
Total employed workers 27,100 100.0% 1,111,450 100.0% 0.0%
the public administration sector (6.5% in New Westminster – 4.5% in
Metro Vancouver = +2.0% difference) composed much higher proportions
of all workers who worked in New Westminster than in Metro Vancouver. 11 Agriculture, forestry,
105 0.4% 9,025 0.8% -0.4%
fishing and hunting
Conversely, the professional, scientific and technical services sector
(7.1% in New Westminster – 10.6% in Metro Vancouver = -3.6% difference), 21 Mining and oil and
20 0.1% 3,220 0.3% -0.2%
the manufacturing sector (4.1% in New Westminster – 7.1% in Metro gas extraction
Vancouver = -3.0% difference) and wholesale trade (2.0% in 22 Utilities 0 0.0% 6,255 0.6% -0.6%
New Westminster – 4.5% in Metro Vancouver = -2.5% difference) all
23 Construction 755 2.8% 42,260 3.8% -1.0%
had considerably smaller proportions of all workers who worked in
New Westminster than in Metro Vancouver. 31-33 Manufacturing 1,100 4.1% 78,570 7.1% -3.0%
The health care and social assistance sector employed one in four 41 Wholesale trade 555 2.0% 49,995 4.5% -2.5%
workers who worked in New Westminster (23.1% of employed workers 44-45 Retail trade 3,170 11.7% 136,750 12.3% -0.6%
who worked in New Westminster), followed by retail trade (11.7%),
accommodation and food services (8.9%) and educational services 48-49 Transportation
1,620 6.0% 54,830 4.9% 1.0%
and warehousing
(8.1%). Retail trade had the highest proportion of all employed workers
(12.3% of employed workers who worked in Metro Vancouver) who 51 Information and
530 2.0% 39,605 3.6% -1.6%
cultural industries
worked in Metro Vancouver, followed by health care and social assistance
(11.2%), professional, scientific and technical services (10.6%) and 52 Finance and insurance 1,020 3.8% 60,710 5.5% -1.7%
accommodation and food services (9.0%).
53 Real estate and rental
715 2.6% 30,125 2.7% 0.1%
and leasing
These employed worker statistics were calculated based on place of
work for employed workers with a usual place of work (e.g., worked in an 54 Professional, scientific
1,920 7.1% 118,240 10.6% -3.6%
office or a store) or who worked from home. Therefore, industries with and technical services
high proportions of employed workers working at no fixed workplace 55 Management of
(e.g., construction industry) would likely have been underrepresented as companies and 15 0.1% 2,990 0.3% -0.2%
enterprises
their proportion of the employed workforce working in New Westminster
and Metro Vancouver. 56 Administrative and
support, waste
925 3.4% 38,080 3.4% 0.0%
management and
remediation services
61 Educational services 2,205 8.1% 87,625 7.9% 0.3%
62 Health care and social
6,270 23.1% 124,530 11.2% 11.9%
assistance
71 Arts, entertainment
700 2.6% 25,800 2.3% 0.3%
and recreation
Future Forward
72 Accommodation and
2,425 8.9% 100,195 9.0% -0.1%
food services
81 Other services (except
1,285 4.7% 53,100 4.8% 0.0%
public administration)
33
91 Public administration 1,760 6.5% 49,550 4.5% 2.0%Appendix A: Sectoral Analysis Appendix A: Sectoral Analysis
Table 3: Number of employed workers living in New Westminster and Metro Vancouver
Employed workers living in New Westminster (regardless of municipality or region of work), industry by industry sector (2-digit NAICS 2012), 2016v,vi
and Metro Vancouver, by industry, 2016
New Westminster Metro Vancouver Difference in
Employed workers by place of residence (regardless of municipality or region
percentage of residents
of work) (Table 3) presented a different industry pattern than employed Industry Number of in each industry,
residents % of residents Number of residents % of residents New Westminster -
workers by place of work (regardless of municipality of residence). In 2016,
employed in in industry employed in industry in industry Metro Vancouver
by place of residence, the pattern of employed workers by industry was fairly industry
similar in New Westminster to Metro Vancouver, with all of the industry
Total resident
sectors falling within a similar proportion (+/- 2.0% difference) in Metro 40,405 100.0% 1,276,900 100.0% 0.0%
employed workers
Vancouver and New Westminster. This differed from the place of work
11 Agriculture,
analysis, where there were large differences in industry proportions between
forestry, fishing 170 0.4% 11,075 0.9% -0.4%
New Westminster and Metro Vancouver, especially in the health care and and hunting
social assistance sector. 21 Mining and oil and
110 0.3% 4,000 0.3% 0.0%
gas extraction
In 2016, the largest proportion of employed workers living in New Westminster
22 Utilities 325 0.8% 6,700 0.5% 0.3%
worked in health care and social assistance (11.7% of employed workers
who lived in New Westminster), followed by retail trade (10.2%), professional, 23 Construction 2,885 7.1% 93,585 7.3% -0.2%
scientific and technical services (9.7%) and educational services (7.6%). In 31-33 Manufacturing 2,495 6.2% 80,925 6.3% -0.2%
2016, the largest proportion of employed workers living in Metro Vancouver
41 Wholesale trade 1,785 4.4% 53,755 4.2% 0.2%
worked in retail trade (11.2% of employed workers who lived in Metro
Vancouver), health care and social assistance (10.5%), professional, 44-45 Retail trade 4,140 10.2% 143,140 11.2% -1.0%
scientific and technical services (10.0%) and accommodation and food 48-49 Transportation
2,260 5.6% 72,410 5.7% -0.1%
services (8.3%). and warehousing
51 Information and
1,785 4.4% 47,575 3.7% 0.7%
Unlike the industry analysis by place of work, which was only able to tabulate cultural industries
employed workers with a usual place of work and employed workers working 52 Finance and
1,810 4.5% 63,645 5.0% -0.5%
from home, the industry analysis by place of residence was based upon insurance
employed workers with a usual place of work, employed workers working 53 Real estate and
945 2.3% 34,635 2.7% -0.4%
from home, employed workers working overseas and employed workers with rental and leasing
no fixed workplace location. As a result, the number of employed workers 54 Professional,
captured by the place of residence analysis was much larger than by the scientific and 3,925 9.7% 127,865 10.0% -0.3%
technical services
place of work analysis for both New Westminster and Metro Vancouver. This
was especially notable for industry sectors with a high number of no fixed 55 Management of
companies and 105 0.3% 3,055 0.2% 0.0%
workplace jobs, such as the construction sector, the transportation and enterprises
warehousing sector, and the administrative and support, waste management 56 Administrative
and remediation services sector. and support,
waste management 2,080 5.1% 57,545 4.5% 0.6%
and remediation
services
61 Educational
3,090 7.6% 96,385 7.5% 0.1%
services
62 Health care and
4,715 11.7% 134,215 10.5% 1.2%
social assistance
71 Arts,
entertainment 835 2.1% 29,720 2.3% -0.3%
and recreation
Future Forward
72 Accommodation
2,900 7.2% 105,715 8.3% -1.1%
and food services
81 Other services
(except public 1,910 4.7% 58,435 4.6% 0.2%
administration)
91 Public
2,130 5.3% 52,515 4.1% 1.2% 35
administrationAppendix A: Sectoral Analysis Appendix A: Sectoral Analysis
Ten most common industry subsectors for Job quality of New Westminster residents’ ten most
employed workers living in New Westminster, 2011 common industry subsectors, Metro Vancouver level job quality data, 2015
Drilling into more detailed industry subsectors provided additional information into The total number of jobs for New Westminster residents Just under half of all workers in Metro Vancouver in 2015
the types of industry that New Westminster employed residents worked in. In 2011, in a particular subsector only tells part of the industry worked full time and full year (48.1% of all workers
7 out of 102 industry sub-sectors had 1,000 or more employed workers living in story; it is also important to consider the quality of the worked full time and full year) (Table 5). This fairly low
New Westminster (Table 4). Professional, scientific and technical services (3,360 jobs offered. Although measuring job quality is a proportion was likely due to several factors:
employed workers) and educational services (2,735 employed workers) had much subjective process (what makes a job a good job varies
larger numbers of employed workers who lived in New Westminster than other depending on the views of the person who is working at a. Some workers changed jobs during the year, with
industry subsectors. the job, etc.), two measures somewhat capture job quality: sometimes a month or more of time between jobs
b. Some workers experienced periods of
Table 4: Ten most common industry sub-sectors (3-digit NAICS 2007), by number 1. Percentage of workers working full time (30
unemployment during the year
of employed workers living in New Westminster (regardless of municipality of hours or more per week) and full year (49 to 52
work), by industry, 2011vii,viii weeks a year, which is inclusive of vacation time, c. Some workers may have been students for part
sick leave etc.) of the year and then worked after graduation
Number of employed 2. Median before-tax employment income for these d. Many workers worked part time
Industry
residents working in industry
full time, full year workers
Half or more of all workers in the local, municipal and
541 Professional, scientific and technical services 3,360
These indicators emphasize the monetary aspects of job regional public administration (61.6% of workers worked
quality, which are not the only job quality factors, but are full time full year), professional, scientific and technical
611 Educational services 2,735
important in a region such as Metro Vancouver with a services (55.0%), religious, grant-making, civic and
722 Food services and drinking places 1,860 high cost of living. Workers who work full time for a full professional and similar organizations (50.9%) and
year will generally work more hours than other workers, hospitals (50.0%) worked full time full year in 2015.
238 Specialty trade contractors 1,855 which typically contributes to higher incomes for these
full time, full year workers relative to workers as a whole. The median full time, full year employment income
561 Administrative and support services 1,745 Examining before-tax employment income for full time (before tax) for workers in Metro Vancouver in 2015 was
full year workers instead of just all workers allows for $54,955, with the highest incomes among the selected
621 Ambulatory health care services 1,515 more consistent comparisons of earnings based on a sub-sectors being for local, municipal and regional public
relatively similar base of time worked. administration ($78,995), hospitals ($69,529), professional,
622 Hospitals 1,340 scientific and technical services ($66,043) and
Metro Vancouver level data on job quality was used for the educational services ($64,755).
913 Local, municipal and regional public
910 ten largest industry sub-sectors for New Westminster
administration
residents, as New Westminster level data was not available.
813 Religious, grant-making, civic, and professional and
860
similar organizations
Table 5: Job quality statistics (% of workers working full time, full year and median full time, full year employment
income) for selected industry sub-sectors, Vancouver CMA, 2015 (based on 2016 Census)ix,x
445 Food and beverage stores 815
% of workers working Median full-time, full-year
Industry
full-year, full-time employment income (before-tax)
Total employed workers 48.1% $54,955
238 Specialty trade contractors 49.5% $52,401
445 Food and beverage stores 36.7% $40,004
541 Professional, scientific and technical services 55.0% $66,043
561 Administrative and support services 40.6% $39,321
Future Forward
611 Educational services 43.0% $64,755
621 Ambulatory health care services 41.9% $54,331
622 Hospitals 50.0% $69,529
722 Food services and drinking places 27.9% $26,895
813 Religious, grant-making, civic, and professional and
50.9% $58,435 37
similar organizations
913 Local, municipal and regional public administration 61.6% $78,995Appendix A: Sectoral Analysis SECTORAL ANALYSIS
Projected employment growth, by industry sector, British Columbia, 2016-2025
To this point, this sector analysis has focused on number of jobs, the health care and social
analysis of statistics from the past (2006 and assistance sector (66,000 new jobs through
2011). It is also important to investigate industry expansion), the professional services sector
prospects for the future in a sectoral analysis, to (46,800 new jobs through expansion) and the retail
see which industries will grow and which industry trade sector (42,500 new jobs through expansion)
will shrink. WorkBC produced an industry growth are expected to see the greatest growth between
job projection document for British Columbia as a 2016 and 2025 in British Columbia.
whole from 2016-2025, which projects the number
of jobs to be added through expansion. It is worth noting that these projections are for
British Columbia as a whole and not for Metro
In 2016, British Columbia had an estimated Vancouver or New Westminster. Local projects (such
2,332,100 jobs (Table 6). Between 2016 and 2025, as the expansion of the Royal Columbian Hospital)
a total of 291,900 jobs are projected to be added may lead to a stronger rate of growth in certain
through expansion, representing a job growth rate industries in New Westminster than for British
of 12.5%. The job growth will not be evenly spread Columbia as a whole during this period. Also, the
throughout industries. In general, service projections do not denote how many of the jobs
industries are expected to see much stronger created through expansion will be full time full year
growth than goods industries, which are expected jobs, which presumably will vary by industry.
to see slow growth or decline. In terms of the total
Table 6: Projected employment growth by expansion, by industry, British Columbia, 2016-2025xi,xii
Total job openings % growth rate, total job
Industry 2016 number of jobs through expansion, openings through
2016-2025 expansion, 2016-2025
All industries 2,332,100 291,900 12.5%
Agriculture and primary 70,800 2,200 3.1%
Utilities 14,400 -100 -0.7%
Construction 207,400 15,200 7.3%
Manufacturing 175,200 900 0.5%
Wholesale trade 83,200 9,400 11.3%
Retail trade 269,900 42,500 15.7%
Transportation, warehousing
138,500 10,100 7.3%
and storage
Information and culture 56,100 12,500 22.3%
Finance, insurance and real
129,800 16,400 12.6%
estate
Professional services 281,700 46,800 16.6%
Education 167,800 17,100 10.2%
Future Forward
Health and social assistance 293,400 66,000 22.5%
Arts, recreation and hospitality 241,800 38,400 15.9%
Other private services 104,400 3,200 3.1%
Government 97,700 11,400 11.7%
39Appendix A: Sectoral Analysis Appendix A: Sectoral Analysis
Sources
i Sources: 2006 data - Statistics Canada. Place of Work Status (3), Industry iv Worker by municipality of work information is based on workers who viii Employed workers were based on living in New Westminster (place of As there are 102 subsectors classified in the three-digit codes, only the top
- North American Industry Classification System (21) and Work Activity (4) worked in New Westminster (regardless of which municipality they resided residence), regardless of which municipality they worked in. Employed three-digit codes could be chosen.
for Employed Labour Force 15 Years and Over Having a Usual Place of Work in), or in the case of Metro Vancouver data, workers who worked in Metro labour force by place of residence included persons working from home,
or Working at Home, for Canada and for Provinces, Territories, Census Vancouver (regardless of which region they resided in). Workers who from a usual place of work, overseas and at no fixed location. Industries The top three-digit codes for New Westminster were based on the number
Divisions and Census Subdivisions of Work, 2006 Census - 20% Sample Data. worked in New Westminster data was only available for workers who are based on three-digit industry classifications from North American of employed workers for each code who resided in New Westminster in 2011.
worked at a usual place of work or work from home. Workers who did not Industry Classification System 2007 (NAICS 2007). For more information on
2016 data: Statistics Canada. Place of Work Status (3), Industry - North have a fixed workplace address were not included in place of work analysis NAICS 2007, please review the Statistics Canada. North American Industry xi Source: WorkBC. British Columbia 2025 Labour Market Outlook. (p.18)
American Industry Classification System 2012 (21) and Work activity from Statistics Canada. Therefore, these worker numbers were Classification System (NAICS) 2007 website:
during the reference year (4) for the Employed Labour Force 15 Years and https://www.workbc.ca/getmedia/00de3b15-0551-4f70-9e6b-
underestimates of the number of people working in New Westminster. http://www.statcan.gc.ca/eng/subjects/standard/naics/2007/index
Over Having a Usual Place of Work or Working at Home, in Private 23ffb6c9cb86/LabourMarketOutlook.aspx
Households, for Canada, Provinces, Territories, Census Divisions and These worker numbers probably especially underestimated the number of As there are 102 subsectors classified in the three-digit codes, only the top
Census Subdivisions of Work, 2016 Census - 25% Sample Data workers who work in New Westminster for the following industries (which three-digit codes could be chosen. The top three-digit codes for New xii The categories included in the WorkBC. Labour Market Outlook are similar
tend to have a lot of workers with no fixed workplace): 23 Construction, Westminster were based on the number of employed workers for each to the North American Industry Classification System 2-digit codes, but
48-49 Transportation and warehousing and 56 Administrative and support, code who resided in New Westminster. Data from 2016 for subsector with some consolidations (e.g., agriculture is mixed in with forestry and
ii Worker by municipality of work information is based on workers who
waste management and remediation services. Worker numbers by place of employment for New Westminster residents was not available, so 2011 mining). Therefore, while the NAICS 2007 2-digit codes include 20
worked in New Westminster (regardless of which municipality they resided
work information only included employed workers. Industries are based on data was used. industries (‘sectors’), WorkBC’s outlook includes 15 industries. These
in). Workers who worked in New Westminster data was only available for
two-digit industry classifications from North American Industry projections do not include whether or not these jobs will be full time or part
workers who worked at a usual place of work or work from home. Workers
Classification System 2012 (NAICS 2012). For more information on NAICS time or full year or part year.
who did not have a fixed workplace address were not included in place of ix Source: Statistics Canada. Catalogue no. 99-014-X2011044. Employment
2012, please review the Statistics Canada. North American Industry
work analysis from Statistics Canada. Therefore, these worker numbers Income Statistics in 2010 (7), Sex (3), Work Activity in 2010 (3), Highest
Classification System (NAICS) 2012 website:
were underestimates of the number of people working in New Westminster. Certificate, Diploma or Degree (6) and Industry - North American Industry
These worker numbers probably especially underestimated the number of https://www.statcan.gc.ca/eng/subjects/standard/naics/2012/index
Classification System (NAICS) 2007 (104) for the Population Aged 15 Years
workers who work in New Westminster for the following industries (which and Over in Private Households of Canada, Provinces and Territories, 2011
tend to have a lot of workers with no fixed workplace): 23 Construction, v Source: Statistics Canada. Place of Work Status (7), Industry - North National Household Survey.
48-49 Transportation and warehousing and 56 Administrative and support, American Industry Classification System 2012 (21) and Work activity
waste management and remediation services. Worker numbers by place of during the reference year (4) for the Employed Labour Force 15 Years and
work information only included employed workers. Industries are based on x Industries are based on two-digit industry classifications from North
Over, in Private Households of Canada, Provinces and Territories, Census
two-digit industry classifications from North American Industry American Industry Classification System 2012 (NAICS 2012).
Divisions and Census Subdivisions, 2016 Census - 25% Sample Data.
Classification System 2012 (NAICS 2012). For more information on NAICS
For more information on NAICS 2012, please review the Statistics Canada.
2012, please review the Statistics Canada. North American Industry
vi Employed workers were based on living in New Westminster and Metro North American Industry Classification System (NAICS) 2012 website:
Classification System (NAICS) 2012 website:
Vancouver (place of residence), regardless of which municipality they https://www.statcan.gc.ca/eng/subjects/standard/naics/2012/index
https://www.statcan.gc.ca/eng/subjects/standard/naics/2012/index
worked in, or in the case of Metro Vancouver, which region they worked in.
Employed workers by place of residence included persons working from Median, full time, full year employment income and % of jobs that are full
For more information on the 2006 Census, please visit Statistics Canada.
home, from a usual place of work, overseas and at no fixed location. year and full time were based on Metro Vancouver level data, as this data
2006 Census.
Industries are based on two-digit industry classifications from North was not available for New Westminster. “The term ‘full-year full-time
https://www12.statcan.gc.ca/census-recensement/2006/index-eng.cfm workers’ refers to persons aged 15 years and over who worked 49 to 52
American Industry Classification System 2012 (NAICS 2012). For more
information on NAICS 2012, please review the Statistics Canada. North weeks mostly full time in 2015 for pay or in self-employment.” Weeks
For more information on the 2016 Census, please visit Statistics Canada,
American Industry Classification System (NAICS) 2012 website: worked “includes weeks of paid vacation, weeks on sick leave with pay and
2016 Census.
weeks in which training was paid for by the employer.” Full-time work refers
https://www.statcan.gc.ca/eng/subjects/standard/naics/2012/index
https://www12.statcan.gc.ca/census-recensement/2016/dp-pd/ to “ whether the weeks worked during the reference year were full-time
index-eng.cfm weeks (30 hours or more per week) or not, on the basis of all jobs held.
vii Source: Statistics Canada. EO2397 Tb 16 (UID 377) CDCSD - Industry Persons with a part-time job for part of the year and a full-time job for
Future Forward
- North American Industry Classification System (NAICS) 2007 (425) and another part of the year were to report the information for the job at which
iii Source: Statistics Canada. Place of Work Status (3), Industry - North
income in 2010 (34), for the employed labour force aged 15 years and over they worked the most weeks.” For more information on work activity, please
American Industry Classification System 2012 (21) and Work activity
in private households of Canada, Provinces, Territories, Census Divisions visit Statistics Canada. Dictionary, Census of Population, 2016. Work
during the reference year (4) for the Employed Labour Force 15 Years and
and Census Subdivisions, 2011 National Household Survey activity during reference year:
Over Having a Usual Place of Work or Working at Home, in Private
Households, for Canada, Provinces, Territories, Census Divisions and http://www12.statcan.gc.ca/census-recensement/2016/ref/dict/
Census Subdivisions of Work, 2016 Census - 25% Sample Data pop224-eng.cfm
41You can also read


