Surveillance of influenza and other
respiratory viruses in the UK:
Winter 2017 to 2018
←
→
Page content transcription
If your browser does not render page correctly, please read the page content below
Surveillance of influenza and other respiratory viruses in the UK: Winter 2017 to 2018
Surveillance of influenza and other respiratory viruses in the UK: Winter 2017 to 2018

About Public Health England
Public Health England exists to protect and improve the nation’s health and wellbeing,
and reduce health inequalities. We do this through world-leading science, knowledge
and intelligence, advocacy, partnerships and the delivery of specialist public health
services. We are an executive agency of the Department of Health and Social Care,
and a distinct delivery organisation with operational autonomy. We provide government,
local government, the NHS, Parliament, industry and the public with evidence-based
professional, scientific and delivery expertise and support.

Public Health England
Wellington House
133-155 Waterloo Road
London SE1 8UG
Tel: 020 7654 8000
www.gov.uk/phe
Twitter: @PHE_uk
Facebook: www.facebook.com/PublicHealthEngland
Prepared by: Influenza Surveillance Team, Vaccines and Countermeasures Service,
National Infection Service, PHE.
For queries relating to this document, please contact: respcidsc@phe.gov.uk

© Crown copyright 2018
You may re-use this information (excluding logos) free of charge in any format or
medium, under the terms of the Open Government Licence v3.0. To view this licence,
visit OGL or email psi@nationalarchives.gsi.gov.uk. Where we have identified any third
party copyright information you will need to obtain permission from the copyright holders
concerned.

Published: May 2018
PHE publications gateway number: 2018093
                                                                PHE supports the UN
                                                                Sustainable Development Goals

                                                         2
Surveillance of influenza and other respiratory viruses in the UK: Winter 2017 to 2018
Contents
About Public Health England 2
Executive summary 4
Background 6
Observations 8
Community surveillance 8
Primary care consultations 15
Secondary care surveillance 18
Microbiological surveillance 26
Vaccination 34
Other respiratory viruses 41
Excess all-cause mortality surveillance 44
Emerging respiratory viruses 48
Conclusions 50
Acknowledgments 51
Appendix A 52
3Surveillance of influenza and other respiratory viruses in the UK: Winter 2017 to 2018 Executive summary In the 2017 to 2018 season, moderate to high levels of influenza activity were observed in the UK with co-circulation of influenza B and influenza A(H3). The impact of this co-circulation was predominantly seen in older adults, with a consistent pattern of outbreaks in care homes noted. In addition, very high impact in terms of laboratory confirmed influenza hospital and ICU/HDU admissions particularly amongst older adults were observed, although peak activity in general practice was variable (moderate in England, Scotland and Northern Ireland and high in Wales). Peak admissions rates of influenza to hospital and ICU were higher than seen in the previous 6 seasons. Levels of excess all-cause mortality were elevated particularly in the elderly, similar to the 2016 to 2017 season but were lower than in the 2014 to 2015 season in which influenza A(H3N2) also dominated, with the exception of Scotland where excesses were higher than in 2014 to 2015. The UK, as with many Northern Hemisphere countries has reported that the majority of circulating influenza A(H3N2) and B-Yamagata circulating strains were genetically and antigenically similar to the Northern Hemisphere 2017/18 A(H3N2) vaccine strains in the trivalent and quadrivalent vaccines respectively. Influenza vaccine uptake in 2017 to 2018 in England was higher than the 2016 to 2017 season across all of the target groups in particular in the 65+ year olds (72.6%) and in healthcare workers (68.7%). In 2017 to 2018, the universal childhood influenza vaccine programme with live attenuated influenza vaccine (LAIV) was again offered to all healthy 2 and 3 year olds across the UK, plus to all children of school age Reception, Year 1, 2, 3 and 4 in England and Wales, where 4 year olds were vaccinated in schools for the first time. Uptake achieved in these groups were higher than the previous season. For the pilot programme in England for the remaining children of primary school age (4 to 11 years), an overall uptake of 62.4% was achieved in the 2017 to 2018 season. In Scotland and Northern Ireland, where vaccination is offered to all primary school children, the uptake in the 2 to
Surveillance of influenza and other respiratory viruses in the UK: Winter 2017 to 2018

Surveillance and public health measures established in the UK for travellers returning
with severe respiratory disease from these regions are on-going while the risk remains.
No laboratory confirmed imported human cases of these viruses in the UK were
detected in 2017 to 2018.

                                                         5
Surveillance of influenza and other respiratory viruses in the UK: Winter 2017 to 2018
Background
Surveillance of influenza and other respiratory viruses in the United Kingdom (UK) is
undertaken throughout the year and collated by the Influenza Surveillance Team at
Public Health England’s National Infection Service (PHE NIS) on behalf of the countries
of the UK, with weekly outputs published during the winter season between October
(week 40) and May (week 20) the period when influenza typically circulates1. This is in
collaboration with teams within PHE, Health Protection Scotland2, Public Health Wales3
and the Northern Ireland Public Health Agency4, who are each responsible for
producing reports for their countries. A variety of data sources are collated to provide
information on circulating influenza strains (including antigenic and genetic
characterisation) and antiviral resistance monitoring, timing of influenza activity and to
provide rapid estimates of influenza-related burden within the community, on the health
service and in relation to excess all-cause mortality. In addition, in-season and end-of-
season monitoring of seasonal influenza vaccine uptake is undertaken.
Background information on the data sources covered in this report has been previously
described5. The Moving Epidemic Method (MEM)6 is used by the European Centre for
Disease Prevention and Control to standardise reporting of influenza activity across
Europe. It has been adopted by the UK and is publicly presented for GP influenza-like
illness (ILI) consultation rates for each UK scheme and for the proportion of samples
positive for influenza through the respiratory DataMart scheme. For the first time this
season the MEM thresholds for the UK Severe Influenza Surveillance (USISS) schemes
have been presented publicly.
During the 2017 to 2018 season, the roll-out of the licensed live attenuated influenza
vaccine (LAIV) has continued across the UK. In England, LAIV was offered to all 2 and
3 year olds through primary care and to children of school age Reception, Year 1, Year
2, Year 3 & Year 4 (4 to 9 year olds) through schools this year.
Additional influenza vaccination activity for children was also carried out with strategies
varying by country of the UK. In England, there were geographically discrete pilots
targeting children of school age Year 5 to 6. In Wales, all 4 year olds were offered LAIV
in school, whereas in Scotland and Northern Ireland, all 2 to 5 year old (not yet in
school) and all primary school age children were offered LAIV vaccination.
1
Public Health England (PHE). https://www.gov.uk/government/collections/seasonal-influenza-guidance-data-and-analysis
2
Health Protection Scotland. http://www.hps.scot.nhs.uk/resp/index.aspx
3
Public Health Wales. http://www.wales.nhs.uk/sites3/page.cfm?orgid=457&pid=34338
4
Public Health Northern Ireland. http://www.publichealth.hscni.net/directorate-public-health/health-protection/influenza
5
Health Protection Agency. Surveillance of influenza and other respiratory viruses in the UK: 2011-2012 report. Available from:
http://webarchive.nationalarchives.gov.uk/20140714084352/http://www.hpa.org.uk/webc/HPAwebFile/HPAweb_C/1317134705
939
6
Vega T, et al. Influenza surveillance in Europe: establishing epidemic thresholds by the Moving Epidemic Method. Influenza
and Other Respiratory Viruses 2012. doi: 10.1111/j.1750-2659.2012.00422.x.
6Surveillance of influenza and other respiratory viruses in the UK: Winter 2017 to 2018
PHE also carries out surveillance for novel respiratory viruses, including Middle East
Respiratory Syndrome Coronavirus (MERS-CoV) which was first recognised in
September 2012, and human infection with avian influenza such as influenza A(H7N9)
which emerged in Eastern China in 2013; influenza A(H5N1) which emerged in China in
2003 and influenza A(H5N6) which has been seen in China since 2013.
This report describes influenza activity experienced in the UK in the period from week
40 2017 (week ending 08/10/2017) to week 15 2018 (week ending 15/04/2018). This
includes observations and commentary from the childhood vaccination programme and
activity of other seasonal and novel respiratory viruses.
7Surveillance of influenza and other respiratory viruses in the UK: Winter 2017 to 2018
Observations
Community surveillance
Syndromic surveillance
In England, national PHE syndromic surveillance systems, including GP in hours and
out of hours consultations, sentinel emergency department attendances (EDSSS) and
NHS 111 calls monitor a range of indicators sensitive to community influenza activity for
example NHS 111 cold/flu calls and GP consultations for influenza-like illness (ILI)1.
Syndromic surveillance indicators for GP in hours ILI consultations, GP out of hours ILI
consultations and NHS 111 calls, all peaked in week 02 2018 at 42.5 per 100,000
population; 2.8% of consultations and 1.3% of all calls attributed to cold/flu respectively.
The trends and peaks for these systems all resemble those observed in the last notable
influenza A(H3N2) season in 2016 to 2017, however they were at higher levels.
Syndromic indicators for GP out of hours acute respiratory infections (ARI) consultations
peaked in week 52 2017 at 25.8% of consultations, this was similar to the peaks noted
in the 2016 to 2017 influenza A(H3N2) season (Figure 1).
____________________
1
Real Time Syndromic Surveillance, PHE. https://www.gov.uk/government/collections/syndromic-surveillance-systems-and-
analyses
8Surveillance of influenza and other respiratory viruses in the UK: Winter 2017 to 2018
Figure 1. Weekly all age (a) GP in hours consultations for influenza like illness (ILI) (b)
NHS 111 cold/flu calls (c) GP out of hours consultations for ILI (d) GP out of hours
consultations for acute respiratory infections (ARI) for winter 2015 to 2018, England
45.0 2015/16 3.0
a) GP In Hours ILI b) NHS 111 2015/16
GP in hours ILI consultation rate per
2016/17
NHS 111 cold/flu calls (% total)
40.0 2016/17
2017/18 2.5
35.0 2017/18
30.0 2.0
25.0
100,000
1.5
20.0
15.0 1.0
10.0
0.5
5.0
0.0 0.0
40 42 44 46 48 50 52 2 4 6 8 10 12 14 40 42 44 46 48 50 52 2 4 6 8 10 12 14
Week number Week number
2.0 2015/16 35 2015/16
GP OOH ARI consultations (% total
d) GP Out of Hours ARI
GP OOH ILI consultations (% total
c) GP Out of Hours ILI 2016/17
1.8 2016/17
30
1.6 2017/18 2017/18
ARI consultations)
25
ILI consultations)
1.4
1.2 20
1.0
15
0.8
0.6 10
0.4
5
0.2
0.0 0
40 42 44 46 48 50 52 2 4 6 8 10 12 14 40 42 44 46 48 50 52 2 4 6 8 10 12 14
Week number Week number
Syndromic indicators for sentinel emergency department attendances peaked during
week 52 2017 for ARI and pneumonia consultations. This was similar to the peaks
observed in the 2016 to 2017 and 2015 to 2016 seasons (Figure 2).
Figure 2. Weekly all age (a) EDSSS acute respiratory infection consultations and (b)
EDSSS pneumonia consultations for winter 2014 to 2018, England
14.0 2015/16 2.0 2015/16
b) EDSSS ARI a) EDSSS Pneumonia
EDSSS Pneumonia consultations (%
EDSSS ARI consultations (% total
2016/17 1.8 2016/17
12.0
2017/18 1.6 2017/18
10.0
total consultations)
1.4
consultations)
8.0 1.2
1.0
6.0 0.8
4.0 0.6
0.4
2.0
0.2
0.0 0.0
40 42 44 46 48 50 52 2 4 6 8 10 12 14 40 42 44 46 48 50 52 2 4 6 8 10 12 14
Week number Week number
9Surveillance of influenza and other respiratory viruses in the UK: Winter 2017 to 2018
In Scotland, the weekly proportion of all calls to NHS 24 which mention cold/flu, was low
and peaked in 01 2018 at 2.5% (Figure 3).
Figure 3. Proportion of calls for cold/flu (all ages) through NHS 24, Scotland, 2017 to
2018
* In October 2017, NHS24 changed over from a legacy system to a new IT system. Correlation between the data
from the new system and historical data is being undertaken but is not yet available.
In Wales, the weekly proportion of all cold/flu calls made to NHS Direct Wales peaked in
week 02 2018, similar to that of NHS 111 in England. For the majority of the 2017 to
2018 season in Wales, the proportion of cold/flu calls was higher than those observed in
the previous 2 seasons (Figure 4).
Figure 4. Weekly proportions of calls for cold/flu (all ages) to NHS-Direct, Wales, 2015 to
2018
10Surveillance of influenza and other respiratory viruses in the UK: Winter 2017 to 2018
Outbreak reporting
Between week 40 2017 and week 15 2018, a total of 2,095 acute respiratory illness
outbreaks in closed settings were reported in the UK to PHE compared to 1,114 in 2016
to 2017 and 656 in 2015 to 2016 (Table 1).
Of total outbreaks, 1,650 (78.9%) outbreaks occurred in care homes, 229 (11.0%) in
hospitals, 159 (7.6%) in schools and 52 (2.5%) in other settings. This compares to
78.5% of outbreaks occurring in care homes in 2016 to 2017, the last influenza A(H3N2)
dominated season. An increase in the other settings category was also noted, where
the majority of outbreaks were from prisons/custodial institutions (22/52, 42.3%).
The peak number of outbreaks was observed in week 03 2018 with 239 outbreaks
(70.3% in care homes) reported.
Table 1. Number and percentage of UK outbreaks by institution type, 2015 to 2018
Outbreaks
2017/18 2016/17 2015/16
Total 2,095 1,114 656
Instituition type
Care homes 1,650 875 231
Hospitals 229 162 108
Schools 159 61 275
Other 57 16 42
*Data for 2016/17 & 2015/16 is b ased on week 40 to week 20
The week of outbreak onset information was available for 1,651 (81.7%) outbreaks, for
which the peak occurred in week 01 2018 with 179 outbreaks and the majority reported
from care homes (154/179, 86.0%).
Where information on virological testing were available, the majority of outbreaks were
caused by influenza A(unknown subtype) (562/1,342; 41.9%) and influenza B
(513/1,342; 38.2%). 46 outbreaks were caused by influenza A(H3), 13 outbreaks were
caused by influenza A(H1N1)pdm09 and 126 outbreaks were caused by a range of
other non-influenza viruses including respiratory syncytial virus (RSV), rhinovirus,
human metapneumovirus (hMPV), seasonal coronavirus and parainfluenza (Figure 5).
11Surveillance of influenza and other respiratory viruses in the UK: Winter 2017 to 2018
Figure 5. Weekly number of outbreaks by (a) institution type and (b) virological test
results where available by week of reporting, 2017 to 2018 UK
a) b)
250 Care home Hospital School Other 200 Flu B/Other Flu A(H3)/Flu B
180 Other Flu A/Other*
Flu A/B Flu A(H1N1)pdm09/Flu B
200 160
Number of outbreaks
Number of outbreaks
Flu B Flu A
140 Flu A(H3) Flu A(H1N1)pdm09
150 120
100
100 80
60
50 40
20
0 0
40 42 44 46 48 50 52 02 04 06 08 10 12 14 40 42 44 46 48 50 52 02 04 06 08 10 12 14
Reporting week Week number
In England a total number of 1,832 ARI outbreaks were reported to Public Health
England between week 40 2017 and week 15 2018 compared to 1,009 in the 2016 to
2017 season. The majority of outbreaks were from care homes settings (79.7%) similar
to the previous season. Hospital outbreaks accounted for 9.1% of outbreaks; this is
slightly lower than in the 2016 to 2017 season (13.5%). School outbreaks accounted for
8.4% of all outbreaks compared to 5.9% in the 2016 to 2017. An increase in the Other
settings category of 2.8% of all outbreaks compared to 1.6% in 2016 to 2017 was also
noted. Regionally, the majority of outbreaks occurred in the South region (34.3%)
followed by the Midlands and East region (32.2%).
In Scotland, the number of ARI outbreaks reported to Health Protection Scotland (HPS)
between week 40 2017 and week 15 2018 (132) was higher than season 2016 to 2017
(78). The majority of these outbreaks were reported from care home settings (68.9%),
which was similar to the 2016 to 2017 season (69.3%). Hospital outbreaks also
accounted for a similar proportion of outbreaks observed in the 2016 to 2017 season
(28.0% in 2017 to 2018 compared to 30.7% in 2016 to 2017). School outbreaks were
also observed in 2017 to 2018 season and accounted for 2.3% of all outbreaks, this
compares to no school outbreaks observed in the 2016 to 2017 season.
In Wales, there were 88 outbreaks of ARI reported to the Public Health Wales Health
Protection teams between week 40 2017 and week 15 2018 compared to 49 during the
2016/17 season. The majority were reported from care home settings (63.6%), followed
by hospital settings (28.4%), community settings (4.5%) and school settings (3.4%).
Influenza A was laboratory confirmed in 9 of the outbreaks reported this season,
Influenza B was laboratory confirmed in 11 of the outbreaks and influenza A and B were
confirmed in 5 outbreaks.
12Surveillance of influenza and other respiratory viruses in the UK: Winter 2017 to 2018
In Northern Ireland, 43 confirmed respiratory outbreaks were reported to the Public
Health Agency, all of which were from care homes (27 influenza A(unknown subtype),
one influenza A(H3), ten influenza B, 4 RSV and one mixed infections of influenza A
and B). This compares to a total of 13 confirmed influenza outbreaks in 2016 to 2017
and 7 confirmed influenza outbreaks in 2015 to 2016.
Medical Officers of Schools Association (MOSA) and PHE scheme
The Medical Officers of Schools Association (MOSA) was founded in 1884 and involves
a network of more than 200 predominantly private and boarding schools around the
United Kingdom2,3.
Following the re-introduction of influenza A(H1N1) in 1978, which spread widely
amongst children and younger people, Public Health England (PHE) and the Medical
Officers of Schools Association (MOSA) developed a surveillance scheme to monitor
respiratory illness in children attending MOSA (a network of private and boarding
schools) schools in England. Since September 1983, the scheme has formed part of the
routine surveillance activities of PHE.
Participating MOSA schools completed a general annual online survey, including
questions on influenza vaccine policies for students, weekly surveys reporting how
many boarders developed influenza-like-illness (ILI) as well as other respiratory related
illnesses and a vaccine uptake survey by school year.
In 2017 to 2018, 21 MOSA schools agreed to participate in the scheme, including a total
of 7,575 boarders. 97.5% of boarders were from secondary schools.
Figure 6 represents the weekly ILI rates observed through the scheme this season. ILI
rates peaked in week 05 2018 at 6.3 per 1,000 boarders.
13Surveillance of influenza and other respiratory viruses in the UK: Winter 2017 to 2018
Figure 6. Weekly ILI rates per 1,000 boarders observed through participating
MOSA schools in England, 2017 to 2018
School holiday periods ILI rate
14.0
12.0
Rate per 1,000 boarders
10.0
8.0
6.0
4.0
2.0
0.0
40 42* 44* 246 48
4 50*
6 52
8 10 12 14 16 18 20
Week number
*represents weeks where not all schools will be reporting due to varying school holiday periods.
____________________
2
MOSA-PHE scheme. https://www.gov.uk/guidance/sources-of-uk-flu-data-influenza-surveillance-in-the-uk#clinical-
surveillance-through-primary-care
3
MOSA website. http://www.mosa.org.uk/
Google influenza like illness (ILI) searches (internet-based surveillance)
PHE have been collaborating with University College London (UCL) to assess the use
of internet based search queries as a surveillance method for ILI, throughout England.
This is part of work on early-warning surveillance systems for influenza, through the
EPSRC IRC project i-sense 4.
Combining natural language processing and machine learning techniques, a non-linear
Gaussian process model was developed by UCL5,6 to produce real time estimates of
ILI. The supervised model, trained on historical data from the Royal College of General
Practitioners (RCGP) scheme7 (2005/06 to 2016/17 seasons at national level),
produced daily ILI estimates based on the proportion of ILI related search queries within
a 10%-15% sample of all queries issued, which was extracted daily from Google’s
Health Trends Application Programming Interface (API).
Estimated rates of ILI started to increase in week 46, before peaking during week 02
2018 (Figure 7). This observed peak was one week earlier than that seen through the
RCGP ILI consultation data which peaked during week 03 2018.
14Surveillance of influenza and other respiratory viruses in the UK: Winter 2017 to 2018
Due to the nature of daily data and its fluctuations in estimating rates based on
searches, a 3-day moving average was applied to visualise the underlying trend.
Figure 7. Daily estimated ILI Google search query rates (and 3-day moving average)
and RCGP ILI consultation rates per 100,000 population, 2017 to 2018
60
RCGP Weekly Rate
Estimated Daily Rate
50 3-Day Moving Avg.
ILI estimated rate per 100,000
40
30
20
10
0
40 41 42 43 44 45 46 47 48 49 50 51 52 1 2 3 4 5 6 7 8 9 10 11 12 13 14 15
Week Number
*The RCGP weekly ILI rate is plotted on the Sunday of each week.
___________________
4
i.sense website. https://www.i-sense.org.uk/
5 th
Lampos V et al. Enhancing feature selection using word embeddings: the case of flu surveillance. Proceedings of the 26
International Conference on the World Wide Web, April 03-07, 2017, Perth Australia.
6
Lampos V et al. Advances in nowcasting influenza-like illness rates using search query logs. Scientific Reports. 2015 3;5.
doi:10.1038/srep12760
7
Royal College of General Practitioners Research and Surveillance Centre; www.rcgp.org.uk/clinical-and-research/our-
programmes/research-and-surveillance-centre.aspx
Primary care consultations
England
Weekly rates of General Practitioner (GP) consultations for influenza-like illness (ILI)
through the Royal College of General Practitioners (RCGP) scheme8 increased above
the Moving Epidemic Method (MEM) baseline threshold for the 2017 to 2018 season of
13.1 per 100,000 in week 51 2017, peaking in week 03 2018 at 54.1 per 100,000, the
highest peak rate seen since the 2010 to 2011 season. Rates remained at or above the
threshold for 14 weeks until week 12 2018 in England (Figure 8).
In comparison to the last influenza A(H3N2) dominated season in the 2016 to 2017
season, the peak activity was greater but occurred during similar weeks (54.1 per
100,000 in week 03 in 2017 to 2018 compared to 20.3 per 100,000 in week 02 in 2016
to 2017). The number of weeks where the ILI rate was above baseline threshold in 2017
to 2018 was the same as that observed in the 2014 to 2015 season (14 weeks vs 14
weeks), a season which was dominated by the influenza A(H3) and B strains.
15Surveillance of influenza and other respiratory viruses in the UK: Winter 2017 to 2018
By age group, activity peaked at the highest levels in the 45-64 year olds (74.4 per
100,000 in week 02 2018) and 65-74 year olds (58.4 per 100,000 in week 02 2018).
Figure 8. Weekly all age GP influenza-like illness rates for 2017 to 2018 and past
seasons, and peak rates by age group in 2017 to 2018, England (RCGP)
140
80
120
Maximum ILI rate per 100,000
70
ILI rate per 100,000
100 60
population
80 50
60 40
40 30
20
20
10
0
40424446485052 2 4 6 8 101214161820222426283032343638 0
Week numberSurveillance of influenza and other respiratory viruses in the UK: Winter 2017 to 2018
Figure 9. Weekly all age GP influenza-like illness rates for 2017 to 2018 and past
seasons, and peak rates by age group in 2017 to 2018, Scotland
500
250
450
Maximum ILI rate per 100,000
400
ILI rate per 100,000
350 200
300
population
250 150
200
150
100
100
50
50
0
40424446485052 2 4 6 8 101214161820222426283032343638
Week number 0
2017-18 2016-17 2015-16 2010-11Surveillance of influenza and other respiratory viruses in the UK: Winter 2017 to 2018
Northern Ireland
Weekly GP consultations for ILI in Northern Ireland increased above the baseline MEM
threshold of 26.6 per 100,000 in week 01 2018 and peaked in week 02 2018 at 65.2 per
100,000. This compared to a peak of 18.1 per 100,000 in week 01 in 2016 to 2017, the
last influenza A(H3N2) dominated season (Figure 11).
To note, since the beginning of the 2017 to 2018 season, the GP population coverage
for the collection of influenza/influenza-like illness data has increased from 12% in
previous seasons to 98% of the Northern Ireland population. Historical calculations of
rates and MEM thresholds have been adjusted to take this change into account.
By age group, the highest levels of activity were seen in the 45-64 year olds (89.9 per
100,000) and 65-74 year olds (76.7 per 100,000) in week 02 2018 respectively (Figure
11).
____________________
9
Public Health Agency – Northern Ireland, Influenza bulletins.
http://www.publichealth.hscni.net/publications/influenza-weekly-surveillance-bulletin-northern-ireland-201718
Figure 11. Weekly all age GP influenza-like illness rates for 2017 to 2018 and past
seasons, and peak rates by age group in 2017 to 2018, Northern Ireland
160
100
140
Maximum ILI rate per 100,000
90
ILI rate per 100,000
120 80
100 70
population
80 60
60 50
40 40
30
20
20
0
40424446485052 2 4 6 8 101214161820222426283032343638 10
Week number 0Surveillance of influenza and other respiratory viruses in the UK: Winter 2017 to 2018
the USISS sentinel hospital scheme, which is a sentinel network of acute trusts in
England who report weekly aggregate numbers on laboratory confirmed influenza
hospital admissions at all levels of care
the USISS mandatory ICU scheme, which is a national mandatory collection which
collects the weekly number of laboratory confirmed influenza cases admitted to
Intensive Care Units (ICU) and High Dependency Units (HDU) and number of
confirmed influenza deaths in ICU/HDU across the UK
For the first time in 2017 to 2018, the MEM method has been applied to the USISS
schemes (using the previous 6 seasons’ rates of admission) to calculate thresholds to
show the impact of influenza activity throughout the season10.
USISS Sentinel
Through the USISS sentinel scheme, a total of 9,996 hospitalised confirmed influenza
cases (cumulative rate of 3.59 per 100, 000 trust catchment population) were reported
from 25 participating sentinel NHS acute trusts across England from week 40 2017 to
week 15 2018. This compares to a total of 1,575 cases (cumulative rate of 0.76 per 100,
000 trust catchment population) from 22 participating trusts in 2016 to 2017 and a total
of 2,781 cases (cumulative rate 0.90 per 100,000 trust catchment population) from 26
participating trusts in 2015 to 2016. This season represents the highest number and
rate observed since the beginning of the scheme (Figure 14).
The number and rate of hospital admissions peaked in week 02 2018 (1,009
admissions, 9.4 per 100,000 trust catchment population). Amongst cases reported,
influenza B was the dominant subtype reported up to week 15 2017, with the highest
number of cases observed in the 65+ year olds (Figure 13).
This peak was higher than the 2016 to 2017 season, where the peak was in week 05
2017 with 167 admissions and a rate of 2.6 per 100,000 trust catchment population
(Figure 12).
_______________________
10
UK Severe Influenza Surveillance Schemes. https://www.gov.uk/guidance/sources-of-uk-flu-data-influenza-
surveillance-in-the-uk#disease-severity-and-mortality-data
19Surveillance of influenza and other respiratory viruses in the UK: Winter 2017 to 2018
Figure 12. Weekly number of influenza confirmed admissions to hospital through the
USISS sentinel scheme in England, with crude hospitalisation rate, week 40 2017 to
week 15 2018
Figure 13. Cumulative influenza confirmed hospital admissions by age group and
influenza type, through the USISS sentinel scheme, week 40 2017 to week 15 2018
Figure 14 represents the weekly total number of influenza confirmed hospital
admissions reported through the USISS sentinel scheme in England for the period from
2010 to 2018.
20Surveillance of influenza and other respiratory viruses in the UK: Winter 2017 to 2018
Figure 14. Weekly number of influenza confirmed hospital admissions to hospital
through the USISS sentinel scheme with crude hospitalisation rate for all ages,
2010 to 2018
USISS Mandatory
Through the USISS mandatory scheme, a total of 3,454 ICU/HDU admissions of
confirmed influenza were reported across the UK from week 40 2017 to week 15 2018,
including 372 deaths, based on combined data from England, Scotland and Northern
Ireland. In England, the total number of influenza confirmed admissions to ICU/HDU
was 3,175 (rate of 0.22 per 100, 000 population) and 320 deaths during the same
period (Figure 14).
The cumulative number of cases and deaths were higher compared to the 2016 to 2017
season (992 cases (rate of 0.06) and 112 deaths) and to the 2015 to 2016 season
(2,173 cases (rate of 0.14 per 100, 000) and 166 deaths) in England. This season
represents the highest number and rate observed since the beginning of the scheme
(Figure 18).
ICU/HDU case numbers and admission rates peaked in week 02 2018 with 299 cases
observed for that week and a rate of 0.58 per 100,000, which fell above the very high
impact threshold (Figure 15).
Of the 3,454 ICU/HDU admissions in the UK, the majority were due to influenza A
(1,806; 52.3%), with the remainder due to influenza B (1,648; 47.7%). Of the influenza A
admissions, 1,131 (62.6%) were due to A(not subtyped), 433 (24.0%) were influenza
A(H3N2) and 242 (13.4%) were reported to be influenza A(H1N1)pdm09 (Figure 15).
ICU/HDU admissions occurred in all age groups. Those aged 65+ years made up
42.0% of all cases and 32.0% of all cases were seen in the 45-64 year olds. In the
21Surveillance of influenza and other respiratory viruses in the UK: Winter 2017 to 2018
previous season which was dominated by influenza A(H3N2), the largest proportion of
admissions also occurred in those in the 65+ and 45-64 year olds (Figure 16).
Within England, regional variation in the rate of confirmed influenza admissions to
ICU/HDU was assessed using NHS England Local Team boundaries. The rate of
ICU/HDU admission ranged from 4.27 per 100,000 per trust catchment population in
South Central to 8.86 per 100,000 in Central Midlands in 2017/18 (Figure 17). Historical
regional comparisons can be found in Appendix A.
Figure 15. Weekly number of influenza confirmed admissions to ICU/HDU through the
USISS mandatory scheme in England, with crude ICU/HDU admission rate, week 40 2017
to week 15 2018
22Surveillance of influenza and other respiratory viruses in the UK: Winter 2017 to 2018
Figure 16. Cumulative ICU/HDU influenza confirmed admissions by age group and
influenza type in the UK, through the USISS mandatory scheme, week 40 2017 to week
15 2018
Figure 17. Overall rate of confirmed influenza ICU/HDU admissions through the USISS
mandatory scheme by NHS England Local Teams, England, week 40 2017 to week 15
2018
23Surveillance of influenza and other respiratory viruses in the UK: Winter 2017 to 2018
Figure 18. Weekly number of influenza confirmed ICU/HDU admissions to hospital
through the USISS mandatory scheme with crude hospitalisation rate for all ages, 2011
to 2018 (up to week 15)
In Scotland there were less laboratory confirmed cases requiring intensive care
management (ICU admissions) reported from week 40 2017 to week 15 2018 (162
admissions, rate of 3.00 per 100,000 population) compared to similar period in 2015 to
2016 (174 admissions, 3.21 per 100,000 population). The peak activity was in week 01
2018 and the majority of cases were due to influenza A(H3N2) (46.3%) and influenza B
(34.0%) with a small percentage due to influenza A(not subtyped) (11.1%) and influenza
A(H1N1)pdm09 (8.6%).
The largest number of cases was observed in the 45-64 year olds (36.4%) and 65+ year
olds (35.8%) and the lowest number of cases was seen in the 5-14 year olds (1.2%)
(Figure 19). This is similar but slightly higher than the proportion seen in the 2016 to
2017 season.
The case fatality rate (ie proportion of ICU cases which have died) of 23.5% (38/162) is
in keeping with 2016 to 2017 (25.0%, 18/72) and 2015 to 2016 (28.2%, 49/174).
24Surveillance of influenza and other respiratory viruses in the UK: Winter 2017 to 2018
Figure 19. Weekly number of laboratory confirmed influenza ICU cases with crude rate of
ICU admissions in Scotland, with crude ICU admission rate up to week 15 2018 and the
cumulative number of ICU admissions by age group and influenza type up to week 15
2018, Scotland
In Wales, 199 patients (rate of 6.4 per 100,000 resident population) in ICU were
confirmed with influenza between week 40 2017 and week 15 2018 with peak activity in
week 08 2018 (Figure 20). Influenza B accounted for 50.8% of these confirmed cases
and 34.7% were due to influenza A(H3N2). Of the patients confirmed with influenza in
ICU, 51.3% were aged 65+ years.
Figure 20. Weekly number of laboratory confirmed influenza ICU cases with crude rate of
ICU admissions in Wales and the cumulative proportion of ICU admissions by age group
up to week 15 2018, Wales
In Northern Ireland, there were 114 patients (rate of 6.1 per 100,000 resident
population) in ICU with laboratory confirmed influenza between week 40 2017 and week
15 2018, with peak activity in week 01 2018. Influenza A(H3N2) accounted for 46.5% of
these confirmed cases, influenza A(unknown subtype) accounted for 10.5% and 39.5%
were due to influenza B. The majority of cases (46.5%) were in the 65+ years age
group. 20 deaths (17.5% of ICU cases) were also reported in the ICU/HDU patients with
laboratory confirmed influenza (Figure 21).
25Surveillance of influenza and other respiratory viruses in the UK: Winter 2017 to 2018
Figure 21. Weekly number of laboratory confirmed influenza ICU cases in Northern
Ireland and the cumulative number of ICU admissions by age group and influenza type
up to week 15 2018, Northern Ireland
USISS Severe Respiratory Failures Centre (SRF)
This surveillance system collects data on every patient accepted by a SRF Centre,
whether for ExtraCorporeal Membrane Oxygenation (ECMO) or other advanced
respiratory support, and whether or not the primary cause is known to be infection-
related. There are 6 SRFs in the UK (5 in England and one in Scotland).
For the 2017 to 2018 season, of the 202 SRF admissions reported by the 6 SRFs
between week 40 2017 and week 15 2018, 60 were laboratory confirmed influenza
admissions reported to the 6 SRFs, including 27 influenza B, 13 influenza
A(H1N1)pdm09, 6 influenza A(H3N2) and 14 influenza A(unknown subtype).This
compares to a total of 5 influenza confirmed admissions in 2016 to 2017, the last
influenza A(H3N2) dominated season and a total of 73 influenza confirmed admissions
in 2015 to 2016, when influenza A(H1N1)pdm09 was dominating.
Microbiological surveillance
Respiratory DataMart, England
Influenza A and B positivity were monitored through the respiratory DataMart
surveillance scheme in England for the season of 2017 to 2018, with the overall
influenza positivity increasing above the MEM baseline threshold of 8.6% in week 49
2017. Influenza B and A(H3) were the dominant co-circulating viruses in the 2017 to
2018 season.
Overall influenza B positivity peaked at 16.7% in week 02 2018 with the highest age-
specific positivity seen in the 5-14 year olds (peak positivity of 23.3% in week 05
2018).Influenza A(H3) positivity peaked at 9.9% in week 52 2017. This peak was earlier
26Surveillance of influenza and other respiratory viruses in the UK: Winter 2017 to 2018
and lower than that seen in the 2016 to 2017 season where the peak of 25.4% was
seen in week 01 2017.The highest age-specific positivity of A(H3) was in the 65+ years
with 2 peaks of 14.5% in week 51 2017 and 14.9% in week 13 2018. Influenza
A(H1N1)pdm09 also circulated at low levels in 2017 to 2018 season which was slightly
higher than the levels observed in the 2016/2017 season.
Figure 22. Weekly number of influenza A and B detections through Respiratory
Datamart in England, with overall % positivity, 2017 to 2018
Number of influenza A detections Number of influenza B detections
% Overall positivity (2017/18) % Overall positivity (2016/17)
100.0% 1500
1400
90.0%
1300
Number of positive samples
80.0% 1200
% overall positivity
1100
70.0%
1000
60.0% 900
800
50.0%
700
40.0% 600
500
30.0%
400
20.0% 300
200
10.0%
100
0.0% 0
40 42 44 46 48 50 52 2 4 6 8 10 12 14 16 18 20
Week number
27Surveillance of influenza and other respiratory viruses in the UK: Winter 2017 to 2018
Figure 23. Weekly number of influenza detections by subtype through Respiratory Datamart in England, with overall %
positivity, 2010 to 2018
28Surveillance of influenza and other respiratory viruses in the UK: Winter 2017 to 2018
ECOSS, Scotland
In Scotland, overall influenza positivity reported through non-sentinel sources (ECOSS)
rose above the MEM baseline threshold of 5.7% in week 47 2017, and reached a peak
of 39.6% in week 52 2017. Unlike England and Wales but similar to Northern Ireland,
influenza A(H3) was the dominant circulating virus in Scotland, peaking in week 52
2017 and influenza B peaked later in week 10 2018 (Figure 24).
Figure 24. Weekly ECOSS influenza positivity (number and percentage positive) by
influenza subtype from week 40 2017 to week 15 2018, Scotland
Sentinel GP-based swabbing scheme
GP-based sentinel swabbing schemes in the UK were dominated by influenza A(H3N2)
and B in line with observations in other surveillance schemes. England and Wales was
dominated by the circulation of influenza B followed by influenza A(H3N2) whereas
Scotland and Northern Ireland was dominated by influenza A(H3N2) followed by
influenza B (Figure 25).
In England, influenza activity through the RCGP/SMN schemes increased from week 50
2017 and remained above 20.0% positivity until week 15 2018. Overall influenza
positivity peaked at 56.0% in week 11 2018 (Figure 25).
Influenza activity monitored through the GP Sentinel Scheme in Scotland peaked at
75.0% positivity in week 51 2017 with predominance of influenza A(H3N2) in weeks 48
29Surveillance of influenza and other respiratory viruses in the UK: Winter 2017 to 2018
2017 to 02 2018 (peak positivity seen in week 51 2017); and influenza B predominance
in weeks 03 to 11 2018 (peak positivity seen in week 08 2018). The overall swab
positivity for influenza increased and remained above the MEM baseline threshold of
16.7% between week 47 2017 and week 14 2018 (Figure 25).
Figure 25. Weekly number of influenza positive sentinel virology samples by influenza
type,% positive and ILI rate, 2017 to 2018, UK
*NB: Positivity supressed for Wales and Northern Ireland due to small weekly sample numbers.
In Wales, similar to England, the peak number of influenza positive specimens were
influenza B with the highest number seen in week 05 2018.
In Northern Ireland the peak was seen in week 02 2018 and was mainly due to
influenza A(H3N2) and influenza B. Influenza B was predominant from week 04 2018
onwards (Figure 25).
30Surveillance of influenza and other respiratory viruses in the UK: Winter 2017 to 2018
Virus characterisation
PHE characterises the properties of influenza viruses through one or more tests,
including genome sequencing 11 (genetic analysis) and haemagglutination inhibition 12
(HI) assays (antigenic analysis). These data are used to compare how similar the
currently circulating influenza viruses are to the strains included in seasonal influenza
vaccines, and to monitor for changes in circulating influenza viruses. The interpretation
of genetic and antigenic data sources is complex due to a number of factors, for
example, not all viruses can be cultivated in sufficient quantity for antigenic
characterisation, so that viruses with sequence information may not be able to be
antigenically characterised as well. Occasionally, this can lead to a biased view of the
properties of circulating viruses, as the viruses which can be recovered and analysed
antigenically, may not be fully representative of majority variants, and genetic
characterisation data does not always predict the antigenic characterisation
Since week 40 2017, the PHE Respiratory Virus Unit (RVU) has characterised 1,704
influenza viruses detected (Table 2). Nine hundred and one influenza B viruses have
been analysed; 896 were characterised as belonging to the B/Yamagata/16/88-lineage
and 5 belonging to the B/Victoria/2/1987-lineage. All characterised B/Yamagata/16/88-
lineage viruses to date are antigenically similar to B/Phuket/3073/2013, the influenza
B/Yamagata-lineage component of the 2017/18 Northern Hemisphere quadrivalent
vaccine. One of the B/Victoria/2/87-lineage viruses is antigenically similar to
B/Brisbane/60/2008, the influenza B/Victoria-lineage component of 2017/18 Northern
Hemisphere trivalent and quadrivalent vaccines.
Four influenza B viruses have been characterised where sequencing of the
haemagglutinin (HA) gene shows that they belong within genetic clade 1A of the
B/Victoria lineage, in a subgroup characterised by deletion of 2 amino acids in the HA.
These double deletion subgroup viruses are antigenically distinct from the 2017/18
N.hemisphere B/Victoria lineage vaccine component, with similar viruses having been
identified in a minority of influenza B/Victoria lineage viruses in the 2016/17 season in
the US and Norway, and since detected in low but increasing proportions in other
countries, including in Europe.
Genetic characterisation of 551 A(H3N2) influenza viruses detected since late summer,
showed that the majority belong to genetic subclade 3C.2a, with 142 belonging to a
cluster within this genetic subclade designated as 3C.2a1. Eighteen viruses belonging
to the genetic subclade 3C.3a were detected. The Northern Hemisphere 2017/18
influenza A(H3N2) vaccine strain A/HongKong/4801/2014 belongs in genetic subclade
3C.2a.
Of 252 A(H1N1)pdm09 influenza viruses characterised, those that have been
genetically characterised all belong in the genetic subgroup 6B.1, which was the
31Surveillance of influenza and other respiratory viruses in the UK: Winter 2017 to 2018
predominant genetic subgroup in the 2016/17 season and to date during the current
season. Viruses antigenically analysed are similar to the A/Michigan/45/2015 Northern
Hemisphere 2017/18 (H1N1)pdm09 vaccine strain.
Table 2. Viruses characterised by the PHE Reference Laboratory, from week 40 2017 to
week 15 2018
No. viruses characterised
Virus
Genetic and antigenic Genetic only Antigenic only Total
A(H1N1)pdm09 83 76 93 252
A(H3N2) 11 540 0 551
B/Yamagata-lineage 192 417 287 896
B/Victoria-lineage 4 1 0 5
Antiviral resistance
Neuraminidase inhibitor (NI) susceptibility (oseltamivir and zanamivir) is determined by
phenotypic testing of virus isolates and genotypic testing of clinical samples positive for
influenza A(H1N1)pdm09, A(H3N2), and influenza B viruses at the PHE RVU. 2
regional laboratories also perform screening for the H275Y amino acid substitution in
influenza A(H1N1)pdm09 positive clinical samples. The data summarized below
combine the results of both RVU and the 2 regional laboratories. The samples tested
are routinely obtained for surveillance purposes, but diagnostic testing of patients not
responding to NI treatment is also performed.
Since week 40 2017, 171 influenza A(H3N2) viruses have been tested for oseltamivir
susceptibility, and 147 viruses were also tested for zanamivir susceptibility. Five
A(H3N2) viruses were identified as resistant to one or both NIs; 3 viruses with the
R292K amino acid substitution, which causes resistance to both oseltamivir and
zanamivir have been detected, and 2 A(H3N2) viruses with a deletion from 244 to 248
of the neuraminidase (NA) protein causing resistance to oseltamivir but not to zanamivir
were detected. One of these viruses also had an E119V amino acid substitution in
addition to the deletion. Available information from 4 out of the 5 A(H3N2) NI resistant
cases shows that they all had one or more underlying medical conditions, and 3 of the 4
cases had a history of prior exposure to oseltamivir.
Oseltamivir susceptibility has been determined for 213 influenza A(H1N1)pdm09
viruses, with 121 also tested for zanamivir susceptibility. Six viruses with the H275Y
amino acid substitution were identified, causing oseltamivir resistance, but retaining
zanamivir susceptibility. Available information shows that 3 out of the 6 oseltamivir
resistant cases had one or more underlying medical conditions and 2 of them had a
history of prior exposure to oseltamivir.
Of the 471 influenza B viruses tested for oseltamivir susceptibility 455 viruses were also
tested for zanamivir susceptibility. All viruses were fully susceptible with one exception;
one virus had the D198N amino acid substitution causing resistance to oseltamivir and
32Surveillance of influenza and other respiratory viruses in the UK: Winter 2017 to 2018
reduced susceptibility to zanamivir. This resistant case had a history of prior exposure
to oseltamivir and some underlying medical conditions.
___________________
11
CDC genome sequencing. http://www.cdc.gov/flu/professionals/laboratory/genetic-characterization.htm
12
CDC Antigenic information. http://www.cdc.gov/flu/professionals/laboratory/antigenic.htm
33Surveillance of influenza and other respiratory viruses in the UK: Winter 2017 to 2018
Vaccination
Seasonal influenza vaccine uptake in adults
Although, all countries of the UK use standardised specifications to extract uptake data
from IT information systems in primary care, there some differences in extraction
specifications therefore comparisons should be made cautiously.
In England, the uptake of seasonal influenza vaccine is monitored by PHE throughout
the season based upon weekly and monthly extracts from GP information systems.
Cumulative uptake on influenza vaccinations administered up to 31 January 2018 was
reported from 99.8% (7,155/7,170) of GP practices in England in 2017 to 2018. This
showed a vaccine uptake of 72.6% in 65+ year-olds (compared to 70.5% in 2016 to
2017) and 48.9% for those aged 6 months to under 65 years of age with one or more
underlying clinical risk factor (excluding pregnant women without other risk factors and
carers), compared to 48.6% in 2016 to 2017 (Table 3). Uptake in pregnant women up to
31 January 2018 was 47.2%, compared to 44.9% in 2016 to 2017.The more detailed
final uptake reports are now publically available13.
In Scotland, the uptake of seasonal influenza vaccine is estimated by Health Protection
Scotland (HPS) throughout the season, also based on automated 4-weekly extracts
from 99% of all Scottish GP practices. As such, vaccine uptake reported here should be
regarded as provisional.
Cumulative uptake in 2017 to 2018 to week 15 showed vaccine uptake of 73.7% in 65+
year olds (compared to 72.8% in 2016 to 2017). Uptake amongst those aged 6 months
to under 65 year olds in one or more clinical at-risk groups (excluding pregnant women
without other risk factors and carers) was 44.8% (compared to 44.9% in 2016 to 2017).
Overall uptake in pregnant women (including those with and without other risk factors)
up to week 15 2018 was 49.4%, compared to 50.3% in 2016 to 2017. The uptake in
pregnant women (without other risk factors) was 48.1%, compared with 49.3% in 2016
to 2017. The uptake in pregnant women (with other risk factors) was 61.8%, compared
with 58.0% in 2016 to 2017.
In Wales, the uptake of seasonal influenza vaccine is monitored on a weekly basis by
Public Health Wales throughout the season based on automated weekly extracts of
Read coded data using software installed in all General Practices in Wales.
_________________
13
Vaccine Uptake – Influenza vaccine uptake reports. https://www.gov.uk/government/collections/vaccine-
uptake#seasonal-flu-vaccine-uptake:-figures
34Surveillance of influenza and other respiratory viruses in the UK: Winter 2017 to 2018
Cumulative uptake data on influenza vaccinations administered were received from
100.0% of GP practices in Wales in 2017 to 2018. This showed a vaccine uptake of
68.8% in 65+ year olds (compared to 66.7% in 2016 to 2017) and 48.5% for those aged
6 months to under 65 years of age with one or more underlying clinical risk factor
(excluding pregnant women without other risk factors, morbidly obese patients and
carers), compared to 46.9% in 2016 to 2017.
Overall uptake in pregnant women was 72.7% compared to 75.9% in 2016 to 2017.
In Wales, vaccine coverage in pregnant women is measured differently using a survey
of pregnant women giving birth each year during January. Data are also automatically
collected from general practices for women with pregnancy related Read-codes, these
data report uptakes of 61.7% in pregnant women at risk and 46.0% in healthy pregnant
women, however the validity of these data is unknown.
In Northern Ireland, the uptake of seasonal influenza vaccine is monitored by the Public
Health Agency (PHA) of Northern Ireland. Cumulative uptake of influenza vaccination
administered up to 31 March 2018 was reported from 98.8% of GP practices in NI in
2017 to 2018. In the population aged 65+ years uptake was 71.8% (compared to 71.9%
in 2016 to 2017) and in the population of under 65 years at risk the uptake was 56.0%
(compared to 57.1% in 2016 to 2017). Uptake in pregnant women up to 31 March 2018
was 56.7% compared to 58.6% in 2016 to 2017.
Uptake by frontline healthcare workers in England was 68.7% from 100% of
organisations. This has increased from 63.2% in 2016 to 2017. In Scotland, provisional
uptake figures in healthcare workers across all territorial health boards was 45.7%; this
compares with 35.3% in 2016 to 2017. In Wales, uptake reached 56.9% compared to
49.1% in 2016 to 2017. In Northern Ireland, uptake in frontline healthcare workers was
33.4% compared to 29.0% in 2016 to 2017.
Table 3 summarises uptake in adults in the UK.
35Surveillance of influenza and other respiratory viruses in the UK: Winter 2017 to 2018
Table 3. Influenza vaccine uptake in 65+ year olds, 6 months to under 65 years at risk, pregnant women and healthcare
workers, 2017 to 2018, UK
England Scotland Northern Ireland Wales
Target Group Number Number Number Number
Denominator % uptake Denominator % uptake Denominator % uptake Denominator % uptake
vaccinated vaccinated vaccinated vaccinated
65+ years 7,426,917 10,235,533 72.6 751,689 1,020,490 73.7% 220,853 307,439 71.8% 451,346 655,902 68.8%Surveillance of influenza and other respiratory viruses in the UK: Winter 2017 to 2018
Influenza vaccine (LAIV) programme for children
England
The Immform survey was used to monitor influenza vaccine uptake in 2, 3 and 4 year
olds in primary care in England. The uptake for all GP-registered 2 year olds was 42.8%
compared to 38.9% in 2016 to 2017; 44.2% compared to 41.5% in 3 year olds in 2016
to 2017 in England. This was reported from 99.6% of GP practices in England. This
season all 4 year olds were vaccinated in school delivery programmes across England.
The seasonal influenza vaccine programme for children school year reception, 1,2, 3
and 4 (4 years rising to 9 years of age) was mainly delivered via a school-based
programme, although one area delivered vaccinations through general practice.
Vaccine uptake was monitored through manual returns by local teams for their
responsible population.
An estimated 1,998,538 children in school years reception,1, 2, 3 and 4 (aged 4 rising to
9 years) in England received at least one dose of influenza vaccine during the period 1
September 2017 to 31 January 2018. With an estimated total target population of
3,360,997 the overall uptake was 59.5%. Total uptake in children in reception and
school years 1, 2, 3 and 4 was 62.2%, 61.0%, 60.4%, 57.6% and 55.8%, respectively.
Uptake by NHS region ranged from 47.8% to 70.7% with the lowest uptake reported in
London and the highest uptake reported in Wessex (Table 4). A more detailed PHE
report on influenza vaccine uptake in England in primary school age children is
publically available13.
37Surveillance of influenza and other respiratory viruses in the UK: Winter 2017 to 2018
Table 4. Estimated number and proportion of children of school years reception, 1, 2, 3
and 4 age who were vaccinated with influenza vaccine by local NHS England team from
1 September 2017 to 31 January 2018
No. of children eligible for No. of children vaccinated with at
Local NHS England team Vaccine uptake (%)
vaccination least 1 dose of influenza vaccine
North 926,318 572,104 61.8
Cumbria & North East 160,570 99,455 61.9
Lancashire 89,300 52,669 59.0
Greater Manchester 188,459 113,136 60.0
Yorkshire & Humber 343,260 214,619 62.5
Cheshire & Merseyside 144,729 92,225 63.7
Midlands & East 1,047,683 629,432 60.1
North Midlands 214,504 133,634 62.3
Central Midlands 298,343 172,032 57.7
West Midlands 276,058 157,027 56.9
East 258,778 166,739 64.4
London 534,755 255,418 47.8
London 534,755 255,418 47.8
South 852,241 541,584 63.5
South Central 224,631 150,323 69.9
South West 185,936 109,739 59.0
Wessex 155,074 109,679 70.7
South East 286,600 171,843 60.0
Total 3,360,997 1,998,538 59.5
* Data for Bassetlaw, an LA district of Nottinghamshire UA, was collected independently. Bassetlaw uptake figures are reported
under Yorkshire and Humber NHS England team.
Overall uptake for children in school years reception, 1, 2, 3 and 4 age by LA ranged
from 26.0% to 79.3%. Uptake by year group by LA ranged from 30.5% to 82.3% for
children in reception, 29.6% to 80.0% for children in school year 1, from 24.2% to 81.6%
for children in school year 2, from 22.6% to 81.6 for children in school year 3 and from
22.1% to 79.4% for children in school year 4.
The 2017 to 2018 season also saw the continuation of the primary school-age
vaccination programme in 5 pilot areas that have been piloting the programme since
2013 to 2014. Influenza vaccine was offered to all primary school age children aged 4-
11 years (school years reception to 6) through a school based delivery model.
Reception children were added to this cohort due to changes in the programme this
season.
An estimated 195,185 primary school children aged 4-11 years in 5 pilot areas received
at least one dose of influenza vaccine during the period 1 September 2017 to 31
January 2018 (Figure 26). With an estimated total target population of 312,697, this
results in an overall uptake of 62.4% (ranging by pilot site from 45.9% to 74.6%).
38Surveillance of influenza and other respiratory viruses in the UK: Winter 2017 to 2018
Figure 26. Estimated proportion of primary school age children (aged 4-11 years) who
were vaccinated with influenza vaccine by pilot area, England, 1 September 2017 to 31
January 2018
*Due to data provider issues, there is no data for Sunderland.
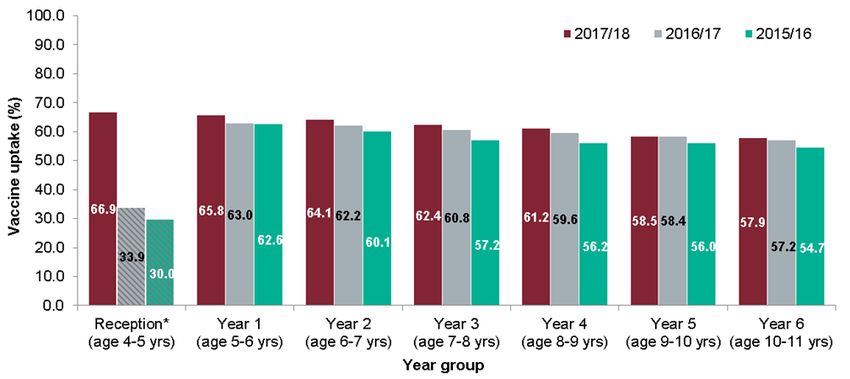
Vaccine uptake for the period 1 September 2017 to 31 January 2018 in pilot areas by
year group ranged from 66.9% in reception (aged 4 years) to 54.0% in school year 6
(aged 10 years), with an overall pattern of decreasing uptake with increasing age
(Figure 27). A 1.4% increase in vaccine uptake was observed since 2016 to 2017.
Figure 27. Estimated proportion of primary school age children (aged 4-11 years) who
were vaccinated with influenza vaccine by year group in pilot areas, England, 2015 to
2018
*Children in ages 4-5 years old were vaccinated in GP practices during the 2016/17 and 2015/16 seasons.
39Surveillance of influenza and other respiratory viruses in the UK: Winter 2017 to 2018
Scotland
The estimated uptake in preschool children (2 to under 5 year olds, not yet in school)
vaccinated in the GP setting was 56.9% in 2017 to 2018 (compared to 59.0% in 2016 to
2017).
In 2017 to 2018, the offer of influenza vaccine was made to all primary school aged
children in Scotland with an estimated 301,160 children aged 4-11 years who received
at least one dose of influenza vaccine. With an estimated total target population for the
school based programme of 412,721, this resulted in an uptake of 73.0% at the end of
the season. This is similar to the vaccine uptake achieved during the primary school
programme in 2016 to 2017 (299,450 children vaccinated out of a target population of
410,337, resulting in an 73.0% uptake). These uptake figures are based on aggregate
school level data collated in season and are likely to be an underestimate, as the
estimated uptake from some NHS boards does not include data from additional children
vaccinated in general practice.
Reported uptake of the primary school programme varied by NHS board (Figure 28).
Figure 28. Mean influenza vaccine uptake (%) by NHS board, with confidence intervals
[CI] for the primary schools in 2017 to 2018 to week 15 2018, compared to the previous 4
seasons
* *For the majority of NHS health board, the uptake includes data obtained from general practices on the number of children vaccinated in
schools.
**NHS Health boards include: Ayrshire & Arran (AA), Borders (BR), Dumfries & Galloway (DG), Fife (FF), Forth Valley (FV), Greater Glasgow &
Clyde (GGC), Grampian (GR), Highland (HG), Lanarkshire (LN), Lothian (LO), Orkney (OR), Shetland (SH), Tayside (TY), Western Isles (WI).
40You can also read