Changes in Seasonal Respiratory Illnesses in the United States During the Coronavirus Disease 2019 (COVID-19) Pandemic
←
→
Page content transcription
If your browser does not render page correctly, please read the page content below

Clinical Infectious Diseases
 Supplement Article

Changes in Seasonal Respiratory Illnesses in the United
States During the Coronavirus Disease 2019 (COVID-19)
Pandemic
Loren Rodgers,1,2 Michael Sheppard,1 Amanda Smith,1,3 Stephanie Dietz,1 Praveena Jayanthi,1,4 Yan Yuan,1 Lara Bull,1 Samantha Wotiz,1,5
Tessa Schwarze,6,7 Roseric Azondekon,1 Kathleen Hartnett,1,2 Jennifer Adjemian,1,2 Hannah L. Kirking,2,8 and Aaron Kite-Powell1

 Downloaded from https://academic.oup.com/cid/article/73/Supplement_1/S110/6257582 by guest on 14 November 2021
1
 Division of Health Informatics and Surveillance, Center for Surveillance, Epidemiology, and Laboratory Services, Centers for Disease Control and Prevention, Atlanta, Georgia, USA; 2US Public
Health Service Commissioned Corps, Rockville, Maryland, USA; 3Epidemic Intelligence Service assigned to Center for Surveillance, Epidemiology, and Laboratory Services, Centers for Disease
Control and Prevention, Atlanta, Georgia, USA; 4ICF International, Inc, Atlanta, Georgia, USA; 5Deloitte, Atlanta, Georgia, USA; 6Office of Safety, Security, and Asset Management, Centers
for Disease Control and Prevention, Atlanta, Georgia, USA; 7Chenega Enterprise Systems and Solutions, LLC, Chesapeake, Virginia, USA; and 8Division of Viral Diseases, National Center for
Immunization and Respiratory Diseases, Centers for Disease Control and Prevention, Atlanta, Georgia, USA

 Background. Respiratory tract infections are common, often seasonal, and caused by multiple pathogens. We assessed whether
seasonal respiratory illness patterns changed during the COVID-19 pandemic.
 Methods. We categorized emergency department (ED) visits reported to the National Syndromic Surveillance Program ac-
cording to chief complaints and diagnosis codes, excluding visits with diagnosed SARS-CoV-2 infections. For each week during
1 March 2020 through 26 December 2020 (“pandemic period”), we compared the proportion of ED visits in each respiratory cat-
egory with the proportion of visits in that category during the corresponding weeks of 2017–2019 (“pre–pandemic period”). We
analyzed positivity of respiratory viral tests from 2 independent clinical laboratories.
 Results. During March 2020, cough, shortness of breath, and influenza-like illness accounted for twice as many ED visits com-
pared with the pre–pandemic period. During the last 4 months of 2020, all respiratory conditions, except shortness of breath, ac-
counted for a smaller proportion of ED visits than during the pre–pandemic period. Percent positivity for influenza virus, respiratory
syncytial virus, human parainfluenza virus, adenoviruses, and human metapneumovirus was lower in 2020 than 2019. Although test
volume decreased, percent positivity was higher for rhinovirus/enterovirus during the final weeks of 2020 compared with 2019, with
ED visits similar to the pre–pandemic period.
 Conclusions. Broad reductions in respiratory test positivity and respiratory ED visits (excluding COVID-19) occurred during
2020. Interventions for mitigating spread of SARS-CoV-2 likely also reduced transmission of other pathogens. Timely surveillance is
needed to understand community health threats, particularly when current trends deviate from seasonal norms.
 Keywords. COVID-19; syndromic; respiratory; emergency department visits; laboratory.

Respiratory illnesses occur frequently, and most persons in the the United States was 465 per 100 000 population, with 7.4% of
United States experience at least 1 acute upper respiratory tract these patients dying in the hospital [4]. Globally, community-
infection (URI) annually [1]. Upper respiratory tract symp- acquired pneumonia is estimated to account for 15% of deaths
toms include sore throat, sneezing, rhinorrhea, nasal conges- in children younger than 5 years of age in 2007 [5], and in the
tion, sinus pain, cough, headache, myalgia, loss of appetite, United States, bronchiolitis is the most common cause of hospi-
chills, and fever [2]. Whereas URIs occur from the nasal cavity talizations among infants younger than 1 year old [6].
through the larynx, lower respiratory tract infections (LRTIs) More than 200 viruses can cause respiratory infections [1, 2,
occur below the larynx and include pneumonia, bronchitis, and 7]. Rhinoviruses are the most frequent cause of the common
bronchiolitis. Lower respiratory tract infections are responsible cold, responsible for 30% to 70% of all respiratory infections [2,
for a sizable proportion of emergency department (ED) visits 7]. Endemic human coronaviruses are common causes of res-
and hospitalizations [3]. During 2001–2004, the average an- piratory illnesses in adults and are reported to have caused 7%
nual age-adjusted pneumonia-associated hospitalization rate in to 18% of common colds prior to the novel coronavirus disease
 2019 (COVID-19) pandemic [8, 9]. Other common causes of
 respiratory illness include respiratory syncytial virus (RSV)
 types A and B, human parainfluenza virus (HPIV) types 1–4,
 Correspondence: L. Rodgers, Centers for Disease Control and Prevention, 1600 Clifton Rd NE,
MS V25-3, Atlanta, GA 30329 (lrodgers@cdc.gov).
 adenoviruses, human metapneumovirus (HMPV), and influ-
Clinical Infectious Diseases®  2021;73(S1):S110–7 enza viruses A and B.
Published by Oxford University Press for the Infectious Diseases Society of America 2021. This Most but not all viral respiratory pathogens exhibit sea-
work is written by (a) US Government employee(s) and is in the public domain in the US.
DOI: 10.1093/cid/ciab311
 sonal prevalence patterns [8–10]. Influenza, RSV, and human

S110 • cid 2021:73 (Suppl 1) • Rodgers et al
coronaviruses typically have peak incidence in the winter; results for 2 530 315 viral respiratory specimen test results
rhinoviruses usually have peak incidence in spring and fall; and during 24 March 2019 through 31 December 2020. Data from
enteroviruses generally have peak incidence in the summer. tests conducted by Laboratories A and B prior to 24 March 2019
Seasonality of respiratory viral infections is likely affected by were not available for this study.
multiple factors, including age-dependent human behavioral Counts of COVID-19 cases were obtained from the CDC’s
changes (eg, school calendars and, to a limited degree, spending COVID-19 Case Surveillance Public Use Dataset [19].
time indoors during colder months) [8, 9, 11–13], meteorologic
factors (eg, humidity and temperature) [10], and climactic in- Classifying Emergency Department Visits
fluences on host resistance (eg, sun exposure and related vi- Emergency department visit records were classified into one
tamin D levels) [9, 14]. The COVID-19 pandemic globally or multiple categories based on text in chief complaints and
changed typical patterns of influenza illness. While severe acute International Classification of Diseases, 10th revision, Clinical
 Modification (ICD-10-CM), codes reported in discharge di-

 Downloaded from https://academic.oup.com/cid/article/73/Supplement_1/S110/6257582 by guest on 14 November 2021
respiratory syndrome coronavirus 2 (SARS-CoV-2) infections
exhibited explosive growth in 2020, influenza activity in 2020 agnosis fields. To categorize respiratory infections based on
fell below historical seasonal norms [15], and ED visits were less chief complaints, we included the categories “upper respira-
frequent than in prior years, with fewer patients presenting with tory tract infection” and “lower respiratory tract infection.”
influenza or acute bronchitis [16]. We examined symptoms and Additionally, the following chief complaint categories were the
diagnoses among ED patients as well as changes in independent most frequent among respiratory-related ED visits in 2019 and
clinical laboratory respiratory viral test results in order to eval- were thus also included in this analysis: “cough,” “influenza-
uate whether typical seasonal respiratory pathogen activity (ex- like illness,” “shortness of breath,” “sore throat,” and “fever or
cluding SARS-CoV-2) changed during the pandemic. chills.” We utilized a keyword weighting approach to categorize
 respiratory-related ED visits by defining terms and ICD-10-CM
 codes, which resulted in records being included or excluded in
METHODS
 each clinical categorization (Supplementary Tables 2 and 3)
Data Sources [20, 21]. Chief complaint narratives for each visit record were
De-identified ED records were obtained from the National scored based on a weighted keyword algorithm, with positive
Syndromic Surveillance Program (NSSP), a collaboration or negative values assigned for the presence of each keyword.
among the Centers for Disease Control and Prevention (CDC), Chief complaints with a score of 6 or greater were classified into
state and local health departments, and private-sector health the indicated category, and visits could be classified into more
partners. Nonfederal EDs in 49 states (excluding Hawaii) than 1 category. Abbreviations frequently used in medical re-
participate in NSSP, constituting 70% of ED facilities in the cords were included in the keyword-matching algorithm [20,
United States as of December 2020 [17]. This study included 21]. Pathogen-specific discharge diagnosis–based categories
332 042 585 ED visits occurring during the study period of were defined based on reported ICD-10-CM codes for “influ-
weeks 10 through 52 of each year from 2017 through 2020. This enza,” “adenovirus,” “human parainfluenza virus,” “rhinovirus,”
corresponds to 5 March through 30 December of 2017, 4 March “human metapneumovirus,” and “respiratory syncytial virus.”
through 29 December of 2018, 3 March through 28 December In order to focus analyses on illnesses due to pathogens other
of 2019, and 10 March through 26 December of 2020. than SARS-CoV-2, ED records that included a diagnosis of
 Laboratory tests results were obtained from Laboratory COVID-19 were excluded from chief-complaint and discharge
A and Laboratory B, which are 2 large independent clin- diagnosis–based categories. These were defined as any ED visits
ical laboratories with testing locations throughout the United with discharge diagnoses that include ICD-10-CM codes U07.1
States. These laboratory companies require testing locations or J12.82 or Systematized Nomenclature of Medicine clinical
under their contract to have and maintain a certificate under terms 840539006, 840544004, or 840533007.
the Clinical Laboratory Improvement Amendments of 1988. We analyzed data for weeks 10 through 52 of each year from
Laboratories A and B receive clinical specimens for diagnostic 2017 through 2020. For each week during 5 March 2017–
testing from patients in every US state. The CDC receives all di- 26 December 2020, we calculated the proportion of ED visits
agnostic test results conducted by Laboratories A and B for the in each respiratory category as the number of visits in the res-
respiratory pathogens included in this study (Supplementary piratory category ( ) divided by the total number of ED visits
Table 1). Laboratory A submits order and result records to occurring that week ( ). For each week during 1 March 2020
NSSP every 10 minutes, including results from all states for any through 26 December 2020, we calculated a prevalence ratio
condition that is reportable in any state. Laboratory B reports (PR) for each respiratory category as the proportion of ED visits
weekly findings for selected tests to CDC’s Data Hub, including in each respiratory category divided by the proportion of visits
nucleic acid amplification tests and antigen tests for respiratory in that category during the corresponding weeks of 2017–2019,
pathogens [18]. Collectively, Laboratories A and B reported as follows:

 Changes in Respiratory Illnesses • cid 2021:73 (Suppl 1) • S111
CFR part 46; 21 CFR part 56; 42 USC §241(d), 5 USC §552a, 44
 ÄV ä
 during week N, 2020
 rc
 USC §3501 et seq].
PR = Ä V during week N, 2017+VVall during
 during week N, 2020
 week N, 2018+Vrc during week N, 2019
 ä
 rc rc
 Vall during week N, 2017+ Vall during week N, 2018+Vall during week N, 2019
 RESULTS
As such, PR values greater than 1 for a given respiratory cate- Respiratory-Related Emergency Department Visits
gory indicate that the proportion of visits during 2020 for that We identified 77 317 484 ED visits occurring during 1 March
category was greater during 2020 than the proportion for the 2020 through 26 December of 2020 (weeks 10 through 52
same week during the 3 prior years. We directly calculated 95% of 2020, the “pandemic period”) and 252 826 677 ED visits
confidence intervals (CIs) for PRs by exponentiating interval occurring during weeks 10 through 52 of 2017, 2018, and 2019
endpoints formed from standard error approximations of the (the “pre–pandemic period”). Among the ED visits occurring
logarithm of PRs. All analyses were conducted using R software, during weeks 10 through 52 of 2020, 1 782 463 (2.3%) included

 Downloaded from https://academic.oup.com/cid/article/73/Supplement_1/S110/6257582 by guest on 14 November 2021
version 4.0.3 (R Foundation for Statistical Computing). a diagnosis of COVID-19 and were excluded from respira-
 tory classifications (ie, URI, LRTI, sore throat, fever or chills,
Classifying Laboratory Findings influenza-like illness, cough, and shortness of breath).
Laboratory results for each clinical specimen were classified During the pandemic period, 0.40% of visits were classified
into pathogen-specific groups based on Logical Observation as URI, compared with 0.71% during the corresponding weeks
Identifiers Names and Codes (LOINC) clinical terminology of the pre–pandemic period (PR = .56; 95% CI = .56–.57)
and test result description strings (Supplementary Table 1) [22]. (Table 1). Relative decreases were also observed for visits clas-
All influenza A and B viruses were included in the influenza test sified as LRTI (PR = .51; 95% CI = .51–.52) and sore throat
category. Respiratory panel polymerase chain reaction (PCR) (PR = .91; 95% CI = .91–.91). In contrast, the percentage of
tests do not differentiate between human enterovirus and rhi- visits with influenza-like illness (PR = 1.06; 95% CI = 1.06–
novirus, and these were included in rhinovirus results. Counts 1.07), cough (PR = 1.08; 95% CI = 1.07–1.08), and shortness
of tests and denominator for positivity assessments included all of breath (PR = 1.52; 95% CI = 1.51–1.52) was higher during
tests with positive or negative results for each pathogen. This the pandemic period than in the pre–pandemic period. Visits
analysis included nucleic acid amplification tests and antigen with fever or chills were similarly prevalent when comparing
tests, and excluded all inconclusive results, antibody tests, and the 2 time periods (PR = 1.00; 95% CI = 1.00–1.00).
tests with nonrespiratory specimen sources. We used Pearson The PRs of respiratory-related visits varied throughout the
chi-square tests of independence to compare count differences pandemic period. During early March through mid-April of
across time. 2020, more than twice as many ED visits (PR >2.00) included
 chief complaints for cough, influenza-like illness, or short-
Human Subjects Review ness of breath, compared with the corresponding weeks during
This activity was reviewed by the CDC and was conducted con- the pre–pandemic period. Emergency department visits with
sistent with applicable federal law and CDC policy [see, eg, 45 influenza-like illness peaked during 8 March through 4 April

Table 1. Respiratory-Related Chief Complaints Among Emergency Department Visits as a Percentage of all Emergency Department Visits in the
United States

 Number of ED Percentage of ED Number of ED Percentage of Prevalence Ratio (Lower
Chief Complaint Visits 2017–2019a Visits 2017–2019b Visits 2020c ED Visits 2020d Bound–Upper Bound)

Upper respiratory 1 784 957 0.71 308 306 0.40 .56 (.56–.57)
 tract infection
Lower respiratory 693 970 0.27 109 220 0.14 .51 (.51–.52)
 tract infection
Sore throat 5 007 299 1.98 1 395 015 1.80 .91 (.91–.91)
Fever or chills 11 945 572 4.72 3 663 636 4.74 1.00 (1.00–1.00)
Influenza-like illness 3 913 802 1.55 1 274 296 1.65 1.06 (1.06–1.07)
Cough 9 101 699 3.60 2 992 737 3.87 1.08 (1.07–1.08)
Shortness of breath 9 919 140 3.92 4 593 376 5.94 1.51 (1.51–1.52)
Abbreviation: ED, emergency department.
a
 Includes ED visits occurring during 5 March through 30 December of 2017, 4 March through 29 December of 2018, and 3 March through 28 December of 2019, which corresponds to weeks
10 through 52 of each year.
b
 Denominator for each percentage is 252 826 677 ED visits occurring during 5 March through 30 December of 2017, 4 March through 29 December of 2018, and 3 March through
28 December of 2019, which corresponds to weeks 10 through 52 of 2017, 2018, and 2019.
c
 Includes ED visits occurring during 1 March 2020 through 26 December of 2020, which corresponds to weeks 10 through 52 of 2020.
d
 Denominator for each percentage is 77 317 484 ED visits occurring during 1 March 2020 through 26 December of 2020, which corresponds to weeks 10 through 52 of 2020.

S112 • cid 2021:73 (Suppl 1) • Rodgers et al
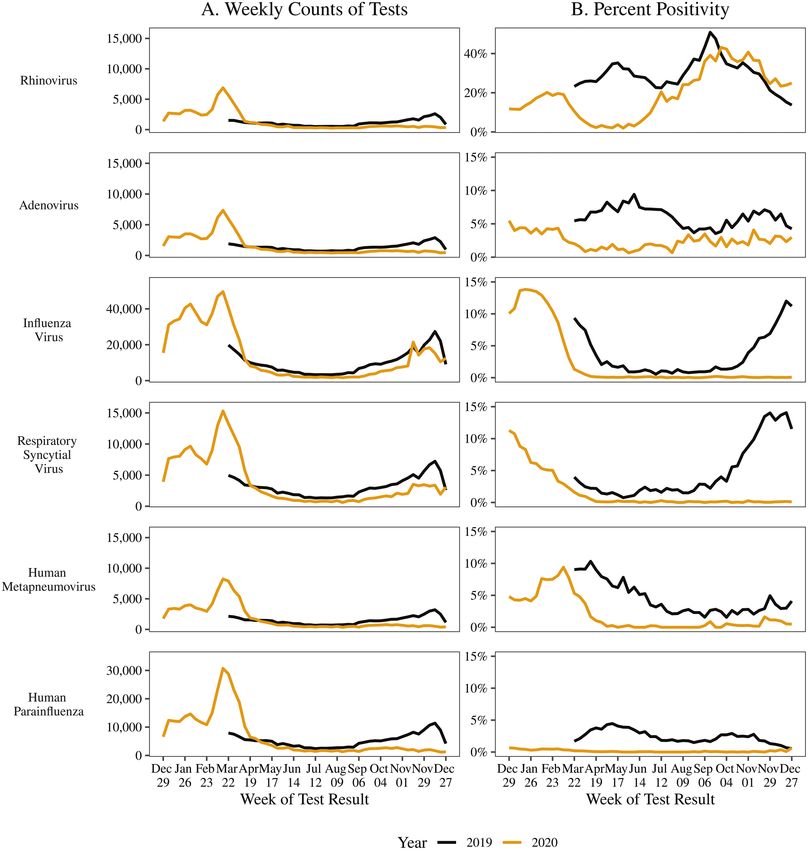
2020 (PR = 2.35; 95% CI = 2.34–2.36), cough peaked during Independent Clinical Laboratory Testing
15 March through 4 April 2020 (PR = 2.71; 95% CI = 2.71–2.72), During the first 5 weeks of 2020, 290 134 tests for respiratory
and shortness of breath peaked during 22 March through 18 viral pathogens were administered, and during the 5 weeks of 8
April 2020 (PR = 2.37; 95% CI = 2.36–2.38) (Figure 1A). By March–11 April 2020, 464 267 tests were administered, an in-
the week beginning 10 May 2020, the percentage of ED visits crease of 60.0% (Figure 3). During the first 5 weeks of 2020,
for non–COVID-19 respiratory-related ED visits was below 74.4% of respiratory tests were multi-pathogen panels, and
levels observed during the pre–pandemic period (PR 5.00) (Figure 1B), although the number of viral 26 December 2020 (the last full week of 2020), 33.9% of rhi-
tests performed for ED patients was not available. Relative novirus tests (n = 6891) were positive compared with 26.3%
to the pre–pandemic period, identification of adenovirus (n = 21 306) during the corresponding weeks of 2019 (χ 2 = 79.2,
among ED patients peaked during 8 March through 28 P < .01).
March 2020. Identification of HMPV and rhinovirus peaked
 DISCUSSION
during 15 March through 21 March 2020 (PR = 5.73 [95%
CI = 5.11–6.41] and PR = 5.37 [95% CI = 4.37–5.37], respec- Emergency department and laboratory data suggest that sea-
tively). From 23 August 2020 through the end of 2020, the sonal patterns of respiratory illness activity were profoundly
percentage of ED visits with HMPV, HPIV, influenza, and disrupted throughout 2020 compared with earlier years. The
RSV was consistently lower than during the latter half of the incidence of SARS-CoV-2 has been well documented else-
pre–pandemic years (PR
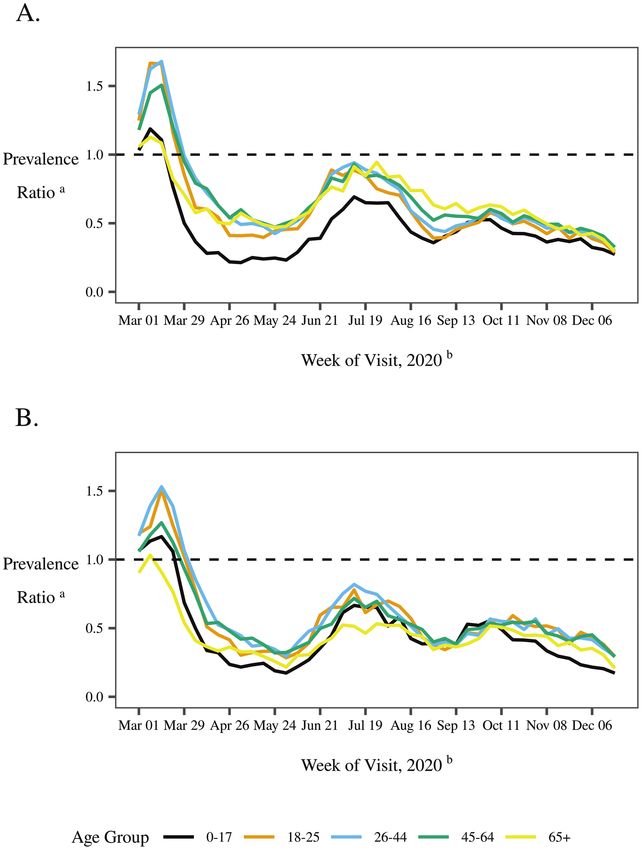
Downloaded from https://academic.oup.com/cid/article/73/Supplement_1/S110/6257582 by guest on 14 November 2021

Figure 1. Relative prevalencea of respiratory-related chief complaints (A) and discharge diagnoses (B) among ED visits in the United States, excluding patients with diagnosed
COVID-19 by week.b C, Reported active cases of COVID-19c are displayed for comparison. aFor each week during 5 March 2017 through 26 December 2020 we calculated the
proportion of ED visits in each respiratory category as the number of visits in the respiratory category divided by the total number of ED visits occurring that week. For each of these
weeks, we calculated a prevalence ratio for each respiratory category as the proportion of ED visits in each respiratory category divided by the proportion of visits in that category
during the corresponding weeks of 2017 through 2019. As such, prevalence ratio values >1 indicate that the proportion of visits during 2020 for that category was greater during 2020
than the proportion for the same week during the 3 prior years. For reference, the dashed line indicates prevalence ratio = 1. bIndicates the date the patient initiated an ED visit, by
week, with the week start date for 2020 shown. cSource: COVID Data Tracker. Available at: https://covid.cdc.gov/covid-data-tracker/. Abbreviations: COVID-19, coronavirus disease
2019; ED, emergency department; ILI, influenza-like illness; LRTI, lower respiratory tract infection; RSV, respiratory syncytial virus; URI, upper respiratory tract infection.

S114 • cid 2021:73 (Suppl 1) • Rodgers et al
measures that were implemented did not prevent rhinovirus
 transmission in schools [25]. In addition, rhinovirus might be
 less susceptible to source-control methods, such as face cover-
 ings. One study found that surgical masks that reduced emis-
 sion of influenza virus and coronavirus in respiratory droplets
 did not reduce detection of rhinoviruses in droplets or aerosols
 [26].
 Co-circulation of respiratory pathogens can be affected by
 population dynamics at the host and population level as vir-
 uses and other pathogens compete for shared niches. It is pos-
 sible that some of the changes in respiratory illness activity

 Downloaded from https://academic.oup.com/cid/article/73/Supplement_1/S110/6257582 by guest on 14 November 2021
 documented in our findings are affected by disruptions to typ-
 ical virus–virus seasonal circulation patterns, and the reduc-
 tion in influenza circulation could itself affect the prevalence
 of other viruses. Nickbakhsh et al [27] demonstrated negative
 interactions between influenza A viruses and rhinovirus at the
 population and host level. Rhinovirus circulation is proposed to
 have delayed introduction of influenza A (H1N1) 2009 virus in
 France during 2009 [28, 29]. These reports are consistent with
 our observation of decreased influenza detection through 2020,
 but the impacts of viral interference and COVID-19 mitigation
 measures on the findings presented in this report are uncertain.
 Our findings should be interpreted in the context of several
 limitations. Prevalence ratios of respiratory-related ED visits
 facilitate comparison between time periods. However, this has
Figure 2. Prevalencea of upper respiratory tract infections (A) and lower respira-
 the potential to introduce bias from differences in comparison
tory tract infections (B) among ED visits: 2020 compared with 2017–2019 by week
of visit.b aFor each week during 5 March 2017–26 December 2020 we calculated the groups. We attempted to exclude patients with SARS-CoV-2
proportion of ED visits in each respiratory category as the number of visits in the infection from ED visit analyses in order to highlight changes
respiratory category divided by the total number of ED visits occurring that week. in respiratory activity from pathogens prevalent in the pre–
For each week during 1 March 2020 through 26 December 2020, we calculated a
prevalence ratio for each respiratory category as the proportion of ED visits in each pandemic period. We excluded visits with diagnostic codes
respiratory category divided by the proportion of visits in that category during the specific to COVID-19, which were introduced on 1 April 2020
corresponding weeks of 2017–2019. As such, prevalence ratio values >1 indicate [30]; however, it is likely that many ED patients with COVID-
that the proportion of visits during 2020 for that category was greater during 2020
than the proportion for the same week during the 3 prior years. For reference, the
 19 did not receive these diagnosis codes, particularly early in
dashed line indicates prevalence ratio = 1. bIndicates the date the patient initiated the pandemic when SARS-CoV-2 testing capacity was reduced.
an ED visit, by week, with the week start date for 2020 shown. Abbreviation: ED, The PRs in ED visits for respiratory conditions exhibit peaks
emergency department.
 in March–April of 2020 and June–July of 2020, which is sim-
 ilar to the timing of peaks in reported COVID-19 cases (Figure
 Widespread interventions intended to reduce COVID-19 1A, 1C), which would be expected if some patients with SARS-
likely contributed to the reduced spread of a broad array of res- CoV-2 infections did not receive COVID-19 diagnostic codes,
piratory pathogens, with the possible exception of rhinovirus particularly early in the pandemic. This could contribute to el-
transmissions in late 2020. Social distancing reduces opportun- evated PRs for ED visits with shortness of breath in 2020, and
ities for person-to-person transmission, and face coverings that our findings likely underestimate actual decreases in ED visits
inhibit exhaled secretions create a barrier suppressing diverse for non–COVID-19 respiratory visits.
respiratory pathogens. However, not all respiratory viruses are Ascertainment bias might influence these results, particu-
equally controlled by these measures, and some, such as adeno- larly regarding viral testing in EDs (Figure 1B). Diagnoses of
virus, can remain infectious on surfaces longer than other vir- specific respiratory pathogens among ED patients are incom-
uses. Rhinovirus can be transmitted by aerosol, direct contact, plete, since viral tests are not performed for every patient with
or by touching contaminated environmental objects [23, 24]. In respiratory illness and negative results are not documented in
the United Kingdom, rhinovirus positivity declined following diagnosis codes. Testing protocols vary between facilities and
a national lockdown in late March of 2020 but rose sharply likely change over time. We note a substantial peak in identi-
following reopening of state primary and secondary schools fication of vital respiratory pathogens in EDs in March of 2020
in early September 2020, suggesting that the social-distancing (Figure 1B), and while the number of viral tests performed in

 Changes in Respiratory Illnesses • cid 2021:73 (Suppl 1) • S115
Downloaded from https://academic.oup.com/cid/article/73/Supplement_1/S110/6257582 by guest on 14 November 2021
Figure 3. Respiratory specimen test counts (A) and positivity (B) from 2 independent clinical laboratories in the United States—24 March 2019 through 26 December 2020.

EDs is not available, the number of tests performed in inde- Clinical laboratory testing was limited to common respiratory
pendent clinical laboratories displays a substantial increase in viral pathogens. Bacterial infections causing both URIs and LRTIs
testing, but not positivity, during this time period (Figure 3), were not considered in these analyses. Test volume for common
which suggests that increased awareness of COVID-19, simul- respiratory viral pathogens was lower in late 2020 than in 2019
taneous with limited availability of tests for SARS-CoV-2, led (with the exception of tests for influenza virus for 2 weeks), and
to increased testing for multiple respiratory pathogens in this changes in testing patterns could have influenced test positivity.
time period. Increased identification of viral pathogens among A notable exception to this occurred during late March of 2020,
ED patients during March of 2020 is therefore likely to be a when respiratory testing was 5 times more frequent than in 2019
consequence of increased testing rather than increased viral (Figure 3). During this time period, the importance of identifying
prevalence. COVID-19 cases was increasing and SARS-CoV-2 assays were

S116 • cid 2021:73 (Suppl 1) • Rodgers et al
not universally available; an increased volume of tests for other 3. Wiese AD, Grijalva CG, Zhu Y, Mitchel EF Jr, Griffin MR. Changes in childhood
 pneumonia hospitalizations by race and sex associated with pneumococcal con-
respiratory pathogens could reflect attempts to rule out other res- jugate vaccines. Emerg Infect Dis 2016; 22:1109–12.
piratory pathogens. Although the volume of testing performed in 4. Hayes BH, Haberling DL, Kennedy JL, Varma JK, Fry AM, Vora NM. Burden
 of pneumonia-associated hospitalizations: United States, 2001–2014. Chest 2018;
EDs was not known, if heightened vigilance led to increased ED 153:427–37.
testing for respiratory pathogens in March 2020, this could have 5. World Health Organization. Penumonia. Available at: https://www.who.int/news-
 room/fact-sheets/detail/pneumonia. Accessed 23 May 2021.
driven increases in the number of ED patients diagnosed with
 6. Florin TA, Plint AC, Zorc JJ. Viral bronchiolitis. Lancet 2017; 389:211–24.
seasonal respiratory pathogens in this time period (Figure 1B). 7. Ruohola A, Waris M, Allander T, Ziegler T, Heikkinen T, Ruuskanen O.
Because positivity rates in independent clinical tests did not like- Viral etiology of common cold in children, Finland. Emerg Infect Dis 2009;
 15:344–6.
wise increase during this period, increases in the identification 8. Heikkinen T, Järvinen A. The common cold. Lancet 2003; 361:51–9.
of ED patients with “seasonal” respiratory pathogens are likely 9. Fisman D. Seasonality of viral infections: mechanisms and unknowns. Clin
 Microbiol Infect 2012; 18:946–54.
an artifact of changes in testing practices rather the result of in- 10. Price RHM, Graham C, Ramalingam S. Association between viral seasonality and

 Downloaded from https://academic.oup.com/cid/article/73/Supplement_1/S110/6257582 by guest on 14 November 2021
creases in viral circulation. meteorological factors. Sci Rep 2019; 9:929.
 11. Viboud C, Boëlle PY, Cauchemez S, et al. Risk factors of influenza transmission in
 Collectively, these findings document substantial changes in households. Br J Gen Pract 2004; 54:684–9.
circulation of respiratory pathogens other than SARS-CoV-2 and 12. Cauchemez S, Valleron AJ, Boëlle PY, Flahault A, Ferguson NM. Estimating the
 impact of school closure on influenza transmission from Sentinel data. Nature
in related health-seeking behavior. The long-term implications of
 2008; 452:750–4.
these changes are uncertain, but it is expected that interventions 13. Willem L, Van Kerckhove K, Chao DL, Hens N, Beutels P. A nice day for an infec-
designed to mitigate the spread of COVID-19 will continue to im- tion? Weather conditions and social contact patterns relevant to influenza trans-
 mission. PLoS One 2012; 7:e48695.
pact multiple respiratory pathogens. Understanding current viral 14. Martineau AR, Jolliffe DA, Hooper RL, et al. Vitamin D supplementation to pre-
circulation aids clinicians in understanding the most probable vent acute respiratory tract infections: systematic review and meta-analysis of in-
 dividual participant data. BMJ 2017; 356:i6583.
pathogens affecting patients, and continued surveillance is essen- 15. Olsen SJ, Azziz-Baumgartner E, Budd AP, et al. Decreased influenza activity
tial for guiding mitigation strategies. during the COVID-19 pandemic—United States, Australia, Chile, and South
 Africa, 2020. Morb Mortal Wkly Rep 2020; 69:1305–9.
 16. Adjemian J, Hartnett K, Kite-Powell A, et al. Update: COVID-19 pandemic–as-
 sociated changes in Emergency Department Visits — United States, December
Supplementary Data 2020–January 2021. Morb Mortal Wkly Rep 2021; 70:552–6.
 17. Centers for Disease Control and Prevention. National Syndromic Surveillance
Supplementary materials are available at Clinical Infectious Diseases online.
 Program. Available at: https://www.cdc.gov/nssp. Accessed 1 January 2021.
Consisting of data provided by the authors to benefit the reader, the posted 18. Centers for Disease Control and Prevention. CDC Data Hub. Available at: https://
materials are not copyedited and are the sole responsibility of the authors, so www.cdc.gov/csels/dhis/documents/dhis-data-hub-508.pdf. Accessed 23 May
questions or comments should be addressed to the corresponding author. 2021.
 19. Centers for Disease Control and Prevention. COVID data tracker. Available at:
 https://covid.cdc.gov/covid-data-tracker/. Accessed 17 February 2021.
Notes 20. Sniegoski CA. Automated syndromic classification of chief complaint records.
 Acknowledgments. The authors acknowledge the NSSP Community of Johns Hopkins Apl Technical Digest. 2004; 25:68-75.
Practice for providing ED data, and both Quest Diagnostics and Labcorp 21. Burkom H, Loschen W, Wojcik R, et al. ESSENCE, the electronic surveil-
 lance system for the early notification of community-based epidemics: over-
for providing clinical laboratory data used in this study and for reviewing
 view, components, and Public Health Applications. JMIR Public Health and
this manuscript.
 Surveillance. 12/04/2021:26303.
 Disclaimer. The contents of this paper are solely the responsibility of the 22. Regenstrief Institute. Logical observation identifiers names and codes. Available
authors and do not necessarily represent the official views of the Centers for at: https://loinc.org/. Accessed 2 March 2021.
Disease Control and Prevention. 23. Jennings LC, Dick EC. Transmission and control of rhinovirus colds. Eur J
 Financial support. This work was supported by the Centers for Disease Epidemiol 1987; 3:327–35.
Control and Prevention’s regular operating funds. 24. Dick EC, Jennings LC, Mink KA, Wartgow CD, Inhorn SL. Aerosol transmission
 Supplement sponsorship. This supplement is supported by the of rhinovirus colds. J Infect Dis 1987; 156:442–8.
Infectious Diseases Society of America through Cooperative Agreement 25. Poole S, Brendish NJ, Tanner AR, Clark TW. Physical distancing in schools for
 SARS-CoV-2 and the resurgence of rhinovirus. Lancet Respir Med 2020; 8:e92–3.
NU50CK000574 with the U.S. Centers for Disease Control and Prevention.
 26. Leung NHL, Chu DKW, Shiu EYC, et al. Respiratory virus shedding in exhaled
 Potential conflicts of interest. The authors: No reported conflicts of in-
 breath and efficacy of face masks. Nat Med 2020; 26:676–80.
terest. All authors have submitted ICME Forms for Disclosure of Potential 27. Nickbakhsh S, Mair C, Matthews L, et al. Virus-virus interactions impact the popu-
Conflicts of Interest. All authors: No reported conflicts of interest. Conflicts lation dynamics of influenza and the common cold. Proc Natl Acad Sci USA 2019;
that the editors consider relevant to the content of the manuscript have been 116:7142–50.
disclosed. 28. Linde A, Rotzen-Ostlund M, Zweygberg-Wirgart B, Rubinova S, Brytting M.
 Does viral interference affect spread of influenza? Euro Surveill 2009; 14:2–4.
 29. Casalegno JS, Ottmann M, Duchamp MB, et al. Rhinoviruses delayed the circu-
References lation of the pandemic influenza A (H1N1) 2009 virus in France. Clin Microbiol
 1. Centers for Disease Control and Prevention. Common cold. Available at: https:// Infect 2010; 16:326–9.
 www.cdc.gov/antibiotic-use/community/for-patients/common-illnesses/colds. 30. Centers for Disease Control and Prevention. New ICD-10-CM code for the 2019
 html. Accessed 2 March 2021. novel coronavirus (COVID-19), April 1, 2020. 2020. Available at: https://www.cdc.
 2. Eccles R. Understanding the symptoms of the common cold and influenza. gov/nchs/data/icd/Announcement-New-ICD-code-for-coronavirus-3-18-2020.
 Lancet Infect Dis 2005; 5:718–25. pdf. Accessed 1 January 2021.

 Changes in Respiratory Illnesses • cid 2021:73 (Suppl 1) • S117
You can also read