Changes in the use patterns of bDMARDs in patients with rheumatic diseases over the past 13 years - Nature
←
→
Page content transcription
If your browser does not render page correctly, please read the page content below
www.nature.com/scientificreports

                OPEN              Changes in the use patterns
                                  of bDMARDs in patients
                                  with rheumatic diseases
                                  over the past 13 years
                                  Carlos Sánchez‑Piedra1, Diana Sueiro‑Delgado2, Javier García‑González3,
                                  Inmaculada Ros‑Vilamajo4, Agueda Prior‑Español5, Manuel José Moreno‑Ramos6,
                                  Blanca Garcia‑Magallon7, Jerusalen Calvo‑Gutiérrez8, Yanira Perez‑Vera9,
                                  Raquel Martín‑Domenech10, Dolores Ruiz‑Montesino11, Paloma Vela‑Casasempere12,
                                  Lorena Expósito13, Fernando Sánchez‑Alonso1, Enrique González‑Davila14 &
                                  Federico Díaz‑González13,15*

                                  The better understanding of the safety of biologic DMARDs (bDMARDs), as well as the emergence
                                  of new bDMARDs against different therapeutic targets and biosimilars have likely influenced the use
                                  patterns of these compounds over time. The aim of this study is to assess changes in demographic
                                  characteristics, disease activity and treatment patterns in patients with rheumatoid arthritis (RA),
                                  psoriatic arthritis (PsA), or ankylosing spondylitis (AS) who started a first- or second-line biologic
                                  between 2007 and mid-2020. Patients diagnosed with RA, PsA or AS included in the BIOBADASER
                                  registry from January 2007 to July 2020 were included. According to the start date of a first- or second-
                                  line biologic therapy, patients were stratified into four time periods: 2007–2009; 2010–2013; 2014–
                                  2017; 2018–2020 and analyzed cross-sectionally in each period. Demographic and clinical variables, as
                                  well as the type of biologic used, were assessed. Generalized linear models were applied to study the
                                  evolution of the variables of interest over time periods, the diagnosis, and the interactions between
                                  them. A total of 4543 patients initiated a first biologic during the entire time frame of the study.
                                  Over the four time periods, disease evolution at the time of biologic initiation (p < 0.001), disease
                                  activity (p < 0.001), retention rate (p < 0.001) and the use of tumor necrosis factor inhibitors as a
                                  first-line treatment (p < 0.001) showed a significant tendency to decrease. Conversely, comorbidities,
                                  as assessed by the Charlson index (p < 0.001), and the percentage of patients using bDMARDs in
                                  monotherapy (p < 0.001), and corticosteroids (p < 0.001) tended to increase over time. Over the entire
                                  period of the study’s analysis, 3289 patients started a second biologic. The following trends were
                                  observed: decreased DAS28 at switching (p < 0.001), lower retention rates (p = 0.004), and incremental
                                  changes to the therapeutic target between the first and second biologic (p < 0.001). From 2007 until
                                  now rheumatic patients who started a biologic were older, exhibited less clinical activity, presented
                                  more comorbidities, and switched to a different biologic more frequently and earlier.

                                  1
                                   Unidad de Investigación SER, Madrid, Spain. 2Servicio de Reumatología, Complejo Hospitalario de Ourense,
                                  Ourense, Spain. 3Servicio de Reumatología, Hospital Universitario Doce de Octubre, Madrid, Spain. 4Servicio de
                                  Reumatología, Hospital Son Llatzer, Palma de Mallorca, Spain. 5Servicio de Reumatología, Hospital Universitari
                                  Germans Trias i Pujol, Barcelona, Spain. 6Servicio de Reumatología, Hospital Universitario Virgen Arrixaca, Murcia,
                                  Spain. 7Servicio de Reumatología, Hospital San Jorge, Huesca, Spain. 8Servicio de Reumatología, Hospital Reina
                                  Sofía, Cordoba, Spain. 9Servicio de Reumatología, Hospital Universitario de Gran Canaria Doctor Negrín, Las
                                  Palmas, Spain. 10Servicio de Reumatología, Hospital General de Elda, Alicante, Spain. 11Servicio de Reumatología,
                                  Hospital Universitario Virgen Macarena, Seville, Spain. 12Servicio de Reumatología, Hospital General Universitario
                                  Alicante, Alicante, Spain. 13Servicio de Reumatología, Hospital Universitario de Canarias, Calle Ofra s/n 38320, La
                                  Laguna, Santa Cruz de Tenerife, Spain. 14Departamento de Matemáticas, Estadística e Investigación Operativa,
                                  Universidad de La Laguna, Tenerife, Spain. 15Departamento de Medicina Interna, Dermatología y Cirugía,
                                  Dermatología y Psiquiatría, Universidad de La Laguna, Tenerife, Spain. *email: federico.diaz.gonzalez@
                                  gmail.com

Scientific Reports |   (2021) 11:15051                | https://doi.org/10.1038/s41598-021-94504-x                                                 1

                                                                                                                                              Vol.:(0123456789)
www.nature.com/scientificreports/
Over the last 2 decades, management of the most common chronic inflammatory rheumatic diseases involv-
ing joints has undergone a revolution since the arrival of biologic disease-modifying antirheumatic drugs
(bDMARDs)1. Initially, information on the safety of biological products was limited, particularly regarding their
long-term use. In addition, other factors, such as the heterogeneity of patients, the presence of comorbidities
and risk factors, as well as treatment adherence, also slowed the widespread use of these products2. Although
it is evident that bDMARDs have improved the clinical outcomes of patients with rheumatic diseases, these
treatments are not without significant costs. Biological agents are expensive and the rheumatic diseases that
require their use affect more than 2% of the population3,4. Therefore, even the richest societies cannot support
the indiscriminate use of bDMARDs in all of the patients who require t hem5,6.
It is reasonable to think that the arrival of both new families of bDMARDs with different therapeutic t argets7,8
and more affordable versions of the original bDMARDs (biosimilars)9,10 has contributed to the increased use of
these products. However, the clinical experience gained with these compounds has been particularly decisive in
the increasing use of biologics, resulting in a change in the profile of rheumatic patients treated with bDMARDs
over the last 2 decades. Nevertheless, despite all these changes, few studies have assessed how the use patterns
of these compounds in rheumatic patients have changed since bDMARDs have become available. Most studies
that have analyzed changes over time in the use patterns of bDMARDs have focused almost exclusively on rheu-
matoid arthritis (RA) patients11,12. However, studies analyzing these temporary changes in the use of bDMARDs
in psoriatic arthritis (PsA)13 or ankylosing spondylitis (AS) remain very scarce.
It is likely that a better understanding of the safety and effectiveness of biologics, as well as the appearance of
new therapeutic targets and biosimilars, has influenced the manner in which patients with chronic musculoskel-
etal inflammatory disease are treated. The objective of this analysis was to compare the baseline characteristics
of patients with RA, PsA or AS, including demographic and disease characteristics, who underwent a first- and
second-line biological therapy from 2007 to mid-2020.
Methods
Study design and setting: BIOBADASER III. BIOBADASER (biobadaser.ser.es) is a Spanish multi-
center observational registry aimed at assessing safety in patients with rheumatic diseases who started treatment
with any bDMARD or targeted synthetic DMARD. It was established in 2000 and has been comprehensively
described in a previous r eport14. BIOBADASER III is the third stage of this registry, a new version developed
in December 201515, which added to its objectives a systematic assessment of effectiveness using commonly
accepted indexes. The BIOBADASER registry is promoted by the Spanish Society of Rheumatology (SER) and
is supported by the Spanish Agency of Drugs and Medical Devices (AEMPS) as well as by several pharmaceuti-
cal companies. To assess consistency and quality, strict measures are implemented. Every year the full database
is monitored online; additionally, a random sample of patients is annually selected and audited in situ at all 28
participating centers. The recruitment of new patients is dynamic and remains open indefinitely. Further details
about the design and operation of the BIOBADASER III registry, such as the complete protocol and relevant
documentation, are available at the BIOBADASER website (biobadaser.ser.es).
Patients diagnosed with RA, PsA and/or AS included in the BIOBADASER database who started either a first
or second-line biologic between January 2007 and July 2020 were analyzed. Four independent cross-sectional
analyses were conducted during the following time periods: 2007–2009; 2010–2013; 2014–2017; 2018–2020. For
each period, demographic and clinical variables, the type of biologic used as well as biologic retention rates were
assessed in patients who started a first- or second-line biologic. All parameters were analyzed cross-sectionally,
except for the retention rate, which was analyzed prospectively as the percentage of patients who maintained
that particular biologic therapy 1 year after its initiation.
Participants. Included in this analysis were all BIOBADASER registry patients diagnosed with RA, PsA or
AS according to the criteria used by their treating rheumatologist and who were prescribed a bDMARD, either
naïve (first-line) or after failing another drug of these classes (second-line), from 1 January 2007 to 20 July 2020.
The number of participating centers varied across the different periods. In BIOBADASER Phase II
(2007–2015) all patients who started biologic treatment owing to a rheumatic disease in the 14 participating
hospitals were included. During BIOBADASER Phase III (2015–2020), the number of centers ranged from 25
to 35 depending on recruitment capacity and data quality.
Variables. Patients were classified according to the year they started the biological treatment (first-line) or
the year they switched to a second biological treatment (second-line). Four time periods were arbitrarily estab-
lished for the analysis: first, from 2007 to 2009; second, from 2010 to 2013; third, from 2014 to 2017; and fourth,
from 2018 to 2020.
This analysis included the following variables: (1) demographics (sex and age); (2) clinical characteristics, such
as disease activity by DAS28 in RA and PsA patients, and comorbidities based on pathologies or the Charlson
comorbidity index16; (3) treatment data, including type of biologic, date of initiation and discontinuation, the
use of synthetic DMARDs and glucocorticoids (GCs). The retention rate at the end of the first year of follow-up
was also analyzed. Compared with the previous version, BIOBADASER III collects disease activity indices of
patients with RA, PsA, and AS prospectively and also includes the assessment of comorbidities using the Charlson
index, although only at the baseline visit. Although BIOBADASER III collects BASDAI in patients with AS, this
has been required only from 2014; thus, AS activity was not evaluated in this study.
All procedures and materials complied with the principles of the Declaration of Helsinki and with Span-
ish regulations on data protection and research. The project was approved by the Ethics Review Committee
Scientific Reports | (2021) 11:15051 | https://doi.org/10.1038/s41598-021-94504-x 2
Vol:.(1234567890)www.nature.com/scientificreports/
Variable 2007–2009 2010–2013 2014–2017 2018–2020 p Total
Number of participating centers* 14 13 27 31 38
Number of patients included 1522 786 886 1349 4543
Diagnosis, n (%) < 0.001
RA 870 (57.2) 390 (49.6) 328 (37.0) 605 (44.8) 2193 (48.3)
PsA 318 (20.9) 194 (24.7) 280 (31.6) 414 (30.7) 1206 (26.6)
AS 334 (21.9) 202 (25.7) 278 (31.4) 330 (24.5) 1144 (25.2)
Demographic characteristics
Female gender, n (%) 933 (61.3) 462 (58.8) 456 (51.5) 809 (60.0) 0.104 2660 (58.6)
Age at the beginning of first biologic, mean ± SD 51.0 ± 14.2 50.9 ± 14.0 50.5 ± 13.3 52.1 ± 13.2 0.075 51.2 ± 13.7
Table 1. Diagnosis and sociodemographic features at the beginning of first-line biologics treatment by time
periods. *Centers that included at least one patient in this analysis.
of the Hospital Universitario Clinic Barcelona, which acted as the reference committee (approval code FER-
ADA-2015-01). Informed consent was obtained from all participants.
Statistical analysis. The sample was described in terms of the distribution of the descriptive variables
through measures of central tendency. The quantitative variables were expressed as mean and standard devia-
tions, except for the disease evolution time to the first biologic, which was expressed as median and interquartile
ranges due to its strong positive asymmetry. For qualitative variables, the frequencies and percentages were
calculated, the latter rounded to one decimal place. Chi-Square tests were used to test independence. General-
ized linear models were applied to study the evolution of the variables of interest over the relevant time periods,
the diagnosis, and the interaction between them. The study of the interaction enables us to analyze the pos-
sible variations in the outcomes analyzed when the patients are in a specific time and diagnosis category with
respect to the reference category, which, in our study, was patients with RA in the period 2007–2010, denoted as
(2007–2010) and RA. Identity was used as a link for quantitative variables and logit link for qualitative variables.
For disease evolution time, a logarithmic transformation was initially applied to normalize and homogenize the
variances. Treatment duration was analyzed, taking into account the time of treatment until discontinuation,
and including only those patients who had discontinued treatment. A Tukey DHS (Honestly Significant Differ-
ence) procedure was performed to determine the homogeneity of the quantitative variables across the different
time periods. Statistical analyses were performed by using STATA software (version 13.1).
Results
First‑line biological treatment. From 1 January 2007 to 20 July 2020, a total of 4543 patients starting
bDMARDs were registered in the BIOBADASER database. The first period (from 2007 to 2009) comprised 1522
patients; the second (from 2010 to 2013), 786 patients; the third (from 2014 to 2017), 886 patients; and finally
fourth period (from 2018 to July 2020), 1349 patients were analyzed.
Table 1 shows the demographic characteristics of patients who began a first-line biologic treatment by time
periods. Most participants were female (58.6%) and had been diagnosed with RA (48.3%). Regarding the mean
age at the beginning of the first biologic, although it increased from 51.0-years-old in the first time period to
52.1-years-old in the fourth, this variable does not reach statistical significance (p = 0.075). When patients were
assessed as a whole, the median disease evolution time at the beginning of the first biologic fell from 5.5 in the
first period to 3.4 years (p < 0.001) in the fourth (Table 2). In terms of pathology, a significant downward trend was
similarly detected in all three pathologies: RA patients decreased from 5.7 to 4.3 years (p = 0.001), PsA patients
from 5.0 to 3.0 years (p < 0.001), and AS patients from 5.9 to 2.5 years (p = 0.001). An analysis of homogeneous
subsets revealed a tendency to use biologics in the first indication in patients with a significantly shorter disease
progression in the second period than in the first period for all three diseases analyzed. In RA and PsA patients,
disease activity at the beginning of the first biologic, as assessed by DAS28, was consistently higher, from 5.3 to
4.7 (p < 0.001) and 4.9 to 4.2 (p < 0.001), during the first (2007–2009) time period versus the fourth (2018–2020),
respectively (Table 2).
Regarding treatment (Table 2), the use of TNFi as a first-line treatment option was significantly lower in
patients as a whole, from 94.7% in the first period to 73.3% in the fourth (p < 0.001). This trend was also con-
firmed when patients were analyzed by pathologies. With regards to concomitant therapy, the use of biologics
in monotherapy was higher over the different analyzed time periods: from 29.2 to 42.7% (p < 0.001) of patients.
In addition, the use of corticosteroids also decreased significantly (p < 0.001), with a clear downward trend
from the first to the third period, 46.1–37.7%, respectively, albeit with a mild increment reaching 40.2% in the
fourth period. With respect to the retention rate of the first biologic during the first year of follow-up (Table 2),
it decreased in patients overall from 74.8% in the first period to 50.3% in the fourth (p < 0.001). This trend was
also confirmed when patients were analyzed by pathologies. With respect to comorbidities (Table 2), the Charlson
index showed a significant tendency to increase over the time periods of the study (p < 0.001). Cancer antecedents
(p < 0.001), hypercholesterolemia (p < 0.001), osteoporosis (p = 0.008) and smoking status (p < 0.001) were more
frequently recorded in patients who started bDMARDs treatment during the 2018–2020 period with respect to
those who did so during the 2007–2009 period.
Scientific Reports | (2021) 11:15051 | https://doi.org/10.1038/s41598-021-94504-x 3
Vol.:(0123456789)www.nature.com/scientificreports/
Variable 2007–2009 2010–2013 2014–2017 2018–2020 p Homogeneous subsets** Total
Clinical features
Disease evolution time to first biologics in years, median
5.5 (1.9; 11.9) 4.1 (1.5; 10.3) 3.7 (1.2; 8.9) 3.4 (1.1; 8.3) < 0.001 1234 4.2 (1.4;10.0)
(P25;P75)
RA 5.7 (2.2; 12.1) 4.5 (1.8; 10.3) 5.4 (2.2; 10.8) 4.3 (1.7; 9.3) < 0.001 1234 5.0 (2.0; 10.5)
PsA 5.0 (1.7; 9.6) 3.5 (1.4; 9.1) 3.0 (1.0; 7.2) 3.0 (1.0; 7.0) < 0.001 1234 3.4 (1.2; 8.0)
AS 5.9 (1.4; 14.6) 4.2 (0.8; 12.6) 2.6 (0.8; 9.1) 2.5 (0.7; 8.6) < 0.001 1234 3.6 (0.9; 11.8)
DAS28 at baseline, mean ± SD
RA 5.3 ± 1.3 4.8 ± 1.4 4.8 ± 1.1 4.7 ± 1.3 < 0.001 1234 4.9 ± 1.3
PsA 4.9 ± 1.3 4.8 ± 1.5 4.1 ± 1.3 4.2 ± 1.2 < 0.001 1234 4.4 ± 1.3
Treatments
Use of TNF inhibitors as first-line treatment, n (%) 1441 (94.7) 669 (85.1) 660 (74.5) 989 (73.3) < 0.001 1234 3759 (82.7)
RA 791 (90.9) 277 (71.0) 195 (59.5) 459 (75.9) < 0.001 1234 1722 (78.5)
PsA 317 (99.7) 191 (98.5) 210 (75.0) 255 (61.6) < 0.001 1234 973 (80.7)
AS 333 (99.7) 201 (99.5) 255 (91.7) 275 (83.3) < 0.001 1234 1064 (93.0)
Monotherapy 444 (29.2) 284 (36.1) 338 (38.2) 576 (42.7) < 0.001 1234 1642 (36.1)
Concomitant therapy, n (%)
Methotrexate 830 (54.5) 362 (46.1) 329 (37.1) 522 (38.7) < 0.001 1234 2043 (45.0)
Leflunomide 232 (15.2) 135 (17.2) 176 (19.9) 207 (15.3) 0.014 1234 750 (16.5)
Others 157 (10.3) 68 (8.7) 117 (13.2) 128 (9.5) 0.010 1234 470 (10.3)
Use of corticosteroids 701 (46.1) 323 (41.1) 334 (37.7) 542 (40.2) < 0.001 1234 1900 (41.8)
Retention rate at end of first year of follow-up, n (%) 1138 (74.8) 571 (72.7) 599 (67.6) 678 (50.3) < 0.001 1234 2986 (65.7)
RA 587 (67.5) 260 (66.7) 196 (59.8) 312 (52.6) < 0.001 1234 1355 (61.8)
PsA 266 (83.7) 152 (78.4) 202 (72.1) 200 (48.3) < 0.001 1234 820 (68.0)
AS 285 (85.3) 159 (78.7) 201 (72.3) 166 (50.3) 0.001 1234 811 (70.9)
Comorbidities
Charlson Index, mean ± SD 1.6 ± 0.9 1.6 ± 0.9 1.9 ± 1.4 2.0 ± 1.3 < 0.001 1234 1.8 ± 1.2
Cancer, n (%) 29 (1.9) 14 (1.8) 33 (3.7) 64 (4.7) < 0.001 1234 140 (3.1)
Lymphoma, n (%) 4 (0.3) 1 (0.1) 1 (0.1) 4 (0.3) 0.905 1234 10 (0.2)
Ischemic heart disease, n (%) 37 (2.4) 18 (2.3) 25 (2.8) 36 (2.7) 0.574 1234 116 (2.6)
Diabetes, n (%) 120 (7.9) 46 (5.9) 52 (5.9) 112 (8.3) 0.773 1234 330 (7.3)
Heart failure, n (%) 23 (1.5) 10 (1.3) 9 (1.0) 15 (1.1) 0.285 1234 57 (1.3)
Hypercholesterolemia, n (%) 226 (14.9) 114 (14.5) 225 (25.4) 325 (24.1) < 0.001 1234 890 (19.6)
Arterial hypertension, n (%) 343 (22.5) 159 (20.2) 210 (23.7) 315 (23.4) 0.373 1234 1027 (22.6)
Osteoporosis, n (%) 179 (11.8) 70 (8.9) 69 (7.8) 115 (8.5) 0.002 1234 433 (9.5)
Smoker, n (%) 266 (17.5) 128 (16.3) 225 (25.4) 296 (21.9) < 0.001 1234 915 (20.1)
Table 2. Clinical features and use of treatments at the beginning of first-line biologics treatment by time
periods. *Centers that included at least one patient in this analysis. **Numbers in the homogeneous subsets
column represent the four consecutive periods of time. Lines join time periods in which differences were not
statistically significant.
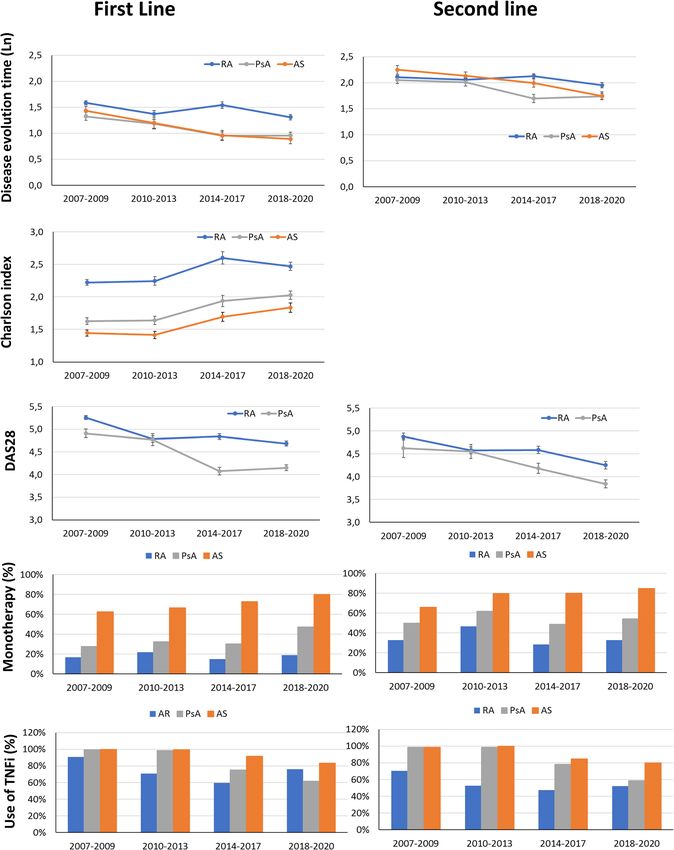
Figure 1 shows the changes over time in disease evolution time with respect to the first biologic, Charlson
index, DAS28, use of TNF inhibitors and monotherapy according to the diagnosis and study period.
In an additional analysis using a generalized linear model (see Supplementary Table 1 online), the interac-
tion between diagnosis (reference category: RA) and period (reference: 2007–2010) was evaluated in the group
of patients that initiated a biologic. Over the study period, first-line biologics were used in patients with shorter
disease evolution time, with less disease activity, with more comorbidities and with a tendency to use therapeutic
targets other than TNF. When analyzed by diagnosis, patients with PsA or AS who initiated the first biologic
had shorter disease evolution times, less disease activity (patients with PsA), and less comorbidities, but more
frequently underwent anti-TNF in monotherapy than did RA patients. When the interaction between the period
and diagnosis was analyzed using the same references (initial period and RA diagnosis), patients with PsA,
especially from 2014 onwards, exhibited a shorter disease evolution time, less disease activity, and less use of
anti-TNF, preferably in monotherapy over the study time period with respect to RA. In this model, no interaction
between the study time period and diagnosis was found for comorbidities, as assessed by the Charlson index.
The distribution of bDMARDs varied across time periods (see Supplementary Table 2 and Supplementary
Fig. 1 online). Biosimilars first became available on the Spanish market in 2016. Since that time, the percent-
age of patients with RA, PsA or AE who started treatment with a biosimilar as a first-line therapy has gradually
increased to 65% by 2020 (see Supplementary Fig. 2A online).
Scientific Reports | (2021) 11:15051 | https://doi.org/10.1038/s41598-021-94504-x 4
Vol:.(1234567890)www.nature.com/scientificreports/
Figure 1. Changes over time periods in terms of disease evolution time, Charlson comorbidity index, DAS28,
use of TNFi and monotherapy according to diagnosis. First- and second-line biological treatment trends are
shown.
Scientific Reports | (2021) 11:15051 | https://doi.org/10.1038/s41598-021-94504-x 5
Vol.:(0123456789)www.nature.com/scientificreports/
Variable 2007–2009 2010–2013 2014–2017 2018–2020 p Total
Number of participating centers* 14 14 26 29 36
Number of patients included 827 884 733 845 3289
Diagnosis, n (%) < 0.001
RA 549 (66.4) 548 (62.0) 370 (50.5) 356 (42.1) 1823 (55.4)
PsA 154 (18.6) 152 (17.2) 182 (24.8) 289 (32.2) 777 (23.6)
AS 124 (15.0) 184 (20.8) 181 (24.7) 200 (23.7) 689 (21.0)
Demographic characteristics
Female gender, n (%) 539 (65.2) 594 (67.2) 443 (60.4) 491 (58.1) < 0.001 2067 (62.9)
Age at the beginning of second biologic, mean (SD) 51.0 ± 14.2 50.9 ± 14.0 50.5 ± 13.3 52.1 ± 13.2 0.417 53.6 ± 13.3
Table 3. Diagnosis and sociodemographic features at the beginning of a second biologic (second-line
treatment) by time period. *Centers that included at least one patient in this analysis.
Variable 2007–2009 2010–2013 2014–2017 2018–2020 p Homogeneous subsets** Total
Clinical features
Disease evolution time when second biologic was used in
9.2 (4.8; 15.5) 9.1 (4.3; 15.9) 8.3 (3.8; 15.0) 7.2 (3.4; 12.5) < 0.001 1234 8.5 (4.1; 14.8)
years, median (P25;P75)
RA 9.3 (4.8; 15.5) 8.9 (4.3; 15.7) 9.4 (4.8; 15.7) 8.8 (4.1; 13.5) 0.184 1234 9.1 (4.5; 15.1)
PsA 8.4 (4.6; 13.6) 8.7 (4.0; 15.0) 6.8 (2.5; 12.7) 6.5 (3.3; 11.3) 0.006 1234 7.3 (3.4; 13.4)
AS 10.9 (5.1; 19.8) 9.7 (4.7; 17.4) 8.5 (3.8; 17.0) 6.5 (2.5; 12.0) 0.002 1234 8.4 (3.9; 16.4)
DAS28 at baseline, mean ± SD
RA 4.9 ± 1.6 4.6 ± 1.5 4.6 ± 1.4 4.3 ± 1.5 < 0.001 1234 4.6 ± 1.5
PsA 4.6 ± 1.9 4.6 ± 1.5 4.2 ± 1.4 3.8 ± 1.4 < 0.001 1234 4.2 ± 1.5
Use of treatments
Change of therapeutic target between 1st and 2nd
141 (17.1) 174 (19.7) 225 (30.7) 232 (38.2) < 0.001 1234 863 (26.2)
biologic, n (%)
Use of TNF inhibitors as a second-line treatment, n (%) 660 (79.8) 621 (70.8) 471 (64.3) 514 (60.8) < 0.001 1234 2266 (68.9)
RA 386 (70.3) 287 (52.4) 176 (47.6) 185 (52.0) < 0.001 1234 1034 (56.7)
PsA 152 (98.7) 150 (98.7) 142 (78.0) 169 (58.5) < 0.001 1234 613 (78.9)
AS 122 (98.4) 184 (100.0) 153 (84.5) 160 (80.0) < 0.001 1234 619 (89.8)
Monotherapy 340 (41.1) 496 (56.1) 340 (46.4) 444 (52.5) < 0.001 1234 1620 (49.3)
Concomitant therapy, n (%)
Methotrexate 354 (42.8) 289 (32.7) 246 (33.6) 263 (31.1) < 0.001 1234 1152 (35.0)
Leflunomide 141 (17.0) 100 (11.3) 110 (15.0) 114 (13.5) 0.006 1234 465 (14.1)
Others 84 (10.2) 51 (5.8) 73 (10.0) 57 (6.7) 0.001 1234 265 (8.1)
Use of corticosteroids 329 (39.8) 264 (29.9) 285 (38.9) 285 (33.7) 0.214 1234 1163 (35.4)
Table 4. Clinical features and use of treatments at the beginning of a second biologic (second-line treatment)
by time period. *Centers that included at least one patient in this analysis. **The homogeneous subsets are
represented by lines joining the time periods in which differences were not statistically significant.
Second‑line biological treatment. During the time period of this study, BIOBADASER registered a total
of 3289 patients who started treatment with a second biologic: 827 patients during the first period (from 2007
to 2009); 884 patients in the second (2010–2013); 733 patients in the third (2014–2017); and 845 patients in the
fourth (2018–2020). Most patients were female (62.9%) and had been diagnosed with RA (55.4%) (Table 3).
Table 4 shows the clinical and treatment characteristics, by time period, of those patients who began a second-
line biologic treatment. In patients overall, disease evolution from the time a second biologic was introduced
decreased significantly from 11.6 years in the first period to 9.6 years in the fourth (p < 0.001). As was the case
with first-line biologic treatment, biologics were prescribed more frequently in monotherapy to patients who ini-
tiated second-line biologics over the different time periods analyzed (41.1–52.5%; p < 0.001). By pathologies, this
trend was also noted in PsA patients, from 10.5 to 8.7 (p < 0.001), and in AS patients, from 13.6 to 9.6 (p = 0.003),
but not in RA patients (p = 0.147). Regarding disease activity, as assessed by DAS28, both RA and PsA patients
at the beginning of a second biologic decreased significantly from 4.6 to 4.0 (p < 0.001) and 4.2 to 3.3 (p < 0.001)
in the first and fourth periods, respectively. Over the four time periods analyzed, the first switching showed a
clear tendency to change the initial therapeutic target to the detriment of TNF inhibitor use in the three patholo-
gies studied. In contrast to what occurred with the first-line treatment, the use of bDMARDs in monotherapy
decreased significantly (p < 0.001) throughout the 4 time periods. In addition, the use of TNF inhibitors also
consistently decreased throughout the 4 time periods: from 79.8% in the first, to 54.1% (p < 0.001) in the fourth.
Scientific Reports | (2021) 11:15051 | https://doi.org/10.1038/s41598-021-94504-x 6
Vol:.(1234567890)www.nature.com/scientificreports/
The first year’s retention rate regarding the second biologic showed a significant trend to decrease, both in terms
of patients overall, from 55.3%, in the first period to 46.15% in the fourth (p < 0.001), and by pathologies (Table 4).
Overall, except for specific variations, the patterns observed in both the first- and second-line use of biologi-
cals maintained this same trend (Fig. 1). In the generalized linear model, using the same references (2007–2009 as
the time period and RA as the diagnostic measure), a second-line biologic was consistently used across the study
periods in those patients with less active disease. In addition, there was a trend to preferably use therapeutic tar-
gets other than TNF, albeit not in monotherapy or in cases with a shorter disease evolution time. When analyzed
by diagnosis, patients with PsA and AS who used a second-line biologic were more often administered anti-TNF
in monotherapy than were RA patients. When the interaction between the time period and diagnosis was ana-
lyzed, we found that the tendency to administer a second-line biologic correlated with shorter disease evolution
times and, in monotherapy, in AS patients over the respective time periods. (see Supplementary Table 3 online).
Similar to what was observed with the first-line treatment, the use of biosimilars as a second-line therapy
gradually increased in patients with rheumatic diseases since the arrived of these drugs on the market in 2016,
reaching 46% in 2020 (see Supplementary Fig. 2B online).
Discussion
The most important findings of this work can be summarized as follows: (1) From 2007 to 2020, the demographic
characteristics, clinical activity and the therapeutic target of bDMARDs chosen for patients with chronic inflam-
matory arthropathies, both as first- and second-line treatments, have changed; (2) Over this period of time,
the profile of a patient who started a first-line biologic tended to have a shorter disease duration, lower clinical
disease activity, and more comorbidities; (3) With respect to bDMARDs, the use of TNFi as a first-line treatment
has decreased, with a clear temporal trend towards the use of bDMARDs in monotherapy in RA, PsA and AS;
and (4) during the time frame analyzed, the persistent use of first-line biologics decreased significantly, the first
bDMARD switching occurred with lower disease activity, both in RA and PsA patients, and TNFi, as a second
therapeutic option, was less frequently used in all three pathologies analyzed.
bDMARDs have transformed the treatment of RA, PsA and AS, improving outcomes for patients who do
not tolerate or properly respond to conventional DMARDs. However, in the absence of evidence supporting
relevant differences in the effectiveness and/or safety among the available bDMARDs for rheumatic diseases, most
international recommendations leave their selection primarily up to the physician’s d iscretion17–21. This lack of
guidance on the most appropriate approach for prescribing bDMARDs, as well as improvements in the general
knowledge about their long-term safety, an increased number of available therapeutic targets and the greater
affordability of biosimilars, are all factors that may have influenced the use patterns of these compounds over
time. During the period of time analyzed in our study, a trend towards shorter disease evolutions, lower clinical
disease activity and more comorbidities was observed in those RA and PsA patients who had begun a first-line
biologic. Apart from disease activity, which was not assessed, this same tendency was observed in AS patients.
These results are consistent with the trends initially described in previous studies on RA in different countries. In
the United Kingdom, Hyrich et al. assessed changes in disease characteristics in patients who had started TNFi
for RA between 2001 and 2008, finding that there was a significant trend towards earlier use of TNFi in those
with less severe disease11. Norwegian and Swedish studies, analyzing equivalent periods of time, reported similar
results in RA p atients2,22. In both studies, the earlier use of TNFi in RA correlated with improved o utcomes11,22.
An Italian real-life clinical study covering the period from 1999 to 2015, which included a limited number of
RA patients, showed an increasing tendency for earlier introduction of bDMARDs during the disease course,
even in those with moderate disease activity and less severity12. With regards to PsA patients, a previous study
reported a trend to lower disease duration in PsA patients starting bDMARDs during the period 1999–20082. A
recently published Nordic population-based study on PsA patients who initiated bDMARDs from 2006 to 2017
showed that in recent years these compounds have been prescribed when disease activity is lower compared to
previous years. In this study, changes over time in disease evolution and comorbidities at the start of bDMARDs
treatment were not s tudied13. As with RA and PsA patients, we found a trend towards shorter disease evolution
time in AS patients, both when a first or second biologic was started. As far as we know, no previous study has
analyzed changes in disease duration and activity over time in AS patients treated with bDMARDs. Regarding
the presence of comorbidities vis-à-vis the initiation of a first-line bDMARD, we observed a trend towards a
higher Charlson index and higher incidences of cancer history, hypercholesterolemia, osteoporosis, and smoking
status when analyzing the patient cohorts as a whole. This indicates that over the last decade, at least in our series,
the use of bDMARDs has become less restrictive in regards to the previous health status of rheumatic patients.
To the best of our knowledge, no study has analyzed changes over time in terms of the comorbidity profiles of
rheumatic patients who initiate biologics. We believe that this trend may reflect an increased familiarity and better
knowledge of the long-term safety profiles of these compounds by physicians. In our study, TNFi as a first-line
bDMARDs therapy option showed a significant trend over time towards lower use, when analyzing the entire
population or by pathology. The percentage of patients using TNFi as a first-line treatment declined sharply from
2007 to 2020 in PsA and AS patients, probably due to the arrival during that time of new bDMARDs with differ-
ent therapeutic targets (IL-6, IL-17 or IL-12/23). However, during the last time period analyzed, 2018–2020, this
trend slowed in RA patients, showing an upturn. This similarly can be explained by TNFi biosimilars entering
the marketplace at very competitive prices. Biosimilars for rheumatic diseases have been available in Europe
since 2016 and have reduced costs for some drugs by as much as 75%, though in many cases far less. Most cur-
rent clinical practice guidelines include biosimilars in their therapeutic s trategies17–19, although some reluctance
on using these compounds in routine clinical practice p ersists23,24. However, the disparity in the penetration of
biosimilars in different markets does not yet allow for an assessment of their real effects on therapeutic strategies.
Scientific Reports | (2021) 11:15051 | https://doi.org/10.1038/s41598-021-94504-x 7
Vol.:(0123456789)www.nature.com/scientificreports/
International guidelines for RA and PsA generally recommend using bDMARDs in combination with conven-
tional DMARDs17. However, recent evidence from routine clinical practice suggests that in these two pathologies,
the retention rates for bDMARDs do not depend on their use in monotherapy or in combination, except for TNFi
in RA, in which drug survival was significantly lower in m onotherapy25–27. Throughout our study population,
the use of bDMARDs in monotherapy increased progressively throughout the periods of time analyzed. Indeed,
it showed that in daily clinical practice this treatment strategy has gradually adopted bDMARDs as a first-line
treatment. A previous study analyzing 9764 RA patients from 2006 to 2010 found that one-third of patients
received first-line TNFi in monotherapy, which is consistent with our data during a similar time frame (36.13%).
In PsA patients studied from 2004 to 2012, the percentage that initiated treatment with TNFi in monotherapy
was also around one-third28. Improved knowledge of the clinical response to bDMARDs acquired in real-life
clinical settings, in addition to poor tolerance of methotrexate (MTX)29,30, may be reasons that have contributed
to the increasing use of bDMARDs in monotherapy for patients with rheumatic diseases.
In our study, a tendency to reduce the persistence time of a first biologic, switching it for other bDMARDs
in patients with less disease activity, was observed both in RA and PsA. A study in the US that included a large
number of RA patients from two insurance programs, the data showed that the annual rate of bDMARD switch-
ing increased significantly between 2000 and 2015. The reasons for switching, including disease activity, were not
assessed in this s tudy31. However, another US study using a real-world database from 2001 to 2009, found that
the threshold of disease activity for switching biologic treatments decreased over time in RA patients32. During a
similar time frame, but in Europe, RA patients discontinuing TNFi showed a temporary trend towards decreased
disease activity at the time of discontinuation33.
Cycling versus swapping strategies for bDMARDs has been a controversial i ssue34. However, most observa-
tional studies, including well-designed prospective randomised analyses, have demonstrated the superiority of
swapping over cycling as the best approach for managing TNFi non-responding RA patients, whereas only a few
studies have reported any comparable e ffectiveness35–38. In AS patients, a study including patients that initiated
TNFi from 2009 to 2013 confirmed that while many patients cycled through TNFi medications, IL-17 inhibitors
were not available during the relevant time period. Thus, it is not possible to know whether switching to IL-17
inhibitors would have impacted the observed treatment p atterns39. These findings are consistent with our own
results: an increased use of bDMARDs (non-TNFi’s) as a second-line treatment for RA and PsA patients over
time. In RA, we observed an increased use of TNFi during the last time period analyzed with respect to the
previous one, probably due to the arrival of TNFi biosimilars at very competitive prices beginning in 2016. In
AS patients, the use of TNFi as a second-line treatment occurred only until 2015, when IL-17 inhibitors entered
the marketplace. The introduction of the treat-to-target (T2T) approach may also have influenced these changes
in the pattern of bDMARD use over the past few years40–42. In particular, shorter disease evolution times to
initiate bDMARDs, and lower clinical activity when switching are two patterns that could be associated with
the adoption of this strategy.
This study has both strengths and limitations. Our study analyzed data from a relevant number of patients
included in an annually monitored national registry that has been active since 2000. Nonetheless, some limita-
tions are obvious. Our evaluation of the activity of patients with PsA was done using DAS28 instead of more
specific activity indices, such as DAPSA. In this work, disease activity in patients with PsA was assessed using
DAS28 instead of more specific indices, such as DAPSA43. DAS28 was originally developed as an activity index
for RA, and although it has been used for the assessment of PsA in previous studies44,45, the use of DAS28 in PsA
may not be accurate in patients with PsA presenting with joint patterns that are not polyarticular or RA-like46.
Although for the last 2 years BIOBADASER is collecting disease activity using both DAPSA and DAS28 in PsA
patients, the rationale for using DAS28 to assess PsA activity in our study was that no other activity index was
available for PsA patients in BIOBADASER from 2007 to 2018. In addition, the activity of patients with AS could
not be studied because of the absence of BASDAI data prior to 2014. The decision to evaluate changes in the
pattern of bDMARDs use over arbitrary time periods should not affect the objective of our analysis or the trends
identified over time. Finally, we found differences in the proportion of patients according to diagnosis across the
time periods studied. In order to limit the effect of these differences on our findings, we analyzed key variables
(disease duration to first/second biologics in years, DAS28, retention rate at end of first year of follow-up, use of
TNF inhibitors as a first/second-line treatment) for each condition and used generalized linear models to study
changes in the variables of interest over the time periods, after considering the interaction between them and
adjusting for the diagnosis.
Conclusions
There have been changes in the use patterns of bDMARDs as both first- and second-line treatments over the last
13 years. Patient profiles have evolved and are now characterized by shorter disease evolution times and lower
disease activity. The tendency to use bDMARDs as a first-line treatment in patients with more comorbidities was
observed. Treatment strategies involving bDMARDs have also changed: the utilization of TNFi has decreased
globally, and now the use of monotherapy strategies as first and/or second-line treatments is much more common.
Data availability
The data that support the findings of this study are available from Spanish Society of Rheumatology but restric-
tions apply to the availability of these data, which were used under license for the current study, and so are not
publicly available. Data are however available from the authors upon reasonable request and with permission of
Spanish Society of Rheumatology.
Scientific Reports | (2021) 11:15051 | https://doi.org/10.1038/s41598-021-94504-x 8
Vol:.(1234567890)www.nature.com/scientificreports/
Received: 25 March 2021; Accepted: 12 July 2021
References
1. Sepriano, A. et al. Safety of synthetic and biological DMARDs: A systematic literature review informing the 2019 update of the
EULAR recommendations for the management of rheumatoid arthritis. Ann. Rheum. Dis. 79, 760–770 (2020).
2. Simard, J. F. et al. Ten years with biologics: To whom do data on effectiveness and safety apply?. Rheumatology 50, 204–213 (2011).
3. Stolwijk, C., van Onna, M., Boonen, A. & van Tubergen, A. Global prevalence of spondyloarthritis: A systematic review and meta-
regression analysis. Arthritis Care Res. 68, 1320–1331 (2016).
4. Gabriel, S. E. & Michaud, K. Epidemiological studies in incidence, prevalence, mortality, and comorbidity of the rheumatic diseases.
Arthritis Res. Ther. 11, 229 (2009).
5. Gulácsi, L. et al. Transferability of results of cost utility analyses for biologicals in inflammatory conditions for Central and Eastern
European countries. Eur. J. Health Econ. 15, 27–34 (2014).
6. Kvamme, M. K. et al. Cost-effectiveness of TNF inhibitors vs synthetic disease-modifying antirheumatic drugs in patients with
rheumatoid arthritis: A Markov model study based on two longitudinal observational studies. Rheumatology 54, 1226–1235 (2015).
7. Tak, P. P. & Kalden, J. R. Advances in rheumatology: New targeted therapeutics. Arthritis Res. Ther. 13, S5 (2011).
8. Strand, V., Kimberly, R. & Isaacs, J. D. Biologic therapies in rheumatology: Lessons learned, future directions. Nat. Rev. Drug Discov.
6, 75–92 (2007).
9. Simoens, S., Jacobs, I., Popovian, R., Isakov, L. & Shane, L. G. Assessing the value of biosimilars: A review of the role of budget
impact analysis. Pharmacoeconomics 35, 1047–1062 (2017).
10. Dorner, T. et al. The changing landscape of biosimilars in rheumatology. Ann. Rheum. Dis. 75, 974–982. https://doi.org/10.1136/
annrheumdis-2016-209166 (2016).
11. Hyrich, K. L., Watson, K. D., Lunt, M. & Symmons, D. P. Changes in disease characteristics and response rates among patients in
the United Kingdom starting anti-tumour necrosis factor therapy for rheumatoid arthritis between 2001 and 2008. Rheumatology
50, 117–123 (2011).
12. Favalli, E. G., Becciolini, A. & Meroni, P. L. Change over time in the pattern of clinical response to first-line biologic drugs in
patients with rheumatoid arthritis: Observational data in a real-life setting. J. Rheumatol. 44, 262–263 (2017).
13. Lund Hansen, R. et al. Inflammatory hallmarks of lesser prominence in psoriatic arthritis patients starting biologics: A Nordic
population-based cohort study. Rheumatology 60, 140–146 (2020).
14. Carmona, L. et al. Safety and retention rate of off-label uses of TNF antagonists in rheumatic conditions: Data from the Spanish
registry BIOBADASER 2.0. Rheumatology 50, 85–92 (2011).
15. Sanchez-Piedra, C. et al. Objetivos y metodología de la fase iii de BIOBADASER. Reumatol. Clín. 15, 229–236 (2019).
16. Charlson, M. E., Pompei, P., Ales, K. L. & MacKenzie, C. R. A new method of classifying prognostic comorbidity in longitudinal
studies: Development and validation. J. Clin. Epidemiol. 40, 373–383 (1987).
17. Smolen, J. S. et al. EULAR recommendations for the management of rheumatoid arthritis with synthetic and biological disease-
modifying antirheumatic drugs: 2019 update. Ann. Rheum. Dis. 79, 685–699 (2020).
18. Gossec, L. et al. EULAR recommendations for the management of psoriatic arthritis with pharmacological therapies: 2019 update.
Ann. Rheum. Dis. 79, 700–712 (2020).
19. van der Heijde, D. et al. 2016 update of the ASAS-EULAR management recommendations for axial spondyloarthritis. Ann. Rheum.
Dis. 76, 978–991 (2017).
20. Singh, J. A. et al. 2018 American College of Rheumatology/National Psoriasis Foundation guideline for the treatment of psoriatic
arthritis. Arthritis Rheumatol. 71, 5–32 (2019).
21. Ward, M. M. et al. 2019 Update of the American College of Rheumatology/Spondylitis Association of America/Spondyloarthritis
Research and Treatment Network recommendations for the treatment of ankylosing spondylitis and nonradiographic axial spon-
dyloarthritis. Arthritis Care Res. 71, 1285–1299 (2019).
22. Aga, A.-B. et al. Time trends in disease activity, response and remission rates in rheumatoid arthritis during the past decade: Results
from the NOR-DMARD study 2000–2010. Ann. Rheum. Dis. 74, 381–388 (2015).
23. Waller, J., Sullivan, E., Piercy, J., Black, C. M. & Kachroo, S. Assessing physician and patient acceptance of infliximab biosimilars
in rheumatoid arthritis, ankylosing spondyloarthritis and psoriatic arthritis across Germany. Patient Prefer. Adherence 11, 519
(2017).
24. Scherlinger, M. et al. Switching from originator infliximab to biosimilar CT-P13 in real-life: The weight of patient acceptance. Joint
Bone Spine 85, 561–567 (2018).
25. Lauper, K. et al. Seminars in Arthritis and Rheumatism 17–24 (Elsevier, 2020).
26. Silvagni, E. et al. Comparative effectiveness of first-line biological monotherapy use in rheumatoid arthritis: A retrospective analysis
of the RECord-linkage on rheumatic diseases study on health care administrative databases. BMJ Open 8, e021447 (2018).
27. Soliman, M. M. et al. Impact of concomitant use of DMARDs on the persistence with anti-TNF therapies in patients with rheu-
matoid arthritis: Results from the British society for rheumatology biologics register. Ann. Rheum. Dis. 70, 583–589 (2011).
28. Mease, P. J. et al. Changes in treatment patterns in patients with psoriatic arthritis initiating biologic and nonbiologic therapy in
a clinical registry. J. Rheumatol. 44, 184–192 (2017).
29. Ćalasan, M. B. et al. Prevalence of methotrexate intolerance in rheumatoid arthritis and psoriatic arthritis. Arthritis Res. Ther. 15,
R217 (2013).
30. Nikiphorou, E. et al. Indispensable or intolerable? Methotrexate in patients with rheumatoid and psoriatic arthritis: A retrospective
review of discontinuation rates from a large UK cohort. Clin. Rheumatol. 33, 609–614 (2014).
31. Desai, R. J., Solomon, D. H., Jin, Y., Liu, J. & Kim, S. C. Temporal trends in use of biologic DMARDs for rheumatoid arthritis in
the United States: A cohort study of publicly and privately insured patients. J. Manag. Care Spec. Pharm. 23, 809–814 (2017).
32. Zhang, J. et al. Thresholds in disease activity for switching biologics in rheumatoid arthritis patients: Experience from a large US
cohort. Arthritis Care Res. 63, 1672–1679 (2011).
33. Gómez-Reino, J. J. et al. Change in the discontinuation pattern of tumour necrosis factor antagonists in rheumatoid arthritis over
10 years: Data from the Spanish registry BIOBADASER 2.0. Ann. Rheum. Dis. 71, 382–385 (2012).
34. Villeneuve, E. & Haraoui, B. To switch or to change class-the biologic dilemma in rheumatoid arthritis. Nat. Rev. Rheumatol. 6,
301–305. https://doi.org/10.1038/nrrheum.2010.45 (2010).
35. Favalli, E. G., Biggioggero, M., Marchesoni, A. & Meroni, P. L. Survival on treatment with second-line biologic therapy: A cohort
study comparing cycling and swap strategies. Rheumatology 53, 1664–1668 (2014).
36. Favalli, E. G. et al. The management of first-line biologic therapy failures in rheumatoid arthritis: Current practice and future
perspectives. Autoimmun. Rev. 16, 1185–1195 (2017).
37. Wei, W. et al. Treatment persistence and clinical outcomes of tumor necrosis factor inhibitor cycling or switching to a new mecha-
nism of action therapy: Real-world observational study of rheumatoid arthritis patients in the United States with prior tumor
necrosis factor inhibitor therapy. Adv. Ther. 34, 1936–1952 (2017).
38. Todoerti, M. et al. Switch or swap strategy in rheumatoid arthritis patients failing TNF inhibitors? Results of a modified Italian
Expert Consensus. Rheumatology 57, vii42-cii53 (2018).
Scientific Reports | (2021) 11:15051 | https://doi.org/10.1038/s41598-021-94504-x 9
Vol.:(0123456789)www.nature.com/scientificreports/
39. Hunter, T., Schroeder, K., Sandoval, D. & Deodhar, A. Persistence, discontinuation, and switching patterns of newly initiated TNF
inhibitor therapy in ankylosing spondylitis patients in the United States. Rheumatol. Ther. 6, 207–215 (2019).
40. Bakker, M., Jacobs, J., Verstappen, S. & Bijlsma, J. Tight control in the treatment of rheumatoid arthritis: Efficacy and feasibility.
Ann. Rheum. Dis. 66, iii56–iii60 (2007).
41. Grigor, C. et al. Effect of a treatment strategy of tight control for rheumatoid arthritis (the TICORA study): A single-blind ran-
domised controlled trial. Lancet 364, 263–269 (2004).
42. Tucker, L. J., Ye, W. & Coates, L. C. Novel concepts in psoriatic arthritis management: Can we treat to target?. Curr. Rheumatol.
Rep. 20, 71 (2018).
43. Schoels, M. M., Aletaha, D., Alasti, F. & Smolen, J. S. Disease activity in psoriatic arthritis (PsA): Defining remission and treatment
success using the DAPSA score. Ann. Rheum. Dis. 75, 811–818 (2016).
44. Saber, T. P. et al. Remission in psoriatic arthritis: Is it possible and how can it be predicted?. Arthritis Res. Ther. 12, 1–6 (2010).
45. Lindqvist, U. et al. DAPSA, DAS28 and MDA predict long-term treatment regime in psoriatic arthritis. The Swedish early psoriatic
arthritis cohort. Clin. Exp. Rheumatol. 35, 936–942 (2017).
46. Gladman, D., Antoni, C., Mease, P., Clegg, D. & Nash, P. Psoriatic arthritis: Epidemiology, clinical features, course, and outcome.
Ann. Rheum. Dis. 64, ii14–ii17 (2005).
Acknowledgements
We gratefully thank all the researchers of BIOBADASER group for their collaboration. We thank Jesus T Sanchez-
Costa and Nuria Montero for his help as CRAs in BIOBADASER.
Author contributions
C.S.-P. and F.D.-G. designed the study. C.S.-P. and F.S.-A. contributed to the data management and statistical
analysis. C.S.-P. and F.D.-G. draft the publication and all authors were involved in revising the article critically. All
authors have contributed to the discussion and interpretation of the results. The final version of the manuscript
was read and approved by all authors.
Funding
This research is supported by the Research Unit of the Spanish Society of Rheumatology. BIOBADASER is
supported by the Spanish Agency of Drugs and Medical Devices (AEMPS), Biogen, Bristol-Myers and Squibb
(BMS), Celltrion, Janssen, Lilly, Merck Sharp and Dohme (MSD), Novartis, Pfizer, Regeneron, Roche and Sam-
sung Bioepis.
Competing interests
Dra Diana Sueiro-Delgado reports other from GSK, other from PFIZER, other from NOVARTIS, other from
ABBVIE, outside the submitted work. Dra. Blanca Garcia-Magallon reports personal fees from MSD, non-
financial support from MSD, personal fees from Celgene, personal fees from Amgen, personal fees from Pfizer,
outside the submitted work. Dra. Yanira Perez-Vera reports non-financial support from ROCHE, non-financial
support from ABBVIE, non-financial support from MSD, non-financial support from UCB PHARMA, outside
the submitted work. Other authors have no conflict of interest.
Additional information
Supplementary Information The online version contains supplementary material available at https://doi.org/
10.1038/s41598-021-94504-x.
Correspondence and requests for materials should be addressed to F.D.-G.
Reprints and permissions information is available at www.nature.com/reprints.
Publisher’s note Springer Nature remains neutral with regard to jurisdictional claims in published maps and
institutional affiliations.
Open Access This article is licensed under a Creative Commons Attribution 4.0 International
License, which permits use, sharing, adaptation, distribution and reproduction in any medium or
format, as long as you give appropriate credit to the original author(s) and the source, provide a link to the
Creative Commons licence, and indicate if changes were made. The images or other third party material in this
article are included in the article’s Creative Commons licence, unless indicated otherwise in a credit line to the
material. If material is not included in the article’s Creative Commons licence and your intended use is not
permitted by statutory regulation or exceeds the permitted use, you will need to obtain permission directly from
the copyright holder. To view a copy of this licence, visit http://creativecommons.org/licenses/by/4.0/.
© The Author(s) 2021
Scientific Reports | (2021) 11:15051 | https://doi.org/10.1038/s41598-021-94504-x 10
Vol:.(1234567890)You can also read