The Hot-Dry-Windy Index: A New Fire Weather Index - MDPI
←
→
Page content transcription
If your browser does not render page correctly, please read the page content below
atmosphere
Article
The Hot-Dry-Windy Index: A New Fire Weather Index
Alan F. Srock 1 , Joseph J. Charney 2, *, Brian E. Potter 3 and Scott L. Goodrick 4
 1   Department of Atmospheric & Hydrologic Sciences, St. Cloud State University, 720 4th Avenue South,
     St. Cloud, MN 56301, USA; afsrock@stcloudstate.edu
 2   Northern Research Station, U.S. Forest Service, 3101 Technology Blvd., Suite F, Lansing, MI 48910, USA
 3   Pacific Northwest Research Station, U.S. Forest Service, 400 N 34th Street, Suite 201, Seattle, WA 98103, USA;
     bpotter@fs.fed.us
 4   Southern Research Station, U.S. Forest Service, 320 Green Street, Athens, GA 30602, USA;
     sgoodrick@fs.fed.us
 *   Correspondence: jcharney@fs.fed.us

 Received: 13 April 2018; Accepted: 16 July 2018; Published: 19 July 2018

 Abstract: Fire weather indices are commonly used by fire weather forecasters to predict when weather
 conditions will make a wildland fire difficult to manage. Complex interactions at multiple scales
 between fire, fuels, topography, and weather make these predictions extremely difficult. We define
 a new fire weather index called the Hot-Dry-Windy Index (HDW). HDW uses the basic science of
 how the atmosphere can affect a fire to define the meteorological variables that can be predicted at
 synoptic-and meso-alpha-scales that govern the potential for the atmosphere to affect a fire. The new
 index is formulated to account for meteorological conditions both at the Earth’s surface and in a
 500-m layer just above the surface. HDW is defined and then compared with the Haines Index
 (HI) for four historical fires. The Climate Forecast System Reanalysis (CFSR) is used to provide the
 meteorological data for calculating the indices. Our results indicate that HDW can identify days
 on which synoptic-and meso-alpha-scale weather processes can contribute to especially dangerous
 fire behavior. HDW is shown to perform better than the HI for each of the four historical fires.
 Additionally, since HDW is based on the meteorological variables that govern the potential for the
 atmosphere to affect a fire, it is possible to speculate on why HDW would be more or less effective
 based on the conditions that prevail in a given fire case. The HI, in contrast, does not have a physical
 basis, which makes speculation on why it works or does not work difficult because the mechanisms
 are not clear.

 Keywords: fire weather; index; Haines Index

1. Introduction
     Predicting when weather conditions will make a wildland fire difficult to manage is important
but extremely difficult. Complex interactions at multiple scales between fire, fuels, topography,
and weather (e.g., [1]) combined with imperfect input data and insufficient model resolution make it
practically impossible to produce perfect forecasts of fire conditions. Some researchers have tried to
account for these interactions by using statistical analyses (e.g., [2–5]). The tools developed by these
researchers have usefulness in certain situations, but often fail when tried at different locations or with
different data because they are inherently dependent upon the input data and events used to define
the tools [6,7].
     For this study, we want to isolate the effects of weather on a wildland fire, so we define a fire
weather index (FWI) as an index that includes only weather inputs and thus does not include explicit
or implicit information about the state of wildland fuels or topography. Using this definition, the only
FWIs in the literature are the Lower Atmospheric Severity Index (a.k.a. the Haines Index (HI) [2,8]),

Atmosphere 2018, 9, 279; doi:10.3390/atmos9070279                              www.mdpi.com/journal/atmosphere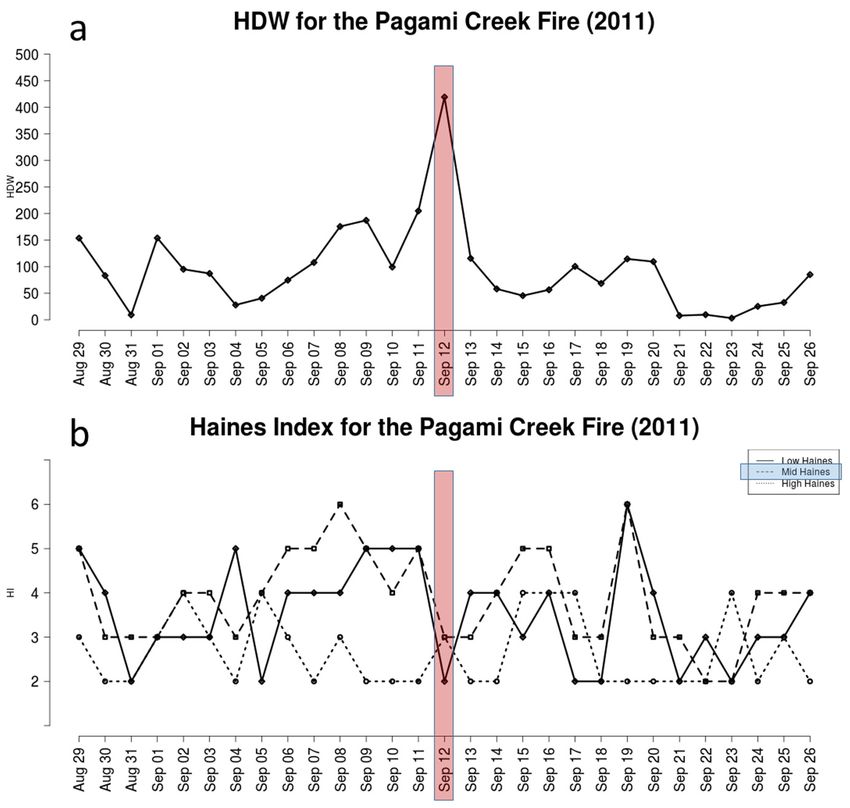
Atmosphere 2018, 9, 279                                                                              2 of 11

the Angström Index [3], and a logistic-regression-based FWI recently developed for the Northeast
United States [4]. Of these FWIs, only the HI is widely used operationally to predict when weather
conditions will make a wildland fire difficult to manage.
      The new FWI defined in this article is based on a physical, non-statistical understanding of
fire–atmosphere interactions. Ask any wildland fire expert about the weather components that
lead to difficult fire conditions and the expert will reply with some combination of “hot, dry,
and windy”. The key atmospheric variables underlying “hot, dry, and windy”—temperature, moisture,
and wind—have direct physical effects on wildland fires. Our index is based on these variables,
so we call our index the Hot-Dry-Windy Index (HDW). HDW, like any meteorological index, seeks to
synthesize information about the state of the atmosphere into a quantity that can be used to assess the
potential for certain types of atmospheric phenomena to occur. We want to establish and analyze this
new FWI only in the context of meteorological factors—if HDW cannot adequately represent weather
conditions, then the index’s validity would be in doubt.
      A key challenge for defining an FWI is identifying temporal and spatial scales at which we can
adequately quantify and test the index. At small scales, deterministic predictions of temperature,
moisture, and wind variations that can affect a fire are practically impossible due to microscale
(scales of motion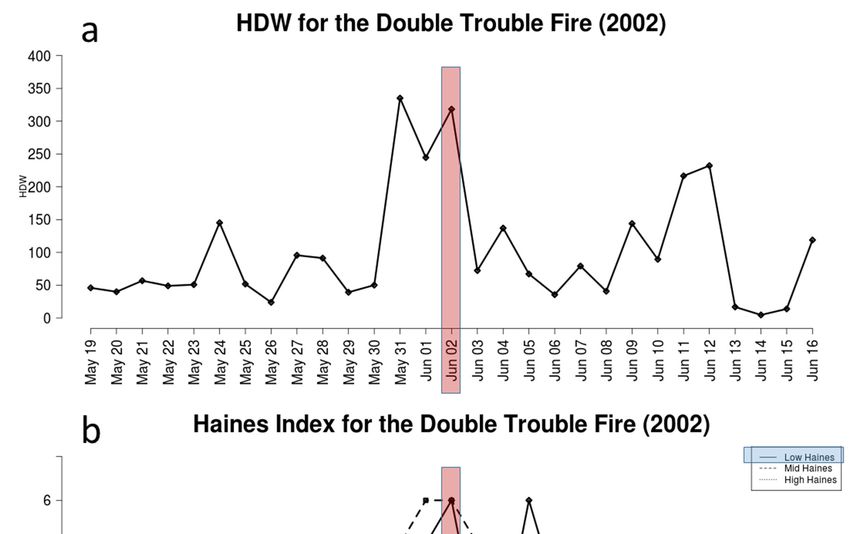
Atmosphere 2018, 9, 279                                                                             3 of 11

2. The Hot-Dry-Windy Index (HDW)
     We begin our description of HDW by analyzing how the atmosphere physically affects a fire.
The atmosphere generally affects a fire through three primary state variables—wind, temperature,
and moisture (e.g., [14]). At large scales, the effect of wind is straightforward—a stronger wind
generally indicates that a wildland fire will spread more quickly and be more difficult to contain or
control (e.g., [15]). While wind shifts can also significantly affect fire behavior, they are inherently
smaller scale and thus are not included in this formulation of HDW.
     The effects of atmospheric heat and moisture on a fire are more difficult to quantify because these
two variables do not have independent effects on a fire. Instead, as Ref. [15] states, the primary effect
of both atmospheric heat and moisture on a fire is to alter the rate at which moisture evaporates from
fuels, which in turn affects fuel consumption, fire spread, and fire intensity. Thus, HDW uses a variable
that combines atmospheric heat and moisture into one factor.
     Historically, the fire community has used relative humidity (RH) as its preferred metric for
combining temperature and humidity into one term (e.g., [16,17]). RH is defined as the ratio of the
vapor pressure (e), a variable dependent solely on absolute moisture content (q), to the saturation
vapor pressure (es ), a variable dependent solely on temperature (T), times 100%:

                                    RH (T,q) = [e(q)/es (T)] × 100%                                    (1)

     However, RH can mask the total amount of evaporation that is possible at a given temperature.
For example, 20% RH air at 0 ◦ C can become saturated by increasing the vapor pressure by 4.9 hPa,
while 20% RH air at 30 ◦ C will only reach saturation when the vapor pressure is increased by 34.0 hPa.
Although the RH is the same in both examples, the combined effect of T and q on the fire environment
will be different. An essential element of our HDW formulation is that the key quantity for assessing
the amount of possible evaporation is the difference—not the ratio—between es and e at a given
temperature [17]; larger differences between es and e are associated with larger evaporation rates in
plant environments (e.g., [18,19]). A common variable for assessing the effect of the difference between
es and e in a fire environment is the vapor pressure deficit (VPD; e.g., [19–24]):

                                        VPD (T,q) = es (T) − e(q)                                      (2)

     VPD better accounts for the combined effect of temperature and moisture because a larger (smaller)
VPD directly correlates to a faster (slower) evaporation rate, which is in turn associated with a greater
(lesser) potential for the atmosphere to affect a fire.
     To calculate HDW, we simply multiply the wind speed (U) by the VPD:

                                         HDW = U × VPD(T,q)                                            (3)

     Using an index based on wind speed multiplied by the VPD ensures that HDW will be applicable
everywhere because wind speed, temperature, and humidity can be observed or simulated at any
point in the Earth’s atmosphere. Since both U and VPD are continuously varying quantities that are
greater than or equal to zero, HDW values will always be greater than or equal to zero. This also means
that HDW will be continuous, with none of the artificial break points or sign changes that occur in
other indices (e.g., the HI, [2], the Fosberg Fire Weather Index, [10,11], the National Fire Danger Rating
System, [25,26]). We acknowledge that simply multiplying U and VPD is a limitation of HDW, but it
appears to work at a basic level because our analyses have indicated that this simple formulation is
able to discriminate the “worst” days on a given fire. Additional testing of other formulations could be
undertaken to determine if more skillful combinations of U and VPD exist. For simplicity, HDW uses
common meteorological units: m s−1 for wind speed and hPa for VPD.
     The depth of the atmosphere that will affect a fire can vary greatly from one fire to another, so we
developed HDW to consider the weather conditions that are most likely to interact with the surface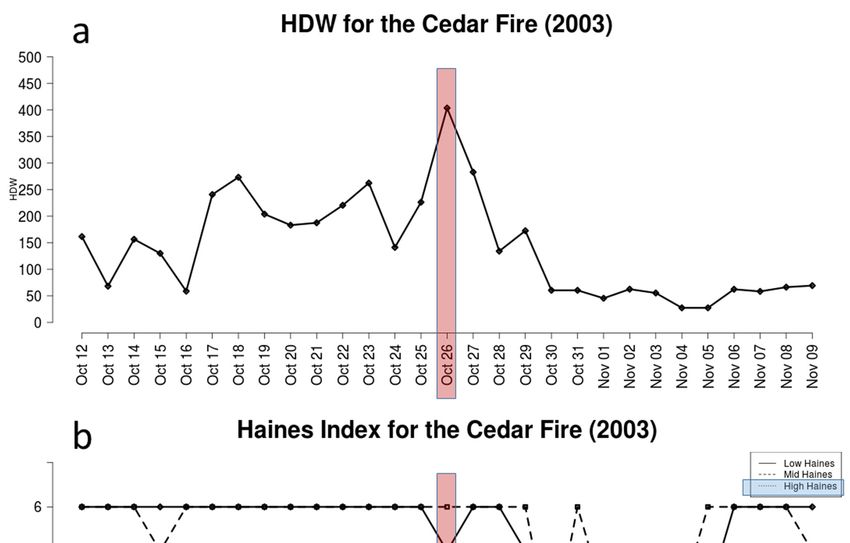
Atmosphere 2018, 9, 279                                                                              4 of 11

during the burning period on a given day. The daytime mixed layer is nearly always >500 m deep over
land everywhere in the world (particularly on days when wildland fires are active), so we define HDW
to use a 500-m layer just above the surface for its weather information. Choosing a deeper analysis
layer (e.g., 1000 m or greater) would more often introduce weather conditions at some locations into
HDW that would not affect a fire; the top of the deeper analysis layer will often be above the top of the
observed mixed layer and air above the boundary layer is far less likely to affect the fire directly.
     We also want HDW to identify the potential for the worst fire conditions due to large-scale
weather effects, so, for a given instant in time, we compute the surface-adjusted VPD that would result
from adiabatically lowering air from each level in the lowest 500 m to the surface. We then select
the highest wind speed and the highest surface-adjusted VPD from any level in the lowest 500 m to
calculate HDW. This means that the maximum VPD value and maximum wind speed might occur at
different vertical levels, but near-surface mixing makes it possible that both the extracted VPD and
wind speed maxima could affect the fire at some time on a given day.
     Since we want to assess the influence of predictable, large-scale components of weather forecasts
at multiple-day lead times, we also need to define a valid time scale to achieve this goal. Taking the
maximum HDW value for each day will produce a fire weather forecast that indicates the potential
for a fire to become difficult to manage in a multi-day comparative analysis. That day can then be
analyzed further to focus on the atmospheric features that caused a given day’s HDW value to peak
and assess how those features might affect a fire.
     Finally, since HDW is not derived from a physical or dynamical formula that applies to fire
activity, the units of HDW do not have an established physical significance for fire processes. To limit
the potential for confusion among prospective users of the index, we recommend that units of hPa be
used for the VPD and that units of m s−1 be used for U when calculating the value of HDW, but that
the units of HDW (hPa m s−1 ) be ignored.

3. Evaluating HDW with Historical Fires
     HDW needs to identify days when historical fires were difficult to manage if it is to have value as
a forecast index. In this section, we demonstrate the application of HDW to four wildfires in the United
States that represent a range of topographic and meteorological conditions in which fire behavior
made a fire difficult to manage, since weather conditions, and in particular diurnal variations in
near-surface weather, are strongly dependent upon topography. To do this, we need a meteorological
dataset that is consistent over a long period of time with sufficient temporal and spatial resolution to
assess the influence of predictable, synoptic-and meso-alpha-scale components of weather forecasts at
multiple-day lead times. NCEP’s Climate Forecast System Reanalysis (CFSR; [27]) was chosen as the
best dataset for this analysis. The CFSR has 0.5-degree grid spacing, begins in 1979, covers the entire
Earth, has a sufficiently small grid spacing that can resolve synoptic and meso-alpha processes, is being
updated in near-real-time as the Climate Forecast System (CFSv2; [28]), and is freely available. Because
the vertical resolution of the CFSR is somewhat coarse (either 25 or 50 hPa intervals), we calculate
HDW using the maximum wind speed and VPD from the surface and every pressure level up to and
including the first level above 50 hPa above the surface. In most locations, 50 hPa above the surface is
close to 500 m above the surface, which is the level we identified in the previous section as desirable
for HDW. The choice of a 50 hPa-deep layer ensures that there are always at least three model levels
used in the analysis: the surface, the first level above the surface, and the first level above 50 hPa.
At CFSR grid points where the surface pressure is greater than 800 hPa, four levels are used. CFSR has
6-h output, so we take the maximum HDW value for each data point from 1200, 1800, and 0000 UTC
(approximately the daytime period for most of the United States).
     Table 1 lists the names and locations of the fires we selected and the day on each fire that exhibited
the most significant fire behavior according to fire reports. For each fire, we present a 29-day time
series of HDW using CFSR data at the land-based point closest to the starting location of the fire,
centered on the day when the fire was most difficult to manage. Early HDW testers requested a
Atmosphere 2018, 9, 279 5 of 11
comparison to the HI, which is the only fire weather index that is widely used operationally to predict
when above-ground weather conditions will make a wildland fire difficult to manage. To compare
HDW with the HI, we also present the Low, Mid, and High variants of the HI for the same time series
using the same CFSR data used to calculate HDW. For calculating the HI, we follow the methodology
recommended in Ref. [2] and use 0000-UTC data to find the lapse rate and dewpoint depression
required for each HI variant. Note that HI does not include any information about winds. We depart
from the methodology recommended in Ref. [2] by presenting all three variants at each location for
comparison with HDW, rather than choosing a single variant based on the climatic divisions identified
in the paper. Atmosphere
For reference, we
2018, 9, x FOR highlight
PEER REVIEW the variant that should be used at each location 5 of 11 based on the
climatic divisions identified
depression required for in each
thatHIpaper.
variant. Note that HI does not include any information about winds.
We depart from the methodology recommended in Ref. [2] by presenting all three variants at each
location for comparisonTable Historical
with1.HDW, rather fires
than analyzed
choosing a in thisvariant
single study.based on the climatic
divisions identified in the paper. For reference, we highlight the variant that should be used at each
location based on Event
Wildfire the climatic
(State)divisions identified in that
Significant Fire paper.
Behavior Day Fire Location
Pagami Creek (MN) Table 1. Historical
12 September 2011in this study.
fires analyzed 47.9◦ N; 91.3◦ W
Bastrop County Complex (TX) 4 September 2011 30.2◦ N; 97.2◦ W
Double Trouble
Wildfire (NJ)
Event (State) 2 June 2002 Fire Behavior Day
Significant Fire◦ Location
39.8 N; 74.2◦ W
Cedar (CA) 26 September
October 2003 33.0 ◦ ◦W
Pagami Creek (MN) 12 2011 47.9° N;
N;116.7
91.3° W
Bastrop County Complex (TX) 4 September 2011 30.2° N; 97.2° W
Double Trouble (NJ) 2 June 2002 39.8° N; 74.2° W
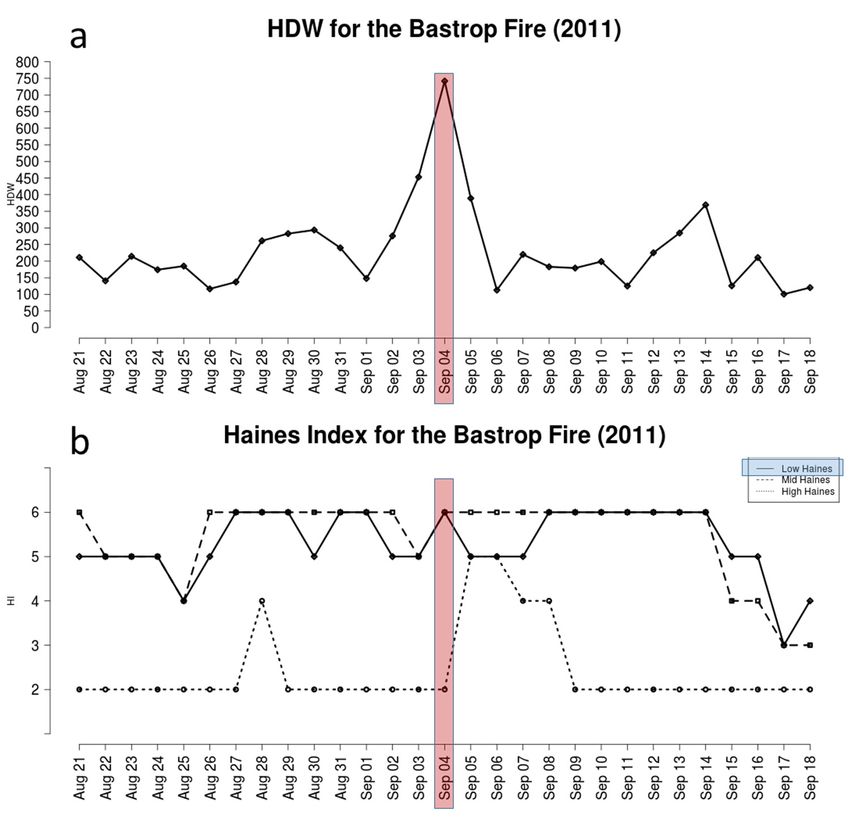
3.1. Pagami Creek Fire (MN, 2011)
Cedar (CA) 26 October 2003 33.0° N; 116.7° W
We begin with the Pagami Creek Fire, a 37,507-ha fire that occurred in the Boundary Waters
3.1. Pagami Creek Fire (MN, 2011)
Canoe Area Wilderness of the Superior National Forest in northern Minnesota, USA. The Pagami
We begin with the Pagami Creek Fire, a 37,507-ha fire that occurred in the Boundary Waters
Creek Fire started
Canoe onArea18Wilderness
August 2011
of the and continued
Superior to burn
National Forest into November.
in northern Sexton
Minnesota, USA. et al. [29] identifies
The Pagami
12 SeptemberCreek
as theFiredate ononwhich
started the 2011
18 August most “active
and fire
continued to behavior” was reported.
burn into November. Figure
Sexton et al. [29] 1a shows a
identifies 12 September as the date on which the most “active fire behavior” was reported. Figure 1a
time series of HDW from 29 August through 26 September for the CFSR grid point closest to the fire
shows a time series of HDW from 29 August through 26 September for the CFSR grid point closest
location. Thetotime series
the fire indicates
location. The time that
seriesHDW
indicatesspiked
that HDWonspiked
12 September, so HDW
on 12 September, so HDWidentified
identified the date on
which the mostthe active
date onfire behavior
which the most occurred. This result
active fire behavior suggests
occurred. that
This result the active
suggests that thefire behavior
active fire observed
behavior observed on 12 September was at least partially due to synoptic-and meso-alpha-scale
on 12 September was at least partially due to synoptic-and meso-alpha-scale weather features.
weather features.
Figure 1. Time series using CFSR data at 48.0° N latitude and 91.5° W longitude from 29 August
Figure 1. Time series26using CFSR ◦ N latitude and 91.5◦ W longitude from 29 August through
through September 2011data
of (a)at 48.0and
HDW (b) Low (solid line), Mid (dashed line), and High (dotted
26 Septemberline)2011 of (a)
variants HDW
of the Hainesand
Index.(b) Low
The (solid
vertical, line),
shaded, Mid (dashed
red rectangles line),
indicate the day and High
on which the (dotted line)
variants of the Haines Index. The vertical, shaded, red rectangles indicate the day on which the most
rapid fire growth occurred on the Pagami Creek Fire. The Haines Index variant that is recommended
for this location is shaded in blue.Atmosphere 9, 2799, x FOR PEER REVIEW
2018, 2018,
Atmosphere 6 of 116 of 11
most rapid fire growth occurred on the Pagami Creek Fire. The Haines Index variant that is
Figure 1b shows time
recommended series
for this of the
location threeinHI
is shaded variants for the same time period. None of the variants
blue.
indicate a spike on 12 September, although the Low and Mid variants were a 5 on 11 September.
However,Figure 1b shows
the Mid variant time series of
reached the three
a value of 6HIon
variants for the same
8 September, and time
was period.
a 5 on None of the as
9 September
well. Ref. [29] identifies 11 September as a day on which active fire behavior occurred, but on
variants indicate a spike on 12 September, although the Low and Mid variants were a 5 11 fire
active
September. However, the Mid variant reached a value of 6 on 8 September, and was a 5 on 9
behavior was not observed on the previous three days. Thus, HDW identifies the specific day on
September as well. Ref. [29] identifies 11 September as a day on which active fire behavior occurred,
which the Pagami Creek Fire was most difficult to manage while the HI does not, although the HI may
but active fire behavior was not observed on the previous three days. Thus, HDW identifies the
have specific
had somedayvalue on other
on which days for
the Pagami thisFire
Creek event.
was most difficult to manage while the HI does not,
although the HI may have had some value on other days for this event.
3.2. Bastrop County Complex (TX, 2011)
3.2. Bastrop
The BastropCounty
County Complex
Complex(TX,(2011)
2011) was a group of fires that occurred near Bastrop, TX, USA [30,31].
The fires burned 13,903
The Bastrop ha, destroyed
County 1799 was
Complex (2011) structures,
a groupand caused
of fires two fatalities.
that occurred The fires
near Bastrop, TX,started
USA on
[30,31]. The fires burned 13,903 ha, destroyed 1799 structures, and caused two
4 September, which was also the day on which the most active fire behavior was reported, the largestfatalities. The fires area
started on 4 September, which was also the day on which the most active fire behavior
was burned, and the fires were most difficult to manage. Figure 2 shows time series of HDW (Figure 2a) was reported,
the three
and the largestHI
area was burned,
variants and2b)
(Figure thefrom
fires were most difficult
21 August through to manage. Figure 2The
18 September. showsHDW timetime
seriesseries
of HDW (Figure 2a) and the three HI variants (Figure 2b) from 21 August through 18 September. The
indicates a clear maximum on 4 September. The Low and Mid HI time series reach a value of 6 on
HDW time series indicates a clear maximum on 4 September. The Low and Mid HI time series reach
4 September, and the Low HI is higher on 4 September than on the days before and after. However,
a value of 6 on 4 September, and the Low HI is higher on 4 September than on the days before and
both after.
the Low and Mid
However, both HI reachand
the Low a value
Mid HIofreach
6 fora value
multiple days
of 6 for earlierdays
multiple andearlier
laterand
in the
latertime
in theseries.
This analysis
time series. This analysis shows that HDW can also identify days where an initiating fire may spread due
shows that HDW can also identify days where an initiating fire may spread rapidly
to large-scale
rapidly due weather conditions,
to large-scale weatherwhile the HI while
conditions, does the
not HI
clearly differentiate
does not the most the
clearly differentiate difficult
most day
from difficult
other daysday in theother
from timedays
series.
in the time series.
FigureFigure 2. Time
2. Time seriesseries
usingusing
CFSRCFSR
data data at◦30.0°
at 30.0 N latitude
N latitude and ◦97.0°
and 97.0 W longitude
W longitude fromfrom 21 August
21 August through
through 18 September 2011 of (a) HDW and (b) Low (solid line), Mid (dashed line), and High (dotted
18 September 2011 of (a) HDW and (b) Low (solid line), Mid (dashed line), and High (dotted line)
variants of the Haines Index. The vertical, shaded, red rectangles indicate the day on which the most
rapid fire growth occurred on the Bastrop Fire. The Haines Index variant that is recommended for this
location is shaded in blue.Atmosphere 2018, 9, x FOR PEER REVIEW 7 of 11
line) variants of the Haines Index. The vertical, shaded, red rectangles indicate the day on which the
Atmosphere 2018, 9, 279 7 of 11
most rapid fire growth occurred on the Bastrop Fire. The Haines Index variant that is recommended
for this location is shaded in blue.
3.3. Double Trouble Fire (NJ, 2002)
3.3. Double Trouble Fire (NJ, 2002)
Figure 3 presents time series of HDW and the HI variants for the Double Trouble Fire, which was
Figure 3 presents time series of HDW and the HI variants for the Double Trouble Fire, which
a 526-ha, single-day event that occurred on 2 June near Beachwood, NJ, USA [32,33]. The HDW time
was a 526-ha, single-day event that occurred on 2 June near Beachwood, NJ, USA [32,33]. The HDW
series
time(Figure 3a) shows
series (Figure that, for
3a) shows thefor
that, period indicated
the period in theinfigure,
indicated HDW
the figure, was was
HDW relatively highhigh
relatively on 2onJune.
The2 June. The analysis also shows that HDW was even higher on 31 May, two days earlier. Since there no
analysis also shows that HDW was even higher on 31 May, two days earlier. Since there was
fire
wasonnothat
fireday at this
on that daylocation, it is notitpossible
at this location, based on
is not possible thisonanalysis
based to state
this analysis whether
to state the higher
whether the
HDWhighervalue
HDW onvalue
31 May on corresponded to a daytoona which
31 May corresponded day onactive
whichfire behavior
active would would
fire behavior have occurred.
have
This analysis
occurred. suggests
This analysisthat HDWthat
suggests might
HDW have some
might value
have in identifying
some days where
value in identifying daysfires
wherethat were
fires
started (prescribed or otherwise) can become difficult to manage.
that were started (prescribed or otherwise) can become difficult to manage.
Figure3.3.Time
Figure Timeseries
seriesusing
usingCFSR
CFSR data
data at
at 40.0°
40.0◦ N
Nlatitude
latitudeand
and74.0°
74.0W◦W longitude from
longitude 19 19
from May through
May through
16 June 2002 of (a) HDW and (b) Low (solid line), Mid (dashed line), and High (dotted line) variants
16 June 2002 of (a) HDW and (b) Low (solid line), Mid (dashed line), and High (dotted line) variants of
of the Haines Index. The vertical, shaded, red rectangles indicate the day on which the most rapid fire
the Haines Index. The vertical, shaded, red rectangles indicate the day on which the most rapid fire
growth occurred on the Double Trouble fire. The Haines Index variant that is recommended for this
growth occurred on the Double Trouble fire. The Haines Index variant that is recommended for this
location is shaded in blue.
location is shaded in blue.
The time series of HI variants (Figure 3b) show the Low and Mid HI reaching values of 5 and 6,
The time series
respectively, on the of
dayHIofvariants (Figure
the fire, but 3b)exhibits
the HI show the Lowvalues
similar and Mid HI reaching
on days values
before and of 5fire.
after the and 6,
respectively, on the day of the fire, but the HI exhibits similar values on days before and after the fire.
It is also noteworthy that HI on 31 May is similar to several other days in the time series, while HDW
reached its highest point in the time series on that date.Atmosphere 2018, 9, x FOR PEER REVIEW 8 of 11
Atmosphere 2018, 9, 279 8 of 11
It is also noteworthy that HI on 31 May is similar to several other days in the time series, while HDW
reached its highest point in the time series on that date.
3.4. Cedar Fire (CA, 2003)
3.4. Cedar Fire (CA, 2003)
The 2003 Cedar Fire burned 113,424 ha near Julian, CA, USA, destroyed 355 structures,
The 2003
and destroyed 151Cedar Fire[34].
vehicles burnedThe113,424 ha near
fire started onJulian, CA, USA,
23 October destroyed
and spread 355 structures,
rapidly toward the andwest,
destroyed 151 vehicles [34]. The fire started on 23 October and spread rapidly toward the west, with
with the largest spread day occurring on 26 October as a Santa Ana wind event developed [35].
the largest spread day occurring on 26 October as a Santa Ana wind event developed [35].
Countryman et al. [36] indicates that Santa Ana weather events often exacerbate wildfires that
Countryman et al. [36] indicates that Santa Ana weather events often exacerbate wildfires that burn
burnlarge
largeareas
areasin in
thethe autumn
autumn andand winter
winter in southern
in southern California,
California, USA. Santa
USA. Since Since Ana
Santa Ana are
events events
are characterized
characterized by by strong
strong winds,
winds,highhightemperatures,
temperatures, and
and lowlow atmospheric
atmospheric moisture
moisture (large
(large VPDs),
VPDs),
HDW HDW should generally be high during Santa Ana events. However, the spatial scale of the Santa Ana Ana
should generally be high during Santa Ana events. However, the spatial scale of the Santa
mustmust
be large enough
be large enough to to
beberesolved
resolvedininthe theCFSR
CFSR dataset
dataset forforour
ouranalysis
analysis to to
be be able
able to diagnose
to diagnose the the
resulting
resulting atmospheric
atmospheric effects.
effects.
Figure
Figure 4 shows
4 shows timetime series
series of HDW
of HDW (Figure
(Figure 4a)4a)and
andthe
thethree
threeHI HIvariants
variants (Figure
(Figure 4b).
4b). As
As with
with the
the three previous fires we analyzed, the HDW time series indicates
three previous fires we analyzed, the HDW time series indicates a clear maximum on the day a clear maximum on the day when
when the fire was most difficult to manage. Unlike most days when the maximum
the fire was most difficult to manage. Unlike most days when the maximum HDW comes from 1800 or HDW comes from
1800 or 0000 UTC (driven largely by daytime heating), the maximum HDW for 26 October at this
0000 UTC (driven largely by daytime heating), the maximum HDW for 26 October at this point occurred
point occurred at 1200 UTC, when the Santa Ana event was strongest. None of the HI variants
at 1200 UTC, when the Santa Ana event was strongest. None of the HI variants indicate that 26 October
indicate that 26 October should significantly differ from other days in the time series, most likely
should significantly
because differ
the HI does from
not otherwind,
consider days which
in the was
timeoneseries, most
of the mostlikely because
important the HIparameters
weather does not consider
for
wind,thewhich was one of the
spread of the Cedar Fire. most important weather parameters for the spread of the Cedar Fire.
Figure 4. Time series using CFSR data at 33.0◦ N latitude and 116.5◦ W longitude from 12 October
through 9 November 2003 of (a) HDW and (b) Low (solid line), Mid (dashed line), and High (dotted line)
variants of the Haines Index. The vertical, shaded, red rectangles indicate the day on which the most
rapid fire growth occurred on the Cedar Fire. The Haines Index variant that is recommended for this
location is shaded in blue.Atmosphere 2018, 9, 279 9 of 11
4. Discussion and Conclusions
We have developed HDW and investigated its ability to assess the influence of predictable,
synoptic- and meso-alpha-scale components of weather forecasts on wildland fires. HDW is calculated
by multiplying the vapor pressure deficit by the wind speed, which accounts for whether a fire could
become difficult to manage due to “hot and dry” and “windy” conditions, respectively. To account for
vertical variations in heat, moisture, and wind speed and to help forecast the potential for the worst
conditions that could affect a fire, HDW is defined as the product of the largest VPD and the highest
wind speed in a 500-m layer just above the surface. HDW is compared with the HI using CFSR model
output valid for four historical fires.
Our results indicate that HDW can identify days on which synoptic-and meso-alpha-scale weather
processes can contribute to especially dangerous fire behavior. HDW is also shown to perform better
than the HI when attempting to identify the day (or days) during each fire that has the potential to be
the most difficult to manage. While one or more variants of the HI reach high values on the day of
interest for some of the fires, HDW demonstrates superiority for this selection of fires that occurred in
different regions and that span a range of environmental conditions.
Additionally, it should be noted that since HDW is based on the meteorological variables that
govern the physics of fire processes, it is possible to speculate on why HDW would not be an effective
index in some cases. The HI, in contrast, does not have a physical basis, which makes speculation on
why it works or does not work difficult because the mechanisms are not clear.
By focusing on the multiple-day, predictable components of weather forecasts (i.e., synoptic-and
meso-alpha-scale processes), HDW produces a forecast that fire weather forecasters and fire managers
can use to anticipate when large-scale weather could make a wildland fire difficult to manage. Because
of this formulation, it is necessary for the fire manager to be aware of the potential for fine-scale
weather, topography, and fuel conditions to affect fire behavior and contribute to major management
difficulties—HDW will, by definition, miss those effects. Furthermore, even when HDW does identify
an anomalously high-risk day, it is always possible for local conditions to decrease or further increase
the management difficulties.
The analysis presented here does not represent an exhaustive investigation of HDW across the
full range of atmospheric phenomena that could affect whether a fire will become difficult to manage.
For example, HDW as presented here should not be expected to detect frontal wind shifts or outflows
from convective thunderstorms, which have a much shorter time scale than the CFSR input data.
Additional analyses are necessary before HDW should be used as an operational, decision-informing
forecast tool. These analyses include: (1) a statistical verification of the performance of the index
against one or more fire metrics and comparisons of HDW with existing fire indices that include
weather components; (2) climatological analyses to establish the significance of a particular value
of HDW at a given location; (3) testing HDW with model forecast data to determine whether there
are idiosyncrasies that develop from different sources of meteorological data with different model
physics, temporal, and spatial resolutions; and (4) examinations of how alternative formulations of
HDW (e.g., different analysis layers) vary on finer spatial and temporal scales (e.g., diurnal variations)
to investigate its potential for anticipating the effect of wind shifts, thunderstorm outflows, firebrand
transport and spotting, orographic circulations, and other complex phenomena during a wildland fire.
Author Contributions: A.F.S., J.J.C., B.E.P. and S.L.G. collectively conceived of this study; A.F.S. produced a first
draft of the manuscript, and J.J.C., B.E.P. and S.L.G. participated in editing and refining the manuscript into a
final form; A.F.S. and J.J.C. completed the numerical analyses and J.J.C. produced the figures; J.J.C. prepared the
manuscript for submission to Atmosphere.
Funding: This research was partially supported by Research Joint Venture Agreement 12-JV-11242306-067 between
the U.S. Forest Service, Northern Research Station, and Michigan State University.Atmosphere 2018, 9, 279 10 of 11
Acknowledgments: The authors thank Darren Clabo, Jessica McDonald, Julia Ruthford, Robyn Heffernan,
and Larry Van Bussum for insights provided in discussions during the development of this research. The authors
would also like to acknowledge the value of a series of serendipitous discussions that occurred at a number
of restaurants and pubs in Raleigh, NC, Portland, OR, and Minneapolis, MN, while attending conferences in
those locations.
Conflicts of Interest: The authors declare no conflicts of interest.
References
1. Countryman, C.M. The concept of fire environment. Fire Control Notes 1966, 27, 8–10.
2. Haines, D.A. A lower atmospheric severity index for wildland fire. Natl. Weather Dig. 1988, 13, 23–27.
3. Langholz, H.; Schmidtmayer, E. Meteorologische Verfahren zur Abschätzung des Waldbrandrisikos
(Meteorological methods for estimating forest fire risk). Allg. Forstz. 1993, 48, 394–396.
4. Erickson, M.J.; Charney, J.J.; Colle, B.A. Development of a fire weather index using meteorological
observations within the Northeast United States. J. Appl. Meteor. Climatol. 2016, 55, 389–402. [CrossRef]
5. Sharples, J.J.; McRae, R.H.D.; Weber, R.O.; Gill, A.M. A simple index for assessing fire danger rating.
Environ. Model. Softw. 2009, 24, 764–774. [CrossRef]
6. Finney, M.A.; Cohen, J.D.; McAllister, S.S.; Jolly, W.M. On the need for a theory of wildland fire spread. Int. J.
Wildland Fire 2013, 22, 25–36. [CrossRef]
7. Alexander, M.E.; Cruz, M.G. Are the applications of wildland fire behaviour models getting ahead of their
evaluation again? Environ. Model. Softw. 2013, 41, 65–71. [CrossRef]
8. Mills, G.A.; McCaw, W.L. Atmospheric Stability Environments and Fire Weather in Australia: Extending the Haines
Index; Technical Report 20; Centre for Australian Weather and Climate Research: Melbourne, Australia, 2010;
p. 151. Available online: http://www.cawcr.gov.au/technical-reports/CTR_020.pdf (accessed on 18 July 2018).
9. Orlanski, I. A rational subdivision of scales for atmospheric processes. Bull. Am. Meteorol. Soc. 1975, 56, 527–530.
10. Fosberg, M.A. Weather in wildland fire management: The fire weather index. In Proceedings of the
Conference on Sierra Nevada Meteorology, Lake Tahoe, CA, USA, 19–21 June 1978; pp. 1–4.
11. Goodrick, S.L. Modification of the Fosberg fire weather index to include drought. Int. J. Wildland Fire 2002,
11, 205–211. [CrossRef]
12. McArthur, A.G. Weather and Grassland Fire Behavior; Leaflet No. 100; Department of National Development,
Forestry and Timber Bureau: Canberra, Australia, 1966; p. 23.
13. McArthur, A.G. Fire Behaviour in Eucalypt Forests; Leaflet No. 107; Department of National Development,
Forestry and Timber Bureau: Canberra, Australia, 1967; p. 25.
14. Ottmar, R.D. Wildland fire emissions, carbon, and climate: Modeling fuel consumption. For. Ecol. Manag.
2014, 317, 41–50. [CrossRef]
15. Rothermel, R.C. A Mathematical Model for Predicting Fire Spread in Wildland Fuels; Research Paper INT-115;
USDA Forest Service: Washington, DC, USA, 1972; p. 40.
16. Potter, B.E. Atmospheric interactions with wildland fire behavior—I. Basic surface interactions,
vertical profiles and synoptic structures. Int. J. Wildland Fire 2012, 21, 779–801. [CrossRef]
17. Seager, R.; Hooks, A.; Williams, A.P.; Cook, B.; Nakamura, J.; Henderson, N. Climatology, variability,
and trends in the US vapor pressure deficit, an important fire-related meteorological quantity. J. Appl.
Meteorol. Climatol. 2015, 54, 1121–1141. [CrossRef]
18. Kucera, C.L. Some relationships of evaporation rate to vapor pressure deficit and low wind velocity. Ecology
1954, 35, 71–75. [CrossRef]
19. Sellers, W.D. Physical Climatology; The University of Chicago Press: Chicago, IL, USA, 1965; p. 272.
20. Simard, A.J. The Moisture Content of Forest Fuels. I. A Review of Basic Concepts; Information Report FF-X-14;
Forest and Fire Research Institute, Forestry Branch, Department of Forestry and Rural Development:
Ottawa, ON, Canada, 1968; p. 47.
21. Pechony, O.; Shindell, D.T. Fire parameterization on a global scale. J. Geophys. Res. 2009, 114, D16115. [CrossRef]
22. Sedano, F.; Randerson, J.T. Multi-scale influence of vapor pressure deficit on fire ignition and spread in
boreal forest ecosystems. Biogeosciences 2014, 11, 1309–1353. [CrossRef]
23. Abatzoglou, J.T.; Williams, A.P. Impact of anthropogenic climate change on wildfire across western US forests.
Proc. Natl. Acad. Sci. USA 2016, 113, 11770–11775. [CrossRef] [PubMed]Atmosphere 2018, 9, 279 11 of 11
24. Abatzoglou, J.T.; Balch, J.K.; Bradley, B.A.; Kolden, C.A. Human-related ignitions concurrent with high
winds promote large wildfires across the USA. Int. J. Wildland Fire 2018, 27, 377–386. [CrossRef]
25. Bradshaw, L.S.; Deeming, J.E.; Burgan, R.E.; Cohen, J.D. The 1978 National Fire-Danger Rating System;
General Technical Report INT-169; USDA Forest Service: Washington, DC, USA, 1983; p. 44.
26. Schlobohm, P.; Brain, J. Gaining an Understanding of the National Fire Danger Rating System; NFES #2665;
US National Wildfire Coordinate Group: Boise, ID, USA, 2002; p. 71.
27. Saha, S.; Coauthors. The NCEP Climate Forecast System Reanalysis. Bull. Am. Meteorol. Soc. 2010, 91,
1015–1057. [CrossRef]
28. Saha, S.; Moorthi, S.; Wu, X.; Wang, J.; Nadiga, S.; Tripp, P.; Behringer, D.; Hou, Y.T.; Chang, H.Y.; Iredell, M.;
et al. The NCEP climate forecast system version 2. J. Clim. 2014, 27, 2185–2208. [CrossRef]
29. Sexton, T.; Menakis, J.; Pence, M. Pagami Creek Fire: Summary of Decisions and Information Used in
Making Decisions; Superior National Forest: Duluth, MN, USA, 2012; p. 42.
30. Huffman, H.; Saginor, A. Texas tackles devastating fire season with complex, interagency response.
Fire Manag. Today 2012, 72, 8.
31. Rissel, S.; Ridenour, K. Ember production during the Bastrop Complex fire. Fire Manag. Today 2013, 72, 7–13.
32. Kaplan, M.L.; Huang, C.; Lin, Y.L.; Charney, J.J. The development of extremely dry surface air due to vertical
exchanges under the exit region of a jet streak. Meteor. Atmos. Phys. 2008, 102, 63–85. [CrossRef]
33. Charney, J.J.; Keyser, D. Mesoscale model simulation of the meteorological conditions during the 2 June 2002
Double Trouble State Park wildfire. Int. J. Wildland Fire 2010, 19, 427–448. [CrossRef]
34. Bowman, J. Cedar Fire 2003 after Action Report; IBA Report Number 08-46; City of San Diego Fire-Rescue
Department: San Diego, CA, USA, 2004; p. 17.
35. Raphael, M.N. The Santa Ana winds of California. Earth Interact. 2003, 7, 1–13. [CrossRef]
36. Countryman, C.M.; Fosberg, M.A.; Rothermel, R.C.; Schroeder, M.J. Fire weather and behavior of the 1966
Loop Fire. Fire Technol. 1968, 4, 126–141. [CrossRef]
© 2018 by the authors. Licensee MDPI, Basel, Switzerland. This article is an open access
article distributed under the terms and conditions of the Creative Commons Attribution
(CC BY) license (http://creativecommons.org/licenses/by/4.0/).You can also read


