Impact of New Chemotherapy Regimens on the Treatment Landscape and Survival of Locally Advanced and Metastatic Pancreatic Cancer Patients - MDPI
←
→
Page content transcription
If your browser does not render page correctly, please read the page content below
Journal of
           Clinical Medicine

Article
Impact of New Chemotherapy Regimens on the
Treatment Landscape and Survival of Locally
Advanced and Metastatic Pancreatic Cancer Patients
Markus Kieler 1 , Matthias Unseld 1 , Daniela Bianconi 1 , Martin Schindl 2 ,
Gabriela V. Kornek 1 , Werner Scheithauer 1 and Gerald W. Prager 1, *
 1    Department of Medicine I, Division of Oncology, Comprehensive Cancer Center Vienna, Medical University
      of Vienna, Währinger Gürtel 18-20, 1090 Vienna, Austria; markus.kieler@meduniwien.ac.at (M.K.);
      matthias.unseld@meduniwien.ac.at (M.U.); daniela.bianconi@meduniwien.ac.at (D.B.);
      gabriela.kornek@meduniwien.ac.at (G.V.K.); werner.scheithauer@meduniwien.ac.at (W.S.)
 2    Department of Surgery, Division of General Surgery, Pancreatic Cancer Unit, Comprehensive Cancer Center
      Vienna, Medical University of Vienna, Währinger Gürtel 18-20, 1090 Vienna, Austria;
      martin.schindl@meduniwien.ac.at
 *    Correspondence: gerald.prager@meduniwien.ac.at; Tel.: +43-1-40400-44500

 Received: 19 February 2020; Accepted: 26 February 2020; Published: 28 February 2020

 Abstract: Background: New chemotherapy regimens for the treatment of metastatic pancreatic cancer
 have changed the therapy paradigm. We aimed to assess their impact on the treatment landscape and
 clinical outcome at our academic institution. Methods: In this single institutional posthoc registry
 analysis, we assessed characteristics and survival rates from all patients with locally advanced and
 metastatic pancreatic cancer who started a systemic treatment between 01/2011 and 12/2017. Survival
 analyses were performed by Kaplan-Meier and Cox proportional hazards model. Results: A total of 301
 patients started a systemic treatment in the observation period. In the first line treatment, we observed
 a shift from the four different main regimens (gemcitabine/nab-paclitaxel, modified FOLFIRINOX,
 gemcitabine/oxaliplatin +/− erlotinib or gemcitabine alone) to gemcitabine/nab-paclitaxel and modified
 FOLFIRINOX that add up to more than 80% of administered first line treatments in each of the time
 cohorts (2011–2013 vs. 2014–2017). The rate for first line modified FOLFIRINOX treatment was balanced
 between the two groups (19% and 15%). Median overall survival differed significantly between the two
 time cohorts (8.89 versus 11.9 months, p = 0.035). Survival rates for different first to second line treatment
 sequences (modified FOLFIRINOX to gemcitabine/nab-paclitaxel, gemcitabine/nab-paclitaxel to
 fluoropyrimidines plus nanoliposomal irinotecan, or gemcitabine/nab-paclitaxel to fluoropyrimidines
 plus oxaliplatin) were not significantly different and median overall survival ranged from 14.27 to
 15.64 months. Conclusion: Our study provides real-world evidence for the effectiveness of the new
 chemotherapy regimens and underscores the importance of the choice of the front-line regimen when
 considering different sequencing strategies.

 Keywords: pancreatic ductal adenocarcinoma; treatment landscape; treatment patterns; treatment
 sequences; new chemotherapy regimens; nanoliposomal irinotecan; nab-paclitaxel; FOLFIRINOX

1. Introduction
     Pancreatic ductal adenocarcinoma (PAC) is projected to become the second leading cause of cancer
deaths in the United States, as well as Europe in the next decade. Unlike most other members of the
top five cancers with the highest number of cancer deaths, such as colorectal, breast, lung and prostate
cancer, its incidence is increasing [1,2]. One reason is that the majority of patients is diagnosed at a
metastatic or locally advanced disease stage, due to lack of specific symptoms in early stages and yet

J. Clin. Med. 2020, 9, 648; doi:10.3390/jcm9030648                                   www.mdpi.com/journal/jcm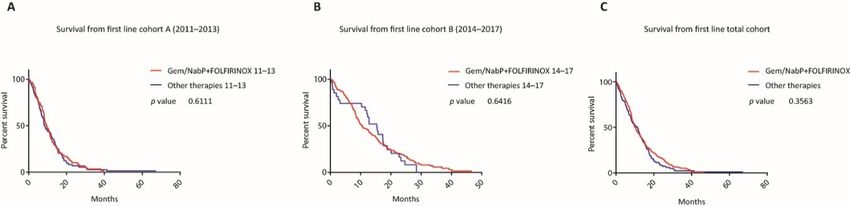
J. Clin. Med. 2020, 9, 648                                                                        2 of 15

no effective screening program [3]. In addition, high relapse rates after resection with curative intent
are observed. Thus, the five-year survival rate of pancreatic cancer ranges between~5 to 10% with no
raising numbers within the last 20 years [4]. Moreover, aggressive tumor biology and unresponsiveness
to most of the currently clinically tested molecularly targeted therapies, as well as immunotherapies,
which have revolutionized anti-cancer treatment in many other cancers, contribute to this devastating
prognosis [5,6].
      Systemic chemotherapy still remains the standard of care for patients with metastatic PAC.
In the past, fluorouracil (5-FU) has been the most commonly used chemotherapy regimen until in
1996, gemcitabine (Gem) was approved as it was shown to modestly improve survival and relieve
disease-related symptoms [7]. After the introduction of Gem, many different Gem-based combinations
have been clinically tested with the majority of trials not demonstrating a meaningful clinical benefit.
However, two meta-analyses found that combinations with platins or capecitabine improved the
survival of patients with unresectable PAC and good performance status [8,9]. Of note, in 2006, a
prospective randomized clinical phase III trial demonstrated that the addition of erlotinib to Gem
marginally extended the lives of patients affected from inoperable PAC by only two weeks. So far, this
is the only targeted therapy approved for the treatment of advanced PAC [10]. More recently in 2011,
the PRODIGE4/ACCORD11 (Partenarait de Recherche en Oncologie Digestive/Actions Concertées
dans les Cancers Colorectaux et Digestifs) study evaluated the combination of 5-FU, leucovorin (LV),
irinotecan, and oxaliplatin (FOLFIRINOX) versus Gem monotherapy and reported a median overall
survival (mOS) of 11.1 months against 6.8 months in the control arm (p < 0.001) [11]. Two years later,
the MPACT trials also demonstrated superior survival with the combination of Gem plus nab-paclitaxel
(Gem/NabP) over Gem alone with an mOS of 8.5 versus 6.7 months (p < 0.0001) [12]. The latest approved
therapy for the treatment of unresectable PAC is nanoliposomal irinotecan with 5-FU/LV (FP/Nal-IRI)
according to the positive results of the NAPOLI-1 trial, which evaluated this regimen in patients that
progressed under a Gem based therapy [13]. Another clinically tested second line treatment option
after front-line therapy with Gem is fluoropyrimidines in combination with oxaliplatin, although there
is conflicting evidence concerning the efficacy of the different regimens [14,15]. With these recent
developments in the clinical management of patients with advanced PAC, our aim was to determine
the impact of new therapeutic options on the treatment landscape and clinical outcome in a cohort of
patients with advanced or metastatic PAC, who have started their treatment at the Comprehensive
Cancer Center of the Medical University of Vienna during 2011 and 2017.

2. Experimental Section

2.1. Study Design
     This is a single-center, retrospective, observational registry study, including patients with
histologically or cytologically proven non-resectable PAC which was either locally advanced or
metastasized and who have started a systemic treatment at the Medical University of Vienna between
01/2011 and 12/2017. The decision for the systemic treatment was always at the discretion of the
treating physician. Furthermore, all patients in this study were discussed within multidisciplinary
board sessions. If a patient was progressing to frontline chemotherapy and maintained sufficient
performance status to undergo a second or later line chemotherapy, potential treatment options, which
were available at that time, were discussed with the patient during the informed consent discussion.
The decision for second line chemotherapy was not influenced by industry-funded trials, as there were
no ongoing second line chemotherapy trials during the whole observation period. The selection of the
optimal treatment options was based on the at that time available national and international treatment
guidelines. For the comparison of the main study cohorts, the time of first administration of systemic
chemotherapy was retrieved. The electronic medical history was queried for patient demographics,
performance status, date of diagnosis, date of advanced disease, diagnosis and carbohydrate antigen
19-9 (CA19-9) level at baseline, treatment details and overall survival. ECOG (Eastern Cooperative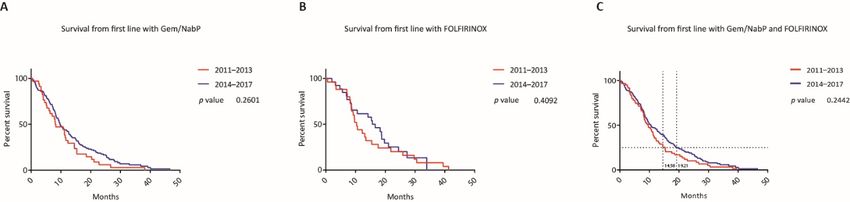
J. Clin. Med. 2020, 9, 648                                                                                   3 of 15

Oncology Group) performance status was derived, if not stated explicitly, from the medical history,
including comorbidities and overall assessment of the treating physician. Recurrent PAC after resection
of curative intent was stated as stage IV disease. Date of disease progression on treatment and date
of death were recorded. The here presented data analysis received prior approval by the ethical
committee of the Medical University of Vienna (EK.No. 1806/2017) and was performed according to
Helsinki criteria of good scientific practice.

2.2. Statistics
     Descriptive statistics were calculated as mean, median or percentages as appropriate. Statistical
comparison of categorical variables was calculated with Fisher’s exact test and comparison of metric
variables with the unpaired t test. Overall survival (OS) from first, second or third treatment line
was calculated from the time of the first administration of the respective treatment line to death.
OS was depicted by Kaplan Meier plots. For group comparisons, the Log-Rank test (LRt) and the
Gehan-Breslow-Wilcoxon test (GBWt) (in the case of non-constant hazard ratios) were used, respectively.
Multivariate survival analysis was performed with the Cox proportional hazard model to evaluate the
treatment effect with adjustment for stratification factors. In the case of missing variables, the entire data
of that individual was deleted from the multivariate analysis. For the covariates ECOG performance
status and number of metastatic sites, categories were combined because of the low number of events.
A p-value of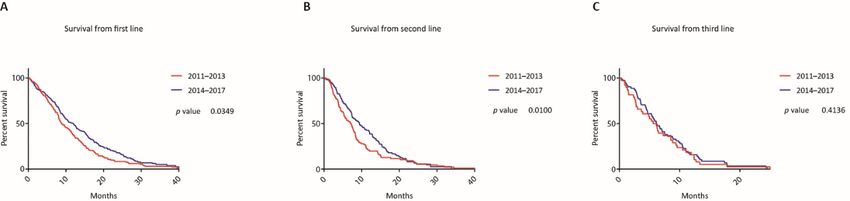
J. Clin. Med. 2020, 9, 648                                                                                           4 of 15

                                                      Table 1. Cont.

                                                           Cohort A                  Cohort B
                                                                                                           p-Value
                                                      2011–2013 (n = 132)       2014–2017 (n = 169)
                                                             505.35                    686.40
        Median CA 19-9 levels in kU/l (range)                                                                 ns
                                                        (68.05–2261.25)           (88.25–3771.00)
                    CA 19-9 levels (%)
                  Within normal range                        20 (15)                   19 (11)
                                                                                                              ns
                  Above normal range                        101 (77)                  132 (78)
                              n/a                             11 (8)                   18 (11)                ns
             Site of metastatic disease (%)
                             Liver                           73 (55)                   84 (50)                ns
                             Lung                            15 (11)                   21 (12)                ns
                        Peritoneum                            10 (8)                   30 (18)                 *
                             Other                            11 (8)                    7 (4)                 ns
            Number of metastatic sites (%)
                               0                             34 (26)                   43 (25)                ns
                               1                             80 (60)                  102 (60)                ns
                               2                             14 (11)                   18 (11)                ns
                              ≥3                              4 (3)                     6 (4)                 ns
            ECOG Performance Status (%)
                               0                             67 (51)                  100 (59)                ns
                               1                             52 (39)                   61 (36)                ns
                               2                              8 (6)                     5 (3)                 ns
                              n/a                             5 (4)                     3 (2)                 ns
      Abbreviations: CA 19-9, Carbohydrate antigen 19-9; ECOG, Eastern Cooperative Oncology Group; ns, not significant
      (p > 0.05).

     The median age in both groups was nearly identical (66.3 (interquartile range (IQR)) 57.3–72.2)
versus 66.0 years (IQR 58.3–73.3)). In cohort A there were 53 (41%) female and 79 (59%) male patients,
while in cohort B there were 90 female (53%) and 79 (47%) male patients. About one fourth in each
cohort presented with locally advanced (unresectable) disease (26% and 25%), while the majority had
metastatic disease (74% and 75%) at time of initiation with systemic treatment. In cohort A 23 (17%)
and in cohort B 32 (19%) patients had a prior surgical resection. The median CA 19-9 level was 505.35
kU/l (68.05–2261.25 kU/l) in cohort A and 686.40 kU/l (88.25–3771.00 kU/l) in cohort B. While a minor
proportion in each of the cohorts had CA 19-9 levels within the normal range (15% and 11%), most of
the patients had increased CA 19-9 levels at the start of their systemic therapy (77% and 78%). In 8%
and 11%, the levels for CA 19-9 were not available. In both cohorts the predominant site of metastatic
disease was liver (55% and 50%), followed by lung (11% and 12%), peritoneum (8% and 18%) and other
anatomical locations (8% and 4%). Relative numbers for metastatic sites for patients were equivalent.
There were 60% with one metastatic site, as well as 11% with two in each cohort, while there were 3%
and 4% of patients who had three different organs affected by metastatic spread. Most of the patients
presented with good ECOG performance status (90% and 95% with ECOG 0-1) and 6%, as well as 3%
had an ECOG performance status of two.

3.2. Treatment Landscape
    For the complete overview of administered therapies subdivided by the two cohorts, we refer to
Figure 1 and Table 2.
J. Clin. Med. 2020, 9, 648 5 of 15
J. Clin. Med. 2020, 9, 648 5 of 15
Figure
Figure Treatment
1. 1. patterns.
Treatment Treatment
patterns. regimens
Treatment from first
regimens from to third
first line of locally
to third line advanced
of locallyoradvanced
metastaticor
patients who started a systemic treatment between 2011–2013 and 2014–2017. Abbreviations:
metastatic patients who started a systemic treatment between 2011–2013 and 2014–2017. Gem/NabP,
gemcitabine/nab-paclitaxel;
Abbreviations: Gem/NabP, FOLFIRINOX, 5-FU, leucovorin (LV),
gemcitabine/nab-paclitaxel; irinotecan, and
FOLFIRINOX, oxaliplatin;
5-FU, Gem/Ox,
leucovorin (LV),
gemcitabine/oxaliplatin; FP/Ox, fluoropyrimidines/oxaliplatin, FP/Iri, fluoropyrimidines/irinotecan;
irinotecan, and oxaliplatin; Gem/Ox, gemcitabine/oxaliplatin; FP/Ox, fluoropyrimidines/oxaliplatin,
FP/Nal-IRI, fluoropyrimidines/nanoliposomal
FP/Iri, fluoropyrimidines/irinotecan; irinotecan;
FP/Nal-IRI, Cap, capecitabine; CRTx, chemoradiation;
fluoropyrimidines/nanoliposomal irinotecan; Cap,
MMC, mitomycin C.
capecitabine; CRTx, chemoradiation; MMC, mitomycin C.
Table 2. Administered chemotherapy regimens.
Table 2. Administered chemotherapy regimens.
First Line p Second Line p Third Line p
First Line p Second Line p Third Line p
Chemotherapy 2011–2013 2014–2017 2011–2013 2014–2017 2011–2013 2014–2017
Chemotherapy 2011–2013 2014–2017 2011–2013 2014–2017 2011–2013 2014–2017
116
Gem/NabP 34 (26%) 116 **** 18 (21%) 13 (13%) ns 10 (26%) 10 (17%) ns
Gem/NabP 34 (26%) (69%) **** 18 (21%) 13 (13%) ns 10 (26%) 10 (17%) ns
(69%)
mFOLFIRINOX
mFOLFIRINOX 25(19%)
25 (19%) 2626(15%)
(15%) ns ns 4 (5%)
4 (5%) 5 (5%)
5 (5%) ns ns 2 (5%)2 (5%) 4 (7%)4 (7%) ns ns
Gem/Ox
Gem/Ox 16(12%)
16 (12%) 5 5(3%)
(3%) ** ** 5 (6%)
5 (6%) 2 (2%)
2 (2%) ns ns 0 (0%)0 (0%) 4 (7%)4 (7%) ns ns
Gem/Ox/
Gem/Ox/
16
16(12%)
(12%) 0 0(0%)
(0%) **** **** 3 (3%)
3 (3%) 5 (5%) ns
5 (5%) ns 1 (3%)1 (3%) 0 (0%)0 (0%) ns ns
Erlotinib
Erlotinib
Gem
Gem alone
alone 18
18(14%)
(14%) 1414(8%)
(8%) ns ns 6 (7%) 6 (7%) 2 (2%) ns
2 (2%) ns 2 (5%)2 (5%) 3 (5%)3 (5%) ns ns
Gem/Erlotinib 4 (3%) 0 (0%) * 9 (10%) 1 (1%) ** 2 (5%) 2 (3%) ns
Gem/Erlotinib 4 (3%) 0 (0%) * 9 (10%) 1 (1%) ** 2 (5%) 2 (3%) ns
FP/Ox 1 (1%) 2 (1%) ns 12 (14%) 19 (18%) ns 5 (13%) 16 (28%) ns
FP/Ox 1 (1%) 2 (1%) ns 12 (14%) 19 (18%) ns 5 (13%) 16 (28%) ns
FP/Iri 1 (1%) 0 (0%) ns 1 (1%) 2 (2%) ns 8 (21%) 6 (10%) ns
FP/Iri
FP/Nal-IRI 01(0%)
(1%) 0 1(0%)
(1%) ns ns 1 (1%) 0 (0%) 2 (2%)
31 (30%) ns **** 8 (21%)
0 (0%) 6 (10%)14 (24%)ns ****
Cap
FP/Nal-IRI 00(0%)
(0%) 1 1(1%)
(1%) ns ns 0 (0%) 4 (5%)
5 (5%) ****
31 (30%) ns 0 (0%)1 (3%) 14 (24%) 2 (3%)**** ns
Gem/Cap
Cap 00(0%)
(0%) 1 1(1%)
(1%) ns ns 4 (5%) 2 (2%)
0 (0%) ns
5 (5%) ns 1 (3%)0 (0%) 2 (3%)2 (3%) ns ns
Ox 1 (1%) 0 (0%) ns 0 (0%)
0 (0%) ns 1 (3%) 0 (0%) ns
Gem/Cap 0 (0%) 1 (1%) ns 2 (2%)
0 (0%) ns 0 (0%) 2 (3%) ns
CRTx 15 (11%) 3 (2%) *** 16 (19%)
19 (19%) ns 2 (5%) 0 (0%) ns
MMC Ox 1 (1%)
0 (0%) 0 0(0%)
(0%) ns ns 0 (0%) 0 (0%)
0 (0%) ns
1 (1%) ns 1 (3%)
1 (3%) 0 (0%)0 (0%) ns ns
CRTx
Local therapy 15 (11%)
1 (1%) 3 0(2%)
(0%) *** ns 16 (19%)
19 (19%)
0 (0%) ns
2 (2%) ns 2 (5%)2 (5%) 0 (0%)0 (0%) ns ns
Gem/Cap/
MMC 0 (0%) 0 (0%) ns 1 (1%) 0 (0%)
0 (0%) 0 (0%) ns 3 (3%) 0 (0%) ns ns 1 (3%)1 (3%) 0 (0%)0 (0%) ns ns
Erlotinib
Local therapy 1 (1%) 0 (0%) ns 2 (2%) 0 (0%) ns 2 (5%) 0 (0%) ns
No therapy 0 (0%) 0 (0%) ns 46 (35%) 65 (38%) ns 94 (71%) 106 (63%) ns
Gem/Cap/
Abbreviations:0 (0%)
Erlotinib
0 (0%)
Gem/NabP, ns 3 (3%)
gemcitabine/nab-paclitaxael; 0mFOLFIRINOX,
(0%) ns 1 (3%) 5-FU,
modified 0 (0%) ns
leucovorin,
No irinotecan,
therapy and oxaliplatin;
0 (0%) Gem/Ox,ns
0 (0%) gemcitabine/oxaliplatin;
46 (35%) 65 (38%)FP/Ox,
ns fluoropyrimidines/oxaliplatin,
94 (71%) 106 (63%) ns
FP/Iri, fluoropyrimidines/irinotecan; FP/Nal-IRI, fluoropyrimidines/nanoliposomal irinotecan; Cap,
Abbreviations: Gem/NabP, gemcitabine/nab-paclitaxael; mFOLFIRINOX, modified 5-FU, leucovorin, irinotecan,
capecitabine;
and CRTx, chemoradiation;
oxaliplatin; Gem/Ox, MMC,
gemcitabine/oxaliplatin; mitomycin
FP/Ox, C, p, p-value; ns, not
fluoropyrimidines/oxaliplatin, significant
FP/Iri, (p > 0.05).
fluoropyrimidines/
irinotecan; FP/Nal-IRI, fluoropyrimidines/nanoliposomal irinotecan; Cap, capecitabine; CRTx,
Asterisks indicate p-value, * 0.01 to 0.05, ** 0.001 to 0.01, *** 0.0001 to 0.001, ****< 0.0001. chemoradiation;
MMC, mitomycin C, p, p-value; ns, not significant (p > 0.05). Asterisks indicate p-value, * 0.01 to 0.05, ** 0.001 to 0.01,
*** 0.0001 to 0.001, **** < 0.0001.J. Clin. Med. 2020, 9, 648 6 of 15
J. Clin. Med. 2020, 9, 648 6 of 15
In
Infirst
firstline systemic
line systemic therapy, Gem/NabP
therapy, Gem/NabP ranks in bothin
ranks cohorts
both on top, however,
cohorts on top, relative
however,frequencies
relative
differ substantially (26% in cohort A versus 69% in cohort B). Modified
frequencies differ substantially (26% in cohort A versus 69% in cohort B). Modified FOLFIRINOX FOLFIRINOX (mFOLFIRINOX,
no bolus 5-FU) wasnothe
(mFOLFIRINOX, second
bolus 5-FU)commonly used regimen
was the second commonly in the tworegimen
used cohorts in (19%
thevs.
two15%) followed
cohorts (19%
by Gem alone (14% versus 8%). In cohort A, further commonly
vs. 15%) followed by Gem alone (14% versus 8%). In cohort A, further commonly used regimens wereused regimens were gemcitabine
and oxaliplatin
gemcitabine and(Gem/Ox)
oxaliplatin(12%), oxaliplatin
(Gem/Ox) plusoxaliplatin
(12%), erlotinib (Gem/Ox/Erlotinib) (12%), chemoradiation
plus erlotinib (Gem/Ox/Erlotinib) (12%),
(CRTx) (11%) and other therapies (6%, see Table 2), whereas, in
chemoradiation (CRTx) (11%) and other therapies (6%, see Table 2), whereas, in cohort B further cohort B further treatments were
subsumed to other therapies, due to their low frequencies (8%, see
treatments were subsumed to other therapies, due to their low frequencies (8%, see Table 2). Table 2).
The
Theproportion
proportionof ofpatients
patientswhich
whichstarted
startedaasecond
secondline linetherapy
therapywas was65%
65%(n (n== 86) in cohort
86) in cohort A A and
and
62% (n = 104) in cohort B (see Figure 1). In descending order of relative
62% (n = 104) in cohort B (see Figure 1). In descending order of relative frequencies, administered frequencies, administered
therapies
therapiesin incohort
cohortA Awere
were Gem/NabP
Gem/NabP (21%),(21%), CRTx
CRTx (19%), fluoropyrimidines and
(19%), fluoropyrimidines and oxaliplatin
oxaliplatin (FP/Ox)
(FP/Ox)
(14%),
(14%),gemcitabine/erlotinib
gemcitabine/erlotinib(Gem/Erlotinib)
(Gem/Erlotinib) (10%), (10%), Gem Gem alone
alone (7%),
(7%), Gem/Ox
Gem/Ox (6%), (6%), mFOLFIRINOX
mFOLFIRINOX
(5%),
(5%), capecitabine (Cap) (5%) and other therapies (14%). For cohort B these were nanoliposomal
capecitabine (Cap) (5%) and other therapies (14%). For cohort B these were nanoliposomal
irinotecan
irinotecanand andfluoropyrimidines
fluoropyrimidines (FP/Nal-IRI)
(FP/Nal-IRI) (30%),(30%), CRTx
CRTx (18%),(18%), FP/Ox
FP/Ox (18%), Gem/NabP (13%),
(18%), Gem/NabP (13%),
mFOLFIRINOX
mFOLFIRINOX(5%), (5%),Gem/Ox/Erlotinib
Gem/Ox/Erlotinib(5%), (5%),CapCap(5%)(5%)and andother
othertherapies
therapies(7%).
(7%).
Rates
Rates for administered third line therapies were 29% (n = 38) in cohort A
for administered third line therapies were 29% (n = 38) in cohort A and
and 37% (n =
37% (n 63) in
= 63) in
cohort
cohortB.B.InIn cohort
cohortA these
A these therapies werewere
therapies Gem/NabP
Gem/NabP (26%),(26%),
fluoropyrimidines
fluoropyrimidinesand irinotecan (FP/Iri)
and irinotecan
(21%), FP/Ox
(FP/Iri) (21%), (13%),
FP/OxGem/Erlotinib (5%), mFOLFIRINOX
(13%), Gem/Erlotinib (5%), mFOLFIRINOX (5%), Gem (5%),alone
Gem (5%),
aloneCRTx
(5%),(5%),
CRTx local to
(5%),
the site of the tumor directed therapies (5%) and other therapies (13%). In
local to the site of the tumor directed therapies (5%) and other therapies (13%). In cohort B third line cohort B third line therapy
consisted of FP/Oxof(25%),
therapy consisted FP/OxFP/Nal-IRI (22%), Gem/NabP
(25%), FP/Nal-IRI (22%), Gem/NabP (16%), (16%),
FP/Iri (10%), mFOLFIRINOX
FP/Iri (10%), mFOLFIRINOX (6%),
Gem/Ox (6%), Gem
(6%), Gem/Ox (6%),alone
Gem(5%) aloneand(5%) other
andtherapies (10%).(10%).
other therapies
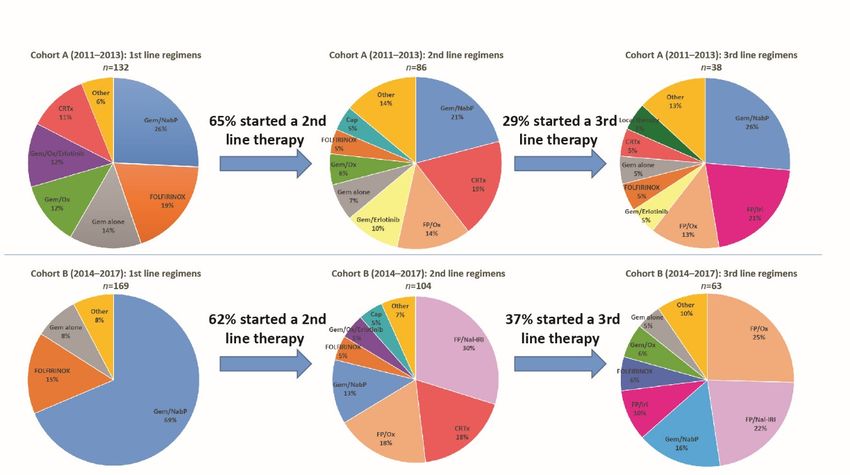
3.3.
3.3.Clinical
ClinicalOutcome
Outcome
Kaplan-Meier
Kaplan-Meiercurves
curvesfor
forthe
thetwo
twocohorts
cohortsare
aredepicted
depictedin
inFigure
Figure2.
2.
Figure2.2.Survival
Figure Survivalaccording
accordingtototreatment
treatmentlines.
lines. Kaplan-Meier curves of patients from initiation of the
first(A),
first (A),second
second(B)
(B)and
andthird
third(C)
(C)line
linetreatment
treatment according
according to
to the
the time
time periods when the first systemic
treatmentwas
treatment wasadministered.
administered.
In
Incohort
cohortA,A,132
132events
eventsoccurred
occurred(100%)
(100%)andandin incohort
cohort BB 157
157 (93%).
(93%). The mOS from the beginning
ofoffirst
firstline
linetreatment
treatmentwaswas8.89
8.89months
monthsin in cohort
cohort A A and
and statistically significantly longer in cohort B by
3.01
3.01months
months(mOS(mOS11.9 months;p p==0.035
11.9months; 0.035(LRt),
(LRt),hazard
hazardratio
ratio(HR)
(HR)0.77, confidence
0.77, confidence interval
interval(CI) 0.61
(CI) to
0.61
0.98). TheThe
to 0.98). proportions
proportions of patients whowho
of patients were alive
were at 12,
alive at 18
12,and 24 months
18 and afterafter
24 months initiation of first
initiation line
of first
therapy were 37.1%
line therapy versusversus
were 37.1% 49.1%, 49.1%,
16.7% versus
16.7% 28.7%
versusand 8.3%
28.7% versus
and 8.3%17.3%.
versusMultivariate analysis
17.3%. Multivariate
confirmed that the time
analysis confirmed thatwhen thewhen
the time first treatment line was initiated
the first treatment line was is a prognostic
initiated factor forfactor
is a prognostic survival
for
(HR 0.77, (HR
survival CI 0.60-0.99, p = 0.043)p(see
0.77, CI 0.60-0.99, Figure
= 0.043) 3).Figure 3).
(seeJ. Clin. Med. 2020, 9, 648 7 of 15
J. Clin. Med. 2020, 9, 648 7 of 15
Figure 3. Forest plot for the adjusted survival analysis for all patients. Cox proportional hazard model
Figure 3. Forest
to analyze plotof
the effect formultiple
the adjusted survival
variables analysis
on the foroutcome
survival all patients.
of allCox proportional
patients. hazard model
Abbreviations: ECOG,
to analyze
Eastern the effect Oncology
Cooperative of multipleGroup
variables on the survival
performance = 266 (patients
scale. Noutcome of all patients. Abbreviations:
with missing values of
ECOG,
variablesEastern Cooperative
were excluded fromOncology Group
the analysis). performance
Asterisks indicatescale. N = *266
p-value, 0.01(patients
to 0.05, **with
0.001missing
to 0.01,
values of variables
*** 0.0001 to 0.001. were excluded
# indicates from the analysis). Asterisks indicate p-value, * 0.01 to 0.05, ** 0.001
number.
to 0.01, *** 0.0001 to 0.001. # indicates number.
From beginning of second line therapy, mOS was 7.14 months versus 9.39 months (p = 0.010
(GBWt),
From HR 0.77, CI 0.57
beginning to 1.04)line
of second andtherapy,
from the mOS
beginning of third
was 7.14 line therapy,
months mOS
versus 9.39 was 5.89
months (p months
= 0.010
versus 6.15
(GBWt), HRmonths = 0.414
0.77, CI(p0.57 (LRt),
to 1.04) andHR from0.89,
theCIbeginning
0.59 to 1.34). Gem/NabP
of third and mFOLFIRINOX
line therapy, mOS was 5.89were
months the
most commonly
versus administered
6.15 months first line
(p = 0.414 (LRt), HRtherapies
0.89, CI in both
0.59 to cohorts and accounted
1.34). Gem/NabP for 67% of all firstwere
and mFOLFIRINOX line
therapies
the from 2011 administered
most commonly to 2017. Whenfirst comparing these first
line therapies linecohorts
in both regimens andbetween thefor
accounted two time
67% of cohorts,
all first
line therapies from 2011 to 2017. When comparing these first line regimens between the two time
cohorts, mOS did not differ significantly for first line Gem/NabP (8.23 months versus 9.82 months, pJ. Clin. Med. 2020, 9, 648 8 of 15
J. Clin. Med. 2020, 9, 648 8 of 15
J. Clin. Med. 2020, 9, 648 8 of 15
mOS did not differ significantly for first line Gem/NabP (8.23 months versus 9.82 months, p = 0.260
(LRt),
= 0.260HR 0.75,HR
(LRt),
= 0.260 (LRt), CI 0.75,
HR 0.49 to
0.75,
CI 1.14),
0.49 tomFOLFIRINOX
CI 0.49 to (10.38 months
1.14), mFOLFIRINOX
1.14), mFOLFIRINOX versus versus
(10.38 months
(10.38 months 16.14 months,
versus p = 0.409
16.14 months,
16.14 months,
p = (LRt),
p = 0.409 HR
0.409
(LRt),CI
0.84, HR
(LRt), HR
0.84,
0.48 to CI
0.84,
0.48and
1.49)
CI 0.48
to 1.49) and Gem/NabP
Gem/NabP
to 1.49)
or mFOLFIRINOX
or mFOLFIRINOX
and Gem/NabP
(9.62 months
(9.62 months
or mFOLFIRINOX versusversus
(9.62 months 10.61 months,
versus p = 0.244
10.61 months,
10.61 months,
p = 0.244
(LRt), HR (LRt),
0.79, HR
CI 0.79,toCI1.09)
0.57 0.57 (see
to 1.09) (see4).
Figure Figure 4).
p = 0.244 (LRt), HR 0.79, CI 0.57 to 1.09) (see Figure 4).
Figure 4. Survival between most popular first line regimens between the two time periods. Kaplan-
Figure 4.
Figure 4. Survival
Survival between
between most
mostpopular
popularfirst
firstline
lineregimens
regimensbetween
betweenthe
thetwo
two time
time periods.
periods. Kaplan-
Kaplan-Meier
Meier curves of patients who started a first line therapy with gemcitabine/nab-paclitaxel (A),
Meier of
curves curves of patients
patients whoa first
who started started
lineatherapy
first line therapy
with with gemcitabine/nab-paclitaxel
gemcitabine/nab-paclitaxel (A),
(A), mFOLFIRINOX
mFOLFIRINOX (B) or with either one of these regimens (C) according to the year when the first
mFOLFIRINOX
(B) or with either(B)
oneorofwith
theseeither one of
regimens (C)these regimens
according (C)
to the according
year when the to first
the year when
systemic the first was
treatment
systemic treatment was administered. Horizontal grid lines indicate the survival proportion of 25%
systemic treatment
administered. was administered.
Horizontal Horizontal
grid lines indicate thegrid lines indicate
survival the of
proportion survival
25% and proportion of 25%with
intersections
and intersections with vertical grid lines indicate the survival time for the respective Kaplan-Meier
and intersections with vertical grid lines indicate the survival time for the respective
vertical grid lines indicate the survival time for the respective Kaplan-Meier curves at this point. Kaplan-Meier
curves at this point.
curves at this point.
In neither time cohort nor in the whole cohort from 2011 to 2017, patients treated with these two
In neither time cohort nor in the whole cohort from 2011 to 2017, patients treated with these two
In neither
first line time
regimes cohort nor
differed in the whole
substantially incohort
survivalfrom 2011compared
when to 2017, patients
to all treated with these(mOS
other therapies two in
first line regimes differed substantially in survival when compared to all other therapies (mOS in
first
cohort line regimes differed substantially in
months,p p= =0.611 survival when compared to all other therapies (mOS in
cohort A 9.62 versus
A 9.62 versus8.468.46months, 0.611 (LRt),
(LRt), HR HR 0.96,
0.96, CI CI
0.680.68 to 1.35;
to 1.35; in cohort
in cohort B 10.61
B 10.61 versus
versus
cohort A 9.62 versus 8.46(LRt),
months, p0.98,
= 0.611 (LRt),
toHR 0.96, CI 0.68 tocohort
1.35; in cohort B 10.61 versus
15.37 months, pp==0.641
15.37 months, 0.641(LRt), HRHR 0.98, CI CI
0.640.64 1.51;
to 1.51; in the
in the totaltotal
cohort 10.1810.18
versusversus
11.01 11.01 months,
months, p
15.37
p= = months,
0.356 p
(LRt), =
HR 0.641 (LRt),
0.88, CI HR
0.69 0.98,
to CI
1.13) 0.64
(see to 1.51;
Figure in
5). the total cohort 10.18 versus 11.01 months, p
0.356 (LRt), HR 0.88, CI 0.69 to 1.13) (see Figure 5).
= 0.356 (LRt), HR 0.88, CI 0.69 to 1.13) (see Figure 5).
Figure 5. Survival
Survivalwith
withmost
mostpopular
popular first line
first regimens
line regimens versus
versusall all
other therapies
other within
therapies the two
within timetime
the two
Figure 5.
5. Survival with most popular first line regimens versus all other therapies within the two time
periods.
periods. Kaplan-Meier curves
Kaplan-Meiercurves of patients
curvesofofpatients
patients who whostarted a
started first line
a first therapy with either one of the
of two
periods. Kaplan-Meier who started a first lineline therapy
therapy with
with either
either one one
of the the two
two
regimens gemcitabine/nab-paclitaxel
regimens gemcitabine/nab-paclitaxel andand mFOLFIRINOX
mFOLFIRINOX compared
compared to all
to other
all therapies
other between
therapies between
regimens gemcitabine/nab-paclitaxel and mFOLFIRINOX compared to all other therapies between
2011–2013 (A),
2011–2013 (A), 2014–2017
2014–2017(B),
(B),as
aswell
wellas for
forthe whole time period (C).(C).
2011–2013 (A), 2014–2017 (B), as well asasfor the
the whole
whole time
time period
period (C).
The ratio of
of patients
patientswhowhostarted
startedaa asecond line therapy was similar in both cohorts, however, the the
The ratio
ratio of patients who started second
second line
line therapy
therapy was
was similar
similar in both
in both cohorts,
cohorts, however,
however, the
frequency of
frequency used regimens,
regimens,unlike
unliketo first
firstline regimens, was different. When excluding CRTx, which
frequency of of used
used regimens, unlike totofirst line
line regimens,
regimens, was
was different.
different. WhenWhen excluding
excluding CRTx,
CRTx, whichwhich
was
was applied in both cohorts at comparable rates (19% versus 18% in second line), the survival from
wasapplied
appliedin inboth
bothcohorts
cohortsat atcomparable
comparablerates rates(19%
(19%versus
versus18%
18%in insecond
secondline),
line),the
thesurvival
survivalfrom
fromfirst
firstand
line line and secondline ofline of patients treated with the commonly
most commonly used second line regimens
first linesecond
and second patients
line treated
of patients with the
treated with most
the most commonlyused second line regimens
used second (cohort A:
line regimens
(cohort
21% A: 21% Gem/NabP,
Gem/NabP, 14% Gem/(Cap)/Erlotinib,
14% Gem/(Cap)/Erlotinib, 14% FP/Ox;14% FP/Ox;
cohort B: 30%cohort B: 30% 18%
FP/Nal-IRI, FP/Nal-IRI,
FP/Ox) 18%
differed
(cohort A: 21% Gem/NabP, 14% Gem/(Cap)/Erlotinib, 14% FP/Ox; cohort B: 30% FP/Nal-IRI, 18%
FP/Ox) differed
significantly significantly
(mOS (mOS
from first(mOS from
line 11.41 first line 11.41 versus 15.21 months,
p = 0.012 p = 0.012 (LRt), HR 0.64,
FP/Ox) differed significantly from versus
first line15.21
11.41months,
versus 15.21 months,(LRt),
p = HR
0.0120.64, CIHR
(LRt), 0.410.64,
to 0.99;
CI 0.41 to 0.99; mOS from second line 5.72 versus 7.47 months, p = 0.021 (GBWt), HR 0.68, CI 0.44 to
CI 0.41
mOS to 0.99;
from secondmOS linefrom
5.72second
versus line
7.47 5.72
months,versusp =7.47 months,
0.021 p =HR
(GBWt), 0.021 (GBWt),
0.68, CI 0.44HR 0.68, (see
to 1.05) CI 0.44 to 6).
Figure
1.05) (see Figure 6).
1.05) (see Figure 6).J. Clin. Med. 2020, 9, 648 9 of 15
J. Clin. Med. 2020, 9, 648 9 of 15
Figure
Figure 6. Survival according
6. Survival according to
to first
first line
line and
and second
second line
line treatment
treatment for
for most
most popular
popular regimens.
regimens.
Kaplan-Meier curves of patients who were treated with one of the most popular
Kaplan-Meier curves of patients who were treated with one of the most popular second line treatment second line
treatment
regimes, calculated from the initiation of the first (A) and second (B) treatment line according toline
regimes, calculated from the initiation of the first (A) and second (B) treatment the
according
year whentothethe year
first when treatment
systemic the first systemic treatment was
was administered. administered.
The most The mostlines
popular treatment popular
were
treatment lines were gemcitabine/nab-paclitaxel,
gemcitabine/nab-paclitaxel, gemcitabine/(capecitabine)/erlotinib,
gemcitabine/(capecitabine)/erlotinib, as as well as
well as
fluoropyrimidines/oxaliplatin for the cohort 2011–2013 and fluoropyrimidines/nanoliposomal
fluoropyrimidines/oxaliplatin for the cohort 2011–2013 and fluoropyrimidines/nanoliposomal irinotecan,
as well as fluoropyrimidines/oxaliplatin
irinotecan, for the cohort
as well as fluoropyrimidines/oxaliplatin for2014–2017.
the cohort 2014–2017.
Multivariate analysis (Cox proportional hazard model) with potentially influencing variables was
Multivariate analysis (Cox proportional hazard model) with potentially influencing variables
performed for these two cohorts. The difference in survival between patients treated with the most
was performed for these two cohorts. The difference in survival between patients treated with the
commonly used second line regimens (2011–2013 vs. 2014–2017) remained statistically significant (HR
most commonly used second line regimens (2011–2013 vs. 2014–2017) remained statistically
0.56, CI 0.34–0.94, p = 0.029) (see Figure 7).
significant (HR 0.56, CI 0.34–0.94, p = 0.029) (see Figure 7).
Among the total cohort, three different first to second line treatment sequences were analyzed.
The survival curves for the sequences, mFOLFIRINOX followed by Gem/NabP (mOS 15.64 months),
Gem/NabP followed by FP/Nal-IRI (mOS 14.27 months), Gem/NabP followed by FP/Ox (mOS 13.62
months), did not differ significantly from each other (p = 0.692) (see Figure 8).J. Clin. Med. 2020, 9, 648 10 of 15
J. Clin. Med. 2020, 9, 648 10 of 15
Figure 7. Forest plot for the adjusted survival analysis from patients treated with the most commonly
Figure 7. Forest
used second lineplot for theofadjusted
regimens both timesurvival
cohorts.analysis from patients
Cox proportional treated
hazard with
model tothe most the
analyze commonly
effect of
used second
multiple line regimens
variables of bothoutcome
on the survival time cohorts. Cox proportional
of patients who have beenhazard model
treated withto analyze
the the effect
most commonly
of multiple
used secondvariables on the
line treatment survival Abbreviations:
regimens. outcome of patientsECOG,who haveCooperative
Eastern been treated with theGroup
Oncology most
performance scale. N = 82 (patients with missing values of variables were excluded from the analysis).
commonly used second line treatment regimens. Abbreviations: ECOG, Eastern Cooperative
Oncology Group performance
Asterisks indicate scale.
p-value, * 0.01 N = #82indicates
to 0.05. (patientsnumber.
with missing values of variables were excluded
from the analysis). Asterisks indicate p-value, * 0.01 to 0.05. # indicates number.
Among the total cohort, three different first to second line treatment sequences were analyzed.
The survival curves for the sequences, mFOLFIRINOX followed by Gem/NabP (mOS 15.64 months),
Gem/NabP followed by FP/Nal-IRI (mOS 14.27 months), Gem/NabP followed by FP/Ox (mOS 13.62
months), did not differ significantly from each other (p = 0.692) (see Figure 8).J. Clin. Med. 2020, 9, 648 11 of 15
J. Clin. Med. 2020, 9, 648 11 of 15
Figure 8. Survival
Survivalwith
withdifferent
differentfirst
firsttotosecond
secondline
linetreatment
treatmentsequences.
sequences.Kaplan-Meier
Kaplan-Meier curves
curvesof
patients
of who
patients were
who treated
were with
treated withoneoneofofthe
thethree
threetreatment
treatmentsequences
sequencesfrom
fromfirst
first to
to second
second line:
line:
mFOLFIRINOX followed
mFOLFIRINOX followed by gemcitabine/nab-paclitaxel
gemcitabine/nab-paclitaxel (red line), gem/nab-paclitaxel followed by
fluoropyrimidines/nanoliposomal irinotecan (blue line) and gemcitabine/nab-paclitaxel followed by
fluoropyrimidines/oxaliplatin
fluoropyrimidines/oxaliplatin (green
(green line).
line).
4. Discussion
4. Discussion
New therapeutic agents for metastatic PAC have recently expanded treatment options for this
New therapeutic agents for metastatic PAC have recently expanded treatment options for this
disease. Our aim was to assess the impact of these novel chemotherapy regimens on the treatment
disease. Our aim was to assess the impact of these novel chemotherapy regimens on the treatment
landscape and clinical outcome in a cohort of patients, which falls in the period of their introduction to
landscape and clinical outcome in a cohort of patients, which falls in the period of their introduction
the clinic. These treatment options include Gem/NabP, FOLFIRINOX, FP/Nal-IRI and FP/Ox. In concert
to the clinic. These treatment options include Gem/NabP, FOLFIRINOX, FP/Nal-IRI and FP/Ox. In
with the timeline of clinical introduction of these regimens, we observed a major increase of Gem/NabP
concert with the timeline of clinical introduction of these regimens, we observed a major increase of
when comparing first line regimens in the period from 2011 to 2013 against 2014 to 2017 from 26% to
Gem/NabP when comparing first line regimens in the period from 2011 to 2013 against 2014 to 2017
69%
from(p26% < 0.0001),
to 69%while the rateswhile
(p < 0.0001), for administration
the rates for of mFOLFIRINOX
administration as a front-line regimen
of mFOLFIRINOX differed
as a front-line
not substantially (19% versus 15%, p =
regimen differed not substantially (19% versus 15%, p = 0.4415). This increase of Gem/NabP inwas
0.4415). This increase of Gem/NabP in the first line setting the
mainly accounted to a reduction of the other chemotherapy regimens
first line setting was mainly accounted to a reduction of the other chemotherapy regimens Gem/Ox, Gem/Ox, Gem/Ox/Erlotinib and
CRTx with less evidence
Gem/Ox/Erlotinib and CRTx as effective
with less treatment
evidenceoptions.
as effective treatment options.
There have been two other studies
There have been two other studies from an American from an American and and aa Japanese
Japanese group
group assessing
assessing treatment
treatment
patterns
patterns overoverrecent
recent years
yearswherewhere modernmodernfirst line
firstchemotherapies
line chemotherapies were introduced and which
were introduced andshowed
whicha
similar trend towards increased usage of Gem/NabP as a preferred
showed a similar trend towards increased usage of Gem/NabP as a preferred first line regimen first line regimen ranging from ~40%
to 57% [16,17]. In contrast, another multi-institutional large study
ranging from ~40% to 57% [16,17]. In contrast, another multi-institutional large study from Canada from Canada showed a tendency
toward
showedincreased
a tendency administration
toward increased of FOLFIRINOX
administrationas firstofline treatment (60%)
FOLFIRINOX [18].line
as first In countries,
treatment where
(60%)
S-1 is in clinical use for PAC, changes in frontline treatment patterns
[18]. In countries, where S-1 is in clinical use for PAC, changes in frontline treatment patterns have also been observed. However,
have
the use of Gem/NabP or FOLFIRINOX does not exceed 25%
also been observed. However, the use of Gem/NabP or FOLFIRINOX does not exceed 25% for eachfor each treatment option, according to
two recently published studies from Japan and Taiwan [19,20].
treatment option, according to two recently published studies from Japan and Taiwan [19,20]. Referring to our results regarding the
second
Referring andtothird
our line
resultssetting, Gem/NabP
regarding was theand
the second most commonly
third used regimen
line setting, Gem/NabP in the
wasearlier time
the most
period
commonly (21%used
and regimen
26%), while, in the if considering
earlier time the periodhigh(21%
rate and
of this regimen
26%), while,inifthe frontline setting
considering the high ofrate
the
later period, it was subsequently replaced by FP/Nal-IRI (30% and 22%).
of this regimen in the frontline setting of the later period, it was subsequently replaced by FP/Nal-IRI To sum up, when comparing
the
(30%treatment
and 22%). landscape
To sumofup, thewhen
two time periods,the
comparing wetreatment
observed alandscape
clear increase
of theof two
Gem/NabP, a regimen
time periods, we
with high aevidence
observed as an effective
clear increase front-linea therapy
of Gem/NabP, regimenwith with thehigh
laterevidence
line treatment
as an option FP/Nal-IRI.
effective front-line
Most
therapy importantly,
with the later line thetreatment
median survival of patients, who started their systemic treatment in the
option FP/Nal-IRI.
later Most
time period, improved
importantly, when compared
the median survival of to patients,
the earlierwho onestarted
(mOS 11.9 theirversus
systemic p = 0.035)inwith
8.89,treatment the
survival
later time period, improved when compared to the earlier one (mOS 11.9 versus 8.89, p =49.1%,
rates at 12, 18 and 24 months after initiation of first line therapy of 37.1% versus 0.035)16.7%
with
versus
survival28.7%
rates and
at 12,8.3%
18 and versus 17.3%.after
24 months Thisinitiation
survivalofbenefit
first linewas still evident
therapy of 37.1% when
versus comparing
49.1%, 16.7% the
survival
versus 28.7%rates andfrom8.3%the beginning
versus 17.3%. of second line of the
This survival patients
benefit waswho still started
evidenttheir
when first line therapy
comparing the
between 2011 and 2013 (mOS 7.14 versus 9.39 months, p = 0.010), but
survival rates from the beginning of second line of the patients who started their first line therapy not from the beginning of third
line.
between We 2011
analyzed
and 2013if the increased
(mOS ratio of
7.14 versus 9.39first line treatment
months, p = 0.010),options
but notwith
fromhigher evidence
the beginning of as an
third
effective
line. We therapy
analyzed in if
thethelater time period
increased ratiocould be responsible
of first line treatment for the improvement
options with higher in survival,
evidencebut asdid
an
effective therapy in the later time period could be responsible for the improvement in survival, but
did not observe a difference when comparing Gem/NabP or mFOLFIRINOX, as well as both regimensJ. Clin. Med. 2020, 9, 648 12 of 15
not observe a difference when comparing Gem/NabP or mFOLFIRINOX, as well as both regimens to
all other therapies among the two time cohorts and the total cohort (see Figure 5). There was also no
significant survival difference between patients who started Gem/NabP or mFOLFIRINOX, as well as
with either one of these two regimens among the two-time cohorts (see Figure 4). However, when
comparing later time points of these survival curves, it was apparent that the survival curves separated
at a time point where most patients already started a second line chemotherapy (compare intersection
of indicated grid lines with survival curves from Figure 4C). In detail, at the time point of mOS of the
respective time cohort, 90% and 84% of the patients who started a systemic therapy between 2011 to
2013 and 2014 to 2017 and also received a second line treatment already had begun this second or
later treatment line. Next, we compared the survival of patients who received a second line treatment
with the most commonly used regimens (cohort A: 21% Gem/NabP, 14% Gem/(Cap)/Erlotinib, 14%
FP/Ox; cohort B: 30% FP/Nal-IRI, 18% FP/Ox) and observed that indeed there was a difference in
survival time from first and second line treatment between the time cohorts (mOS from first line
11.41 versus 15.21 months, p = 0.012; mOS from second line 5.72 versus 7.47 months, p = 0.021). This
survival benefit remained significant in the multivariate model when comparing patients who have
been treated with the most commonly used second line regimens of the respective time cohorts (HR
0.56, CI 0.34–0.94, p = 0.029). These results suggest, that a change in treatment patterns, in particular
that Gem/NabP moved from the second and third line to the first line setting in the later cohort and
that FP/Nal-IRI was introduced as an effective second line regimen, was responsible for the observed
survival benefit at our institution. Our hypothesis is strengthened by other reports. A recent study
by Kordes M et al. reported that the sequence of gemcitabine-based therapy after 5-FU/oxaliplatin
with or without irinotecan was associated with poorer outcomes than a 5-FU-based treatment after a
gemcitabine-based doublet therapy [21]. Another study by Caparello and colleagues reports for the
subgroup of patients who received Gem/NabP after the failure of first line FOLFIRINOX disappointing
results in terms of both activity (RR: 7%; DCR: 23%) and survival (median PFS: 1.95 months; median
OS: 5.4 months) [22]. Likewise, also other studies report only modest activity of second line Gem/NabP
with median overall survival rates of 5.69 months and 5.75 months [23,24]. In descending order after
Gem/NabP another frequently used second line therapy option in the earlier cohort was Gem/Erlotinib.
In light of missing data concerning the effectiveness of Gem/Erlotinib as a second line treatment
regimen and considering the only very modest improvement by the addition of erlotinib to gemcitabine
reported in the literature, we believe that this regimen should not be considered as an effective second
line treatment option [10,25]. In contrast to that, the most commonly used second line regimens
in the earlier cohort are proven effective options as second line therapies, which has been shown
particularly for FP/Nal-IRI [13]. This is also reflected by current treatment guidelines which mainly
suggest FP/Nal-IRI after the failure of a gemcitabine-based first line chemotherapy.
There are limited data concerning the impact of new chemotherapy regimens on the outcome of
patients with advanced or metastatic PAC in Caucasians, highlighting the main findings of our study.
We are aware of another study conducted in a Taiwanese cohort, which also observed improved survival
over a seven-year time period up to 2016 [20]. However, the authors associated this development to
the increased use of S-1, which is not in clinical use in non-Asian countries, and thus, makes the results
difficult to compare.
In line with the increased survival of patients treated with modern chemotherapy regimens, we
also noted that the ratio of patients who received a third line therapy increased from 29% to 37% over
time. These numbers also show a positive trend towards a prolonged treatment period when compared
to other studies, which evaluated historical treatment patterns from 2005 to 2015 in Europe, as well as
the US and reported rates between 3 to 22% for third line treatment [16,26,27].
This opens up the discussion for the optimal treatment sequences. The mOS seen across the
analyzed first to second line treatment sequences was encouraging, ranging from 13.62 to 15.64 months.
Given that FOLFIRINOX is associated with a higher toxicity rate, it is noteworthy that the survival
of patients who also received a second line therapy was comparable and did not differ significantlyJ. Clin. Med. 2020, 9, 648 13 of 15
from patients, who had not been treated with mFOLFIRINOX in the first line. There are limiting
data concerning the effectiveness of different treatment sequences, but a recently published study,
which evaluated the use of Gem/NabP followed by mFOLFIRINOX or vice versa in 48 patients did not
report any difference in survival between the two groups (mOS 13.7 and 13.8 months, p = 0.9) [28].
Supporting these and our findings, also a study by Glassman and colleagues reported promising
survival rates for the sequence Gem/NabP followed by FP/Nal-IRI (mOS 23.0 months). They did not
find a significant difference to the sequence FOLFIRINOX followed by Gem/NabP and FP/Nal-IRI
(mOS 25.5 months) [29]. Furthermore, in the previously mentioned study by Kordes et al. patients
who received FOLFIRINOX had a shorter median OS (9.9 months, 95% CI; 8.1–11.7) than previously
reported [21]. In that respect and in light of no head-to-head prospective comparison trials, there is still
no evidence that FOLFIRINOX in the palliative setting is associated with increased survival compared to
Gem/NabP. This triplet-therapy, however, is regarded more toxic when compared to doublet-regimens,
which should be considered in particular if palliation is the primary goal of the treatment.
Our study has several limitations, including being conducted as a single-institution analysis,
the relatively small sample size of the different sequence subgroups, the inclusion of patients only
when they were presented to the multidisciplinary tumor board, its retrospective character, as well
as missing data for adverse events and toxicity. Furthermore, we cannot rule out a possible bias
resulting from potential earlier switching to second line chemotherapy in the earlier time cohort, due
to closer monitoring of disease activity. However, we have no reason to believe that this has occurred
because standard diagnostic and therapeutic work-up, including intervals between reassessment
of treatment responses have not changed during the observational period. Moreover, provision of
better supportive therapy, which would allow more patients to complete systemic treatment for
advanced-stage PAC could have impacted the results of our study. In this respect, there might
also be additional influencing factors like better handling of dose adjustments when encountering
toxicities. These potential influencing factors are, however, not very likely to explain the improved
survival between our cohorts, as individual components of the different chemotherapies like platinum
salts, fluoropyrimidines, irinotecan, gemcitabine, as well as erlotinib and nab-paclitaxel are classic
antineoplastic drugs which were already in use long before the observation period of this study started.
Thus, it is not very likely that our clinical management concerning toxicities and dose adjustments has
changed during 2011 and 2017.
Emerging promising predictive biomarkers like mismatch-repair deficiency (or MSI-high) for
checkpoint blockade or BRCA mutations for PARP inhibitors and platinum salts are currently entering
the clinic, but have not been used for any patient in the current study [30,31]. With the year 2018, our
cancer center started to implement testing for mismatch-repair deficiency and BRCA mutations of
tumors from PAC patients. Although, only a small subset of patients is affected by these conditions, it
is an important step towards personalized treatment of PAC patients, which will hopefully improve
the prognosis and add new effective treatment options.
5. Conclusions
This study describes the changes in the treatment landscape in the clinical management of patients
with unresectable PAC and furthermore underscores the effectiveness of the new chemotherapy
regimens, which hopefully invigorates the discussion about optimal treatment sequencing, as well as
the choice of the optimal frontline regimen. It is encouraging that survival rates have increased at our
institution. This positive trend is most likely explained by the introduction of novel treatment options.
Furthermore, the high rate of patients that started a third line therapy (37%) is stimulating. Additional
analyses of sequential treatment in a sufficiently large study population are warranted.
Author Contributions: Conceptualization, M.K. and G.W.P.; data curation, M.K., M.U., M.S., G.V.K., W.S. and
G.W.P.; formal analysis, M.K., M.U. and G.W.P.; investigation, M.K. and G.W.P.; methodology, M.K., M.U., D.B.
and G.W.P.; supervision, G.W.P.; visualization, M.K.; writing—original draft, M.K. and G.W.P.; writing—reviewJ. Clin. Med. 2020, 9, 648 14 of 15
and editing, M.U., D.B., M.S., G.V.K. and W.S. All authors have read and agreed to the published version of
the manuscript.
Funding: This research received no external funding.
Acknowledgments: We want to thank for the biostatistical support, which was provided by ASOKLIF
(Arbeitsgruppe zur Systemoptimierung klinischer Forschungsprojekte).
Conflicts of Interest: G.W.P.: Personal financial interests: Merck Serono, Roche, Amgen, Sanofi, Lilly, Servier,
Taiho, Bayer, Halozyme, BMS, Celgene, Pierre Fabre, Shire, Institutional financial interests—clinical trials: Celgene,
Array, Servier, Bayer, BostonBiomedical, Merck, BMS; All other authors declare no conflict of interest.
References
1. Rahib, L.; Smith, B.D.; Aizenberg, R.; Rosenzweig, A.B.; Fleshman, J.M.; Matrisian, L. Projecting cancer
incidence and deaths to 2030: The unexpected burden of thyroid, liver, and pancreas cancers in the United
States. Cancer Res. 2014, 74, 2913–2921. [CrossRef]
2. Malvezzi, M.; Bertuccio, P.; Rosso, T.; Rota, M.; Levi, F.; La Vecchia, C.; Negri, E. European cancer mortality
predictions for the year 2015: Does lung cancer have the highest death rate in EU women? Ann. Oncol. 2015,
26, 779–786. [CrossRef]
3. Singhi, A.D.; Koay, E.J.; Chari, S.T.; Maitra, A. Early Detection of Pancreatic Cancer: Opportunities and
Challenges. Gastroenterology 2019, 156, 2024–2040. [CrossRef]
4. Kleeff, J.; Korc, M.; Apte, M.; La Vecchia, C.; Johnson, C.D.; Biankin, A.V.; Neale, R.E.; Tempero, M.;
Tuveson, D.A.; Hruban, R.H.; et al. Pancreatic cancer. Nat. Rev. Dis. Primers 2016, 2, 16022. [CrossRef]
5. Balachandran, V.P.; Beatty, G.L.; Dougan, S.K. Broadening the Impact of Immunotherapy to Pancreatic
Cancer: Challenges and Opportunities. Gastroenterology 2019, 156, 2056–2072. [CrossRef]
6. Neesse, A.; Bauer, C.A.; Öhlund, D.; Lauth, M.; Buchholz, M.; Michl, P.; Tuveson, D.A.; Gress, T. Stromal
biology and therapy in pancreatic cancer: Ready for clinical translation? Gut 2019, 68, 159–171. [CrossRef]
7. Burris, A.H.; Moore, M.J.; Andersen, J.; Green, M.R.; Rothenberg, M.L.; Modiano, M.R.; Cripps, M.C.;
Portenoy, R.K.; Storniolo, A.M.; Tarassoff, P.; et al. Improvements in survival and clinical benefit with
gemcitabine as first-line therapy for patients with advanced pancreas cancer: A randomized trial. J. Clin.
Oncol. 1997, 15, 2403–2413. [CrossRef]
8. Heinemann, V.; Böck, S.; Hinke, A.; Labianca, R.; Louvet, C. Meta-analysis of randomized trials: Evaluation
of benefit from gemcitabine-based combination chemotherapy applied in advanced pancreatic cancer. BMC
Cancer 2008, 8, 82. [CrossRef]
9. Sultana, A.; Smith, C.T.; Cunningham, D.; Starling, N.; Neoptolemos, J.P.; Ghaneh, P. Meta-analyses of
chemotherapy for locally advanced and metastatic pancreatic cancer. J. Clin. Oncol. 2007, 25, 2607–2615.
[CrossRef]
10. Moore, M.J.; Goldstein, D.; Hamm, J.; Figer, A.; Hecht, J.R.; Gallinger, S.; Au, H.J.; Murawa, P.; Walde, D.;
Wolff, R.A.; et al. Erlotinib Plus Gemcitabine Compared With Gemcitabine Alone in Patients With Advanced
Pancreatic Cancer: A Phase III Trial of the National Cancer Institute of Canada Clinical Trials Group. J. Clin.
Oncol. 2007, 25, 1960–1966. [CrossRef]
11. Conroy, T.; Desseigne, F.; Ychou, M.; Bouche, O.; Guimbaud, R.; Bécouarn, Y.; Adenis, A.; Raoul, J.-L.;
Gourgou-Bourgade, S.; De La Fouchardiere, C.; et al. FOLFIRINOX versus gemcitabine for metastatic
pancreatic cancer. N. Engl. J. Med. 2011, 364, 1817–1825. [CrossRef]
12. Von Hoff, D.D.; Ervin, T.; Arena, F.P.; Chiorean, E.G.; Infante, J.; Moore, M.; Seay, T.; Tjulandin, S.A.; Ma, W.W.;
Saleh, M.N.; et al. Increased survival in pancreatic cancer with nab-paclitaxel plus gemcitabine. N. Engl.
J. Med. 2013, 369, 1691–1703. [CrossRef]
13. Wang-Gillam, A.; Li, C.-P.; Bodoky, G.; Dean, A.; Shan, Y.-S.; Jameson, G.; Macarulla, T.; Lee, K.-H.;
Cunningham, D.; Blanc, J.F.; et al. Nanoliposomal irinotecan with fluorouracil and folinic acid in metastatic
pancreatic cancer after previous gemcitabine-based therapy (NAPOLI-1): A global, randomised, open-label,
phase 3 trial. Lancet 2016, 387, 545–557. [CrossRef]
14. Oettle, H.; Riess, H.; Stieler, J.M.; Heil, G.; Schwaner, I.; Seraphin, J.; Görner, M.; Mölle, M.; Greten, T.F.;
Lakner, V.; et al. Second-line oxaliplatin, folinic acid, and fluorouracil versus folinic acid and fluorouracil
alone for gemcitabine-refractory pancreatic cancer: Outcomes from the CONKO-003 trial. J. Clin. Oncol.
2014, 32, 2423–2429. [CrossRef]J. Clin. Med. 2020, 9, 648 15 of 15
15. Gill, S.; Ko, Y.-J.; Cripps, C.; Beaudoin, A.; Dhesy-Thind, S.; Zulfiqar, M.; Zalewski, P.; Do, T.; Cano, P.;
Lam, W.Y.H.; et al. PANCREOX: A Randomized Phase III Study of Fluorouracil/Leucovorin With or Without
Oxaliplatin for Second-Line Advanced Pancreatic Cancer in Patients Who Have Received Gemcitabine-Based
Chemotherapy. J. Clin. Oncol. 2016, 34, 3914–3920. [CrossRef]
16. Abrams, T.A.; Meyer, G.; Meyerhardt, J.A.; Wolpin, B.M.; Schrag, D.; Fuchs, C.S. Patterns of Chemotherapy
Use in a U.S.-Based Cohort of Patients With Metastatic Pancreatic Cancer. Oncologist 2017, 22, 925–933.
[CrossRef]
17. Nagai, K.; Terashima, T.; Yamashita, T.; Kido, H.; Hayashi, K.; Sunagozaka, H.; Nakai, R.; Mizuno, H.;
Hayakawa, H.; Nomura, Y.; et al. Dynamical Changes of Treatment Patterns and Outcomes of Unresectable
Pancreatic Cancer Patients in Real-Life Practice. J. Clin. Oncol. 2019, 37, 407. [CrossRef]
18. Cheung, W.Y.; Zhang, H.; Tang, P.A.; Spratlin, J.; Lee-Ying, R.M.; Goodwin, R.A.; Meyers, B.M.; Armstrong, D.;
Ramjeesingh, R.; Vickers, M.M.; et al. A real world multicenter study of first (1L) and second (2L) line
treatment patterns and outcomes in advanced pancreatic cancer (APC). J. Clin. Oncol. 2018, 36, 476. [CrossRef]
19. Terashima, T.; Yamashita, T.; Sakai, A.; Ohta, H.; Hinoue, Y.; Toya, D.; Kawai, H.; Yonejima, M.; Urabe, T.;
Noda, Y.; et al. Treatment Patterns and Outcomes of Unresectable Pancreatic Cancer Patients in Real-Life
Practice: A Region-Wide Analysis. Jpn. J. Clin. Oncol. 2018, 48, 966–973. [CrossRef]
20. Chou, W.-C.; Chen, Y.-Y.; Hung, C.-Y.; Chen, J.-S.; Lu, C.-H.; Chang, P.-H. Evolution of the Chemotherapeutic
Landscape and Survival Outcome in Patients With Metastatic Pancreatic Cancer: A Four-Institute Cohort
Study in Taiwan, 2010-2016. Cancer Manag. Res. 2019, 11, 2119–2127. [CrossRef]
21. Kordes, M.; Yu, J.; Malgerud, O.; Liljefors, M.G.; Löhr, J.M. Survival Benefits of Chemotherapy for Patients
With Advanced Pancreatic Cancer in A Clinical Real-World Cohort. Cancers 2019, 11, 1326. [CrossRef]
22. Caparello, C.; Vivaldi, C.; Fornaro, L.; Musettini, G.; Pasquini, G.; Catanese, S.; Masi, G.; Lencioni, M.;
Falcone, A.; Vasile, E. Second-Line Therapy for Advanced Pancreatic Cancer: Evaluation of Prognostic
Factors and Review of Current Literature. Futur. Oncol. 2016, 12, 901–908. [CrossRef]
23. Zhang, H.; Kellett, C.; Lambert, P.; Kim, C.A. Efficacy and Tolerability of Second-Line Nab-Paclitaxel and
Gemcitabine After Failure of First-Line FOLFIRINOX for Advanced Pancreas Cancer: A Single-Institution
Experience. Clin. Color. Cancer 2018, 17, e451–e456. [CrossRef]
24. Zhang, Y.; Hochster, H.S.; Stein, S.; Lacy, J. Gemcitabine Plus Nab-Paclitaxel for Advanced Pancreatic Cancer
After First-Line FOLFIRINOX: Single Institution Retrospective Review of Efficacy and Toxicity. Exp. Hematol.
Oncol. 2015, 4, 29. [CrossRef]
25. Shin, S.; Park, C.M.; Kwon, H.; Lee, K.-H. Erlotinib Plus Gemcitabine Versus Gemcitabine for Pancreatic
Cancer: Real-World Analysis of Korean National Database. BMC Cancer 2016, 16, 443. [CrossRef]
26. Smyth, E.N.; Bapat, B.; Ball, D.E.; André, T.; Kaye, J.A. Metastatic Pancreatic Adenocarcinoma Treatment
Patterns, Health Care Resource Use, and Outcomes in France and the United Kingdom Between 2009 and
2012: A Retrospective Study. Clin. Ther. 2015, 37, 1301–1316. [CrossRef]
27. Seal, B.; Xia, F.; Rietschel, P.; Germino, R.; Asche, C.; D’Souza, A.; Morland, K.; Eaddy, M. Treatment Patterns
And Cost Of Care For Patients With Pancreatic Cancer. Value Heal. 2014, 17, A132. [CrossRef]
28. Vogl, U.; Andalibi, H.; Klaus, A.; Vormittag, L.; Schima, W.; Heinrich, B.; Kafka, A.; Winkler, T.; Öhler, L.
Nab-Paclitaxel and Gemcitabine or FOLFIRINOX As First-Line Treatment in Patients With Unresectable
Adenocarcinoma of the Pancreas: Does Sequence Matter? BMC Cancer 2019, 19, 28. [CrossRef]
29. Glassman, D.C.; Palmaira, R.L.; Covington, C.M.; Desai, A.M.; Ku, G.Y.; Li, J.; Harding, J.J.; Varghese, A.M.;
O’Reilly, E.; Yu, K.H. Nanoliposomal Irinotecan With Fluorouracil for the Treatment of Advanced Pancreatic
Cancer, a Single Institution Experience. BMC Cancer 2018, 18, 693. [CrossRef]
30. Hu, Z.I.; Shia, J.; Stadler, Z.K.; Varghese, A.M.; Capanu, M.; Salo-Mullen, E.; Lowery, M.A.; Diaz, L.A.;
Mandelker, D.; Yu, K.H.; et al. Evaluating Mismatch Repair Deficiency in Pancreatic Adenocarcinoma:
Challenges and Recommendations. Clin. Cancer Res. 2018, 24, 1326–1336. [CrossRef]
31. Golan, T.; Hammel, P.; Reni, M.; Van Cutsem, E.; Macarulla, T.; Hall, M.J.; Park, J.-O.; Hochhauser, D.;
Arnold, D.; Oh, D.Y.; et al. Maintenance Olaparib for Germline BRCA-Mutated Metastatic Pancreatic Cancer.
N. Engl. J. Med. 2019, 381, 317–327. [CrossRef] [PubMed]
© 2020 by the authors. Licensee MDPI, Basel, Switzerland. This article is an open access
article distributed under the terms and conditions of the Creative Commons Attribution
(CC BY) license (http://creativecommons.org/licenses/by/4.0/).You can also read