Survey on the Access to Finance of Enterprises in the euro area - October 2017 to March 2018
←
→
Page content transcription
If your browser does not render page correctly, please read the page content below

Survey on the Access
to Finance of Enterprises
in the euro area
October 2017 to March 2018

 June 2018
Contents
Introduction                                                                               2

1      Overview of the results                                                             3

2      The financial situation of SMEs in the euro area                                    6

       2.1     Slow improvement in the financial situation of euro area SMEs               6

       Box 1 Distressed and profitable firms: two new indicators on the
            financial position of enterprises                                              9

       2.2     SMEs continued to rank access to financing as their least
               important concern                                                          11

3      External sources of financing and needs of SMEs in the euro area                   14

       3.1     Banks remained the most relevant source of financing                       14

       3.2     Demand for external financing increased                                    18

       3.3     SMEs continued to use financing mostly for fixed investments,
               inventory and working capital                                              20

4      Availability of external financing for SMEs in the euro area                       23

       4.1     Improved availability of external financing, with some moderation
               particularly for the larger firms                                          23

       4.2     Sustained decline in the percentage of SMEs facing financing
               obstacles                                                                  28

       4.3     Signs of continued falling interest rates and a slower rise in non-
               interest costs                                                             30

5      Expectations regarding access to financing                                         35

       5.1     Expectations of SMEs about further improvements in access to
               external financing remain comparatively solid                              35

Annexes                                                                                   37

       Annex 1 Overview of the survey replies – selected charts                           37

       Annex 2 Descriptive statistics for the sample of enterprises                       43

       Annex 3 Methodological information on the survey                                   45

Survey on the Access to Finance of Enterprises in the euro area – October 2017 to March
2018                                                                                      1
Introduction
This report presents the main results of the 18th round of the Survey on the Access
to Finance of Enterprises (SAFE), which was conducted between 12 March and 20
April 2018. The survey covers the period from October 2017 to March 2018. The
total euro area sample size was 11,733 enterprises, of which 10,720 (91%) had
fewer than 250 employees. 1
The report provides evidence of changes in the financial situation of enterprises and
documents trends in the needs for and the availability of external financing. It
includes results on small and medium-sized enterprises (SMEs) as well as large
firms, and examines developments both at the euro area level and in individual
countries.
1
See Annex 3 for details on methodological issues related to the survey structure.
Survey on the Access to Finance of Enterprises in the euro area – October 2017 to March
2018 − Introduction 21 Overview of the results
For the first time since 2009, availability of skilled labour has become the
dominant concern for euro area SMEs, together with the difficulty of finding
customers, while access to financing was considered the least important
obstacle. As in previous editions, the 18th round of the Survey on the Access to
Finance of Enterprises (SAFE) also asked entrepreneurs to indicate the most
pressing problem facing their company. Availability of skilled labour has become the
main issue for euro area SMEs (24%, compared to 23% in the previous survey
wave), together with the difficulty of finding customers (23%, down from 24%).
Access to financing, on the other hand, was considered the least important obstacle
(8%, unchanged). SMEs in Greece continued to be disproportionately affected by
lack of access to financing, with 21% mentioning it as their most important obstacle.
At 10%, Italy represented the second largest percentage of SMEs to report access to
financing as their dominant concern.
Euro area SMEs continued to indicate improvements in their overall financial
situation during the reference period, albeit at a slower pace. In particular, a
smaller net percentage 2 of SMEs reported a higher turnover (24%, from 27%), a
finding that applied to firms regardless of size, class and country. The implied
moderation in the growth of turnover was also reflected in profits, as a net
percentage of 4% of euro area SMEs reported increases in profits (down from 5%).
Cross-country differences in profits were strongly correlated with turnover trends.
Euro area enterprises continued to report, on balance, rising costs amid
improvements in their debt situation and higher investment. The net percentage
of SMEs indicating an increase in labour costs reached 50% (compared to 49%),
while the net percentage of firms reporting an increase in other costs (i.e. material
and energy) rose to 54% (up from 48%). In this round, a small net percentage of
SMEs reported an increase in interest expenses (2%, from -2%), while declining
leverage was signalled by fewer SMEs (-7%, from -10%). The broad-based
economic expansion was reflected in the investment and hiring decisions. In net
terms, 19% of SMEs reported increases in fixed investments (from 17%), 7% in
inventories and working capital (from 8%) and 12% in the number of employees
(from 14%).
Demand for external financing increased over the period under review. In net
terms, euro area SMEs reported a slight increase for bank-related products (3% for
bank loans, from 0%, and 7% for credit lines, from 4%) (see Table A, second
column). About 11% of SMEs, on balance, reported an increased need for trade
credit (from 9%), and 12% indicated a higher demand for leasing or hire-purchase
(from 11%). Fixed investments and inventory and working capital remained the two
most important purposes for which SMEs used their total (internal and external)
2
Net terms or net percentages are defined as the difference between the percentage of enterprises
reporting that a given factor has increased and the percentage of those reporting that it has declined.
Survey on the Access to Finance of Enterprises in the euro area – October 2017 to March
2018 − Overview of the results 3financing, with their importance increasing strongly with firm size. Moreover, a
growing number of SMEs used financing to recruit and train new employees and to
develop and launch new products.
SMEs continued to indicate improvements in the availability of external
sources of financing. The net percentage of SMEs reporting an improvement in the
availability of bank loans increased to 14% (from 12%) (see Table A, column six).
SMEs in Spain, Portugal and Ireland perceived the availability of bank loans to have
improved the most. Greece, on the other hand, continued to be the only country
where SMEs indicated a net deterioration in the availability of bank loans.
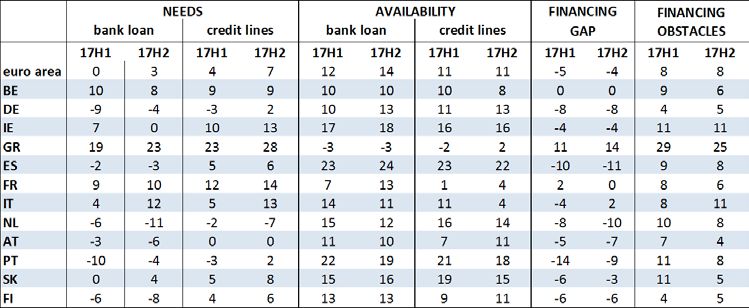
Table A
Latest developments in SAFE country results for SMEs
(over the preceding six months; net percentage of respondents)
Note: For the definitions of needs, see the note to Chart 11, for availability, see the note to Chart 15 and for the financing gap, see the
note to Chart 17. 17H1 refers to round seventeen (April-September 2017) and 17H2 to round eighteen (October 2017-March 2018).
SMEs perceived all macroeconomic and firm-related factors examined in the
survey to positively affect the availability of external financing, with no major
changes from the last survey. The net percentage of SMEs to have reported a
positive impact on the availability of external financing, as a result of the general
economic outlook, remained broadly unchanged at 13%, with some variation across
countries. At the same time, euro area SMEs continued to report improvements
based on their firm-specific outlook (22%), capital position (21%), and credit history
(20%), which was broadly unchanged when compared to the previous survey round.
The external financing gap of SMEs remained negative at the euro area level
(see Table A, column 10). A negative financing gap indicates that the increase in the
need for external financing is smaller than the improvement in the access to external
financing. Only SMEs in Greece, and, to a lesser extent, in Italy reported a positive
financing gap.
The overall indicator of financing obstacles 3 to bank loans for SMEs remained
unchanged at 8% (see Table A, last column). While the percentages of SMEs to
3
The financing obstacles indicator is the sum of the percentages of SMEs reporting rejections of loan
applications, loan applications for which only a limited amount was granted, and loan applications
which resulted in an offer that was rejected by the SMEs owing to borrowing costs that were too high,
as well as the percentage of SMEs which did not apply for a loan for fear of rejection.
Survey on the Access to Finance of Enterprises in the euro area – October 2017 to March
2018 − Overview of the results 4report difficulties in accessing bank loans have diminished in most countries, financing obstacles were seen to increase predominantly in Italy. In this survey round, 29% (from 27%) of SMEs applied for a bank loan. The rate of fully successful loan applications reached 76% (up from 74%), while the rejection rate declined slightly (4%, from 5%). On balance, SMEs reported that terms and conditions for bank financing had improved. SMEs continued to report, on balance, a decline in interest rates (-1%), albeit much less so than in the previous wave (-5%). At the same time, 26% (from 30%) of SMEs continued to signal higher levels of other costs of financing, such as charges, fees and commissions. As for non-price terms and conditions, SMEs continued to indicate, on balance, increases in the available size (11%), maturity (2%), but also increases in collateral requirements (13%), all broadly unchanged from the previous survey round. The financial situation of large enterprises remained better than that of SMEs, as they continued to report marked increases in both turnover and profits. Around 41% of large firms applied for a bank loan, with a success rate that was much higher (83%) and a rejection rate that was much lower (1%) than those of SMEs. According to the survey results, the average interest rate charged to large enterprises on credit lines was about 210 basis points lower than that paid by SMEs. Large firms therefore continued to benefit from better access to financing than SMEs. SMEs tend to have long-term relationships with few banks toward which they tend to concentrate their borrowing. To emphasize the importance of the banking system for the financing decisions of firms, this survey round included some ad hoc questions on bank relationships along three dimensions: number, duration and exclusivity. The survey responses show that there is a strong negative correlation between the size of firms (and the number of banks with which firms do business) and the concentration of bank debt in the main bank. In sum, the survey results are consistent with a continuing economic expansion supported by favourable financing conditions. Nevertheless, in this round, SMEs in various different countries pointed to some supply-side constraints in their business activities, but also to some moderation in demand growth. Survey on the Access to Finance of Enterprises in the euro area – October 2017 to March 2018 − Overview of the results 5
2     The financial situation of SMEs in the
      euro area

2.1   Slow improvement in the financial situation of euro area
      SMEs
      In the period between October 2017 and March 2018, the financial situation of
      euro area SMEs was consistent with a broad-based economic expansion
      which continued to be supported by favourable financing conditions, with
      some signals, however, of moderation (see Chart 1).

      Chart 1
      Change in the income and debt situation of euro area enterprises
      (over the preceding six months; net percentage of respondents)

                                         SMEs               micro              small               medium              large
          80

          60

          40

          20

          0

      -20

      -40

      -60
                '11     '17 '11      '17 '11      '17 '11       '17 '11            '17 '11     '17 '11       '17 '11           '17 '11    '17
                 Turnover   Labour costs Other costs    Interest          Profit        Debt-to-       Fixed    Inventories        Number
                                                       expenses                          assets     Investments     and              of
                                                                                          ratio                   working         employees
                                                                                                                  capital

      Q2. Have the following company indicators decreased, remained unchanged or increased over the past six months?

      Base: All enterprises. Figures refer to rounds three (March-September 2010) to eighteen (October 2017-March 2018) of the survey.
      Note: The net percentage is the difference between the percentage of enterprises reporting an increase for a given factor and that
      reporting a decrease. From round eleven onwards (April-September 2014), the concept of “Net interest expenses (what you pay in
      interest for your debt minus what you receive in interest for your assets)” was changed to “Interest expenses (what your company pays
      in interest for its debt)”.

      The net percentage 4 of euro area SMEs 5 reporting an increase in turnover
      declined (24%, from 27% during the previous survey period 6), signalling some
      moderation in the economic expansion. As in previous survey rounds, the net
      percentage of firms signalling a higher turnover increased with size. While on
      balance 12% (from 15%) of micro firms reported a higher turnover, the

      4
               Net terms or net percentages are defined as the difference between the percentage of enterprises
               reporting that a given factor has increased and the percentage of those reporting that it has declined.
      5
               Micro enterprises are enterprises with 1-9 employees, while small enterprises are those with 10-49
               employees, medium-sized enterprises have 50-249 employees and large enterprises have more than
               250 employees. SMEs comprise micro, small and medium-sized enterprises.
      6
               The reference period for the previous survey round was April to September l2017.

      Survey on the Access to Finance of Enterprises in the euro area – October 2017 to March
      2018 − The financial situation of SMEs in the euro area                                                                                   6
corresponding share of large firms was 50% (from 51%), with small and medium- sized firms in between (29% and 41%, respectively, from 34% and 43%). Euro area enterprises continued to report, on balance, rising costs amid improvements in their debt situation and higher investment. A large net percentage of euro area SMEs across all size categories continued to signal rising labour costs (50%, from 49%). On balance, micro firms (44%, from 42%) appeared less exposed to labour cost pressures than small (55%, unchanged), medium (57%, broadly unchanged), and large firms (59%, from 54%). As regards net increases in other costs, large firms (52%, from 48%) and SMEs (54%, from 48%) were affected broadly to the same extent. The moderation in turnover was also reflected in profits, as a net percentage of 4% of euro area SMEs reported increases in profits (from 5%). While few micro firms continued to report declining profits (-4%, from -3%), improvements were reported by the other firm size classes, albeit with lower percentages than in the previous survey round. Notably, a smaller net percentage of small firms (8%, from 9%) and medium firms (14% from 16%) recorded increasing profits. Yet, profits continued to be strongly associated with company size, as 21% of large firms signalled an increase (from 22%). Euro area enterprises continued to deleverage, however less so than in the previous survey round. In net terms, the percentage of SMEs indicating a decline in their debt-to-asset ratio declined (-7%, from -10%), with lower percentages among micro (-5% from -8%) and small firms (-9 from -13%). Among large enterprises, the net percentage signalling reductions in leverage increased slightly (-11%, from -10%). In this survey round, a small net percentage of SMEs reported an increase in interest expenses (2%, from -2%). The average masks considerable heterogeneity with regard to firm size. While, on balance, 7% of micro enterprises reported an increase in interest expenses (from 5%), a sizeable percentage of large enterprises continued to indicate lower interest expenses (-11%, from -14%). The broad-based economic expansion was also reflected in investment and hiring decisions. On balance, euro area SMEs continued to report rising fixed investments (19%, from 17%), inventories and working capital (7%, form 8%) and number of employees (12%, from 14%). These positive developments applied to firms of all size categories, whereas the net percentages of large firms are more than double those of SMEs along each of the three dimensions. The moderation in turnover developments was visible across some countries. Among the large euro area countries, the net percentage of SMEs indicating a higher turnover was largest in Germany (34%, from 35%), followed by France (21% from 20%), Spain (20%, from 26%) and Italy (9%, from 17%, see Chart 2). Fewer SMEs reported a higher turnover, also in the other euro area countries, including Greece, where SMEs reported, on balance, an unchanged turnover since the last survey round (0%, from 5%, see Chart 1a in Annex 1). Survey on the Access to Finance of Enterprises in the euro area – October 2017 to March 2018 − The financial situation of SMEs in the euro area 7
As in previous rounds of the survey, profit dynamics vary greatly from country
to country. Among the large euro area countries, a net percentage of SMEs in
Germany (15%, unchanged) and Spain (4%, from 7%) reported increasing profits,
while French (-1%, from -5%) and Italian SMEs (-14%, from -11%) signalled a
decline. In all other euro area countries with the exception of Greece, fewer SMEs
reported, on balance, positive profits (see Chart 1a in Annex 1). In Greece a large
percentage of SMEs signalled decreasing profits (-40%, from -31%).

Across countries, euro area enterprises continued to deleverage but less so
than in the previous survey round. Among the large countries, on balance, -9% of
SMEs in Germany (from -13%), -9 % in Spain (from -12%) -8% in France (from -6%)
reported a reduction in the debt-to-asset ratio, while Italian SMEs reported an
increase in leverage (1%, from -3%). Among other euro area economies, only Greek
SMEs indicated an increase in the debt-to-asset ratio (3%, from -1%, see also Chart
2a in Annex 1).

In line with the moderation in the deleveraging process, most euro area SMEs
indicated an increase in interest expenses, albeit country-specific
developments differed. Among the large economies, the highest net percentages
were recorded by Italian (13%, from 5%) and French SMEs (9%, from 6%), while
German SMEs continued to report lower net interest expenditures (-10%, from -
13%). Among the other countries, only SMEs in the Netherlands (-7%, from -15%)
and Austria (-5%, from -8%) reported lower net interest expenditures. On balance,
almost one fifth of Irish SMEs signalled increase interest expenses (from 17%).

Chart 2
Change in the income and debt situation of euro area SMEs
(over the preceding six months; net percentage of respondents)

                                       euro area               DE               ES            FR           IT
 100

  80

  60

  40

  20

   0

 -20

 -40

 -60

 -80

       '11      '17 '11      '17 '11       '17 '11        '17 '11            '17 '11      '17 '11     '17 '11      '17 '11     '17
         Turnover   Labour costs Other costs        Interest        Profit         Debt-to-      Fixed    Inventories    Number
                                                   expenses                        assets     Investments     and          of
                                                                                    ratio                   working     employees
                                                                                                            capital

Q2. Have the following company indicators decreased, remained unchanged or increased over the past six months?

Base: All SMEs. Figures refer to rounds three (March-September 2010) to eighteen (October 2017-March 2018) of the survey.
Note: See the note to Chart 1.

The increase in labour and other costs (material, energy and interest
expenses) was visible across all countries. The net percentage of SMEs
reporting an increase in labour costs was highest in Ireland (68%, from 53%) and
lowest in Italy (41%, from 38%). For other costs, the corresponding net percentage

Survey on the Access to Finance of Enterprises in the euro area – October 2017 to March
2018 − The financial situation of SMEs in the euro area                                                                              8
was highest in Ireland (65%, from 48%) and lowest in the Netherlands (40%, from
35%).
On balance, SMEs in all countries reported increasing fixed investment, while
the increases were more moderate for inventories and working capital and for
employment. Among the large euro area countries, one-fifth of SMEs reported, in
net terms, an increase in fixed investment in Germany, Spain and Italy (20%,
unchanged) with the lowest being in France (17%, from 13%). Among the other euro
area countries, the net percentage of SMEs indicating rising fixed investment was
highest in Portugal (29%). In net terms, inventories and working capital increased at
a slower pace in most countries. Among the large euro area countries, only French
SMEs reported and increase with respect to the previous survey round (5%, from
3%). Only Greek SMEs continued to signal declining inventories and working capital
(-12%, from -9%).
With regard to employment in the large euro area countries, the decline in the net
percentage of SMEs signalling an increase in the number of employees was largest
in Germany (13%, from 18%) and lowest in Italy (8%, from 9%). Among the other
euro area countries, the net percentage of SMEs reporting higher employment is
highest in Ireland and the Netherlands (23%, both).
Box 1
Distressed and profitable firms: two new indicators on the financial position of enterprises
In this survey round, the financial situation of euro area SMEs continued to improve according to
the various dimensions that are considered in the survey.
In this box, two new encompassing indicators are introduced that combine these dimensions with
the aim of distinguishing two main groups of firms: the so-called distressed and the profitable firms.
According to Bendel et al. (2017) 7, distressed firms are defined as those firms that report,
simultaneously, lower turnover, decreasing profits, higher interest expenses and higher or
unchanged debt-to-total assets. These are firms that exhibit difficulties in running their business, in
servicing their debt and which may face more difficulties in accessing financing.
On the other side of the spectrum, a second new indicator includes firms that report,
simultaneously, higher turnover and profits, lower interest expenses and lower debt-to-total assets.
These firms are more likely to be resilient to financial shocks and tend to invest and hire more often
than other firms.
Chart A shows the developments in the distressed and profitable firms over time and by two size
classes: SMEs and large firms. Some stylised facts are revealed. First of all, the improved financial
and business conditions determine a strong decline in the percentage of firms that are vulnerable,
in particular among SMEs. Second, smaller firms remain more vulnerable than large companies,
however, the gap has declined over time. Third, the percentage of profitable firms has remained
7
D. Bendel, M. Demary and M. Voigtlander (2017), “Business financing in Europe: How will higher interest
rates affect companies’ financial situation?”, IW Report, 28/2017.
Survey on the Access to Finance of Enterprises in the euro area – October 2017 to March
2018 − The financial situation of SMEs in the euro area 9almost unchanged among SMEs, while the picture is more variable for large companies. Notably,
since the second half of 2013, there are more large companies in a sound financial condition than
those that are distressed.
Chart A
Distressed and profitable firms
(percentage of all firms; weighted average)
large profitable large distressed SMEs profitable SMEs distressed
15
10
5
0
H1 H2 H1 H2 H1 H2 H1 H2 H1 H2 H1 H2 H1 H2 H1 H2
'10 '11 '12 '13 '14 '15 '16 '17
Q2. Have the following company indicators decreased, remained unchanged or increased over the past six months?
Base: All enterprises. Figures refer to rounds three (March-September 2010) to eighteen (October 2017-March 2018) of the survey.
Focusing on SMEs, these two indicators shed some light on differences across countries. Chart B
shows the two groups of firms in the large four euro area countries. The percentage of distressed
companies was relatively high in Spain and Italy, the two countries affected most by the sovereign
debt crisis. Following the introduction of the non-standard monetary policy measures since late
2011 and in 2014, which have been central in creating favourable financing conditions and in
supporting euro area growth, the number of distressed firms has rapidly decreased in both
countries. In Spain, for instance, the indicator shows that at the peak in the first half of 2012, 26% of
SMEs were in a vulnerable position, while in this survey round the percentage declined significantly,
reaching 3.5%. Similarly, in Italy the peak of distressed firms was reached in the second part of
2012, reaching 26%, and the percentage is now down at around 7%. More interestingly, the
increased pace of economic growth and accommodative monetary policy is also reflected in higher
percentages of profitable firms, notably in Spain. By contrast, in Germany, the percentage of
vulnerable SMEs has remained stable since 2009 (at less than 3%), as is the case for profitable
firms, which on average represent 5% of total German SMEs. For the trend in other euro area
countries, see Chart 3a in Annex 1.
Survey on the Access to Finance of Enterprises in the euro area – October 2017 to March
2018 − The financial situation of SMEs in the euro area 10Chart B
Distressed and profitable firms among selected euro area countries
(percentage of all firms; weighted average)
SMEs distressed SMEs profitable
30
25
20
15
10
5
0
'11 '17 '11 '17 '11 '17 '11 '17 '11 '17
DE ES FR IT euro area
Q2. Have the following company indicators decreased, remained unchanged or increased over the past six months?
Base: All SMEs. Figures refer to rounds three (March-September 2010) to eighteen (October 2017-March 2018) of the survey.
To sum up, these two new indicators enable a concise assessment of the overall financial
conditions of the most and least vulnerable euro area firms across firm size and countries.
2.2 SMEs continued to rank access to financing as their least
important concern
For the first time since 2009, “availability of skilled labour” has become the
dominant concern for euro area SMEs, together with the difficulty of finding
customers, while access to financing was considered the least important
obstacle. In this survey round, 24% of euro area SMEs cited “Availability of skilled
labour” as the main problem for euro area SMEs (compared to 23% in the previous
survey wave), together with the difficulty of finding customers (23%, down from 24%)
(see Chart 3).
For small and medium-sized firms, the percentage of companies citing “Availability of
skilled labour” as their dominant concern (27% and 30%, respectively) was higher
than the percentage of those concerned mainly with “Finding customers” (23% and
24%). For micro firms, a smaller percentage of companies is concerned with finding
skilled staff (20%), perhaps because micro firms exhibit lower demand, while large
firms signalled that the lack of skilled staff had become a pressing problem in their
business activity (27%, from 23%). Access to financing, on the other hand, was
considered the least important obstacle for euro area SMEs (8%, unchanged), after
cost of production (12%, unchanged), competition (12%, down from 13%) and
regulation (13%, up from 12%).
Survey on the Access to Finance of Enterprises in the euro area – October 2017 to March
2018 − The financial situation of SMEs in the euro area 11Concern with access to financing is decreasing with firm size. While for 9% of
micro firms access to financing was the dominant problem, this applied to only 4% of
large companies. A slightly higher percentage of medium-sized companies (7%, from
5%) considered it an obstacle.
Chart 3
The most important problems faced by euro area enterprises
(percentage of respondents)
SMEs micro small medium large
35
30
25
20
15
10
5
0
'11 '17 '11 '17 '11 '17 '11 '17 '11 '17 '11 '17
Finding customers Competition Access to finance Costs of production Availability of Regulation
or labour skilled staff or
experienced
managers
Q0. How important have the following problems been for your enterprise in the past six months?
Base: All enterprises. Figures refer to rounds three (March-September 2010) to eighteen (October 2017-March 2018) of the survey.
Note: The formulation of the question has changed over the survey rounds. Initially, respondents were asked to select one of the
categories as the most pressing problem. From round eight, respondents were asked to indicate how pressing a specific problem was
on a scale from 1 (not pressing) to 10 (extremely pressing). In round seven, the formulation of the question followed the initial phrasing
for half of the sample and the new phrasing for the other half. Additionally, if two or more items had the highest score in question Q0B
on the “pressingness” of the problems, a follow-up question (Q0C) was asked to resolve this, i.e. which of the problems was more
pressing, even if only by a small margin. This follow-up question was removed from the questionnaire in round eleven. The past results
from round seven onwards were recalculated, disregarding the replies to question Q0C. In round twelve, the word “pressing” was
replaced by the word “important”.
The euro area aggregate masks considerable cross-country differences (see Chart 4
and Chart 4a in Annex 1). German (34%) and French SMEs (22%) most frequently
cited the availability of skilled staff as their dominant concern, ahead of finding
customers (29% and 17%, respectively). Spanish (25%) and Italian (22%) SMEs
most often reported finding customers as their main problem.
SMEs in Greece continued to be disproportionately affected by the lack of access to
financing, with 21% mentioning it as their most important problem. At 10%, Italy
represented the second largest percentage of SMEs to report access to financing as
their dominant concern.
Survey on the Access to Finance of Enterprises in the euro area – October 2017 to March
2018 − The financial situation of SMEs in the euro area 12Chart 4
The most important problems faced by euro area SMEs
(percentage of respondents)
SMEs DE ES FR IT
40
35
30
25
20
15
10
5
0
'11 '17 '11 '17 '11 '17 '11 '17 '11 '17 '11 '17
Finding customers Competition Access to finance Costs of production Availability of Regulation
or labour skilled staff or
experienced
managers
Q0. How important have the following problems been for your enterprise in the past six months?
Base: All SMEs. Figures refer to rounds three (March-September 2010) to eighteen (October 2017-March 2018) of the survey.
Note: See the note to Chart 3.
A similar picture emerges when looking at the responses to whether “Access to
finance” was a problem in their current situation on a scale of 1-10. SMEs in Greece
continued to perceive it as a very important issue (rating it at 6.2; see Chart 5). An
average score of 5 was reported by SMEs in Italy, Ireland and Portugal. The
remainder of the countries reported a score close to or below the euro area average
of 4.5, while SMEs in Finland continued to report the lowest average score (3).
Chart 5
Importance of access to financing as perceived by SMEs across euro area countries
(percentages and weighted averages)
low (1-3) medium (4-6) high (7-10) don’t know weighted average
100 10
9
80 8
Weighted average score
7
60 6
5
40 4
3
20 2
1
0 0
'15 '17 '15 '17 '15 '17 '15 '17 '15 '17 '15 '17 '15 '17 '15 '17 '15 '17 '15 '17 '15 '17 '15 '17 '15 '17
BE DE IE GR ES FR IT NL AT PT SK FI euro
area
Q0b. How important have the following problems been for your enterprise in the past six months?
Base: All SMEs. Figures refer to rounds eleven (April-September 2014) to eighteen (October 2017-March 2018) of the survey. Note:
Firms were asked to indicate how important a specific problem was on a scale from 1 (not at all important) to 10 (extremely important).
In the chart, the scale is divided into three categories: low (1-3); medium (4-6); and high importance (7-10). The weighted average
score is an average of the responses using the weighted number of respondents as a weight.
Survey on the Access to Finance of Enterprises in the euro area – October 2017 to March
2018 − The financial situation of SMEs in the euro area 133 External sources of financing and needs
of SMEs in the euro area
3.1 Banks remained the most relevant source of financing
Bank-related products remained the most relevant source of financing for
SMEs compared with market-based instruments and other sources of
financing. From October 2017 to March 2018, just over half of euro area SMEs
considered bank loans and credit lines to be relevant financial instruments for their
businesses (53% and 52%, respectively) (see Chart 6). 8 Leasing or hire-purchase
was relevant for 46%, and 34% of SMEs signalled that grants and subsidised loans
were a potential source of financing. Such loans involve support from public sources
in the form of guarantees or other interventions. About 31% of SMEs considered
trade credit an important financial instrument, followed by 25% which turn instead to
their internal funds to finance their business activities. Finally, 18% of SMEs
signalled other loans, for example from family, friends or related companies as a
relevant source of financing. On the other hand, market-based instruments, such as
equity (11%) and debt securities (3%), but also factoring (9%), were much less
frequently considered to be a potential source of financing.
Chart 6
Relevance of financing sources for euro area SMEs
(over the preceding six months; percentage of respondents)
used in the past six months did not use but relevant not relevant don't know
100
80
60
40
20
0
Factoring
Trade credit
Subsidised
hire-purchase
Equity
Other sources
securities
overdrafts
Bank loans
Retained
Other loans
earnings
Leasing or
Debt
Bank
loan
Q4. Are the following sources of financing relevant to your enterprise, that is to say, have you used them in the past or considered
using them in the future? If “yes”, have you obtained new financing of this type in the past six months?
Base: All SMEs. Figures refer to round eighteen (October 2017-March 2018) of the survey.
The use of all financing instruments increased with firm size. Compared with SMEs,
a greater percentage of large firms reported having used a given financing
8
The formulation of the question allows the relevance of a specific financial instrument to be
disentangled from its usage. See the SAFE questionnaire.
Survey on the Access to Finance of Enterprises in the euro area – October 2017 to March
2018 − External sources of financing and needs of SMEs in the euro area 14instrument of some kind (see Chart 7). Short-term bank financing (credit line/bank
overdraft/credit card) remained the most popular instrument by some margin,
followed by leasing and bank loans. Equity and debt securities, on the other hand,
were among the least frequently used sources of financing. This pattern applied to
both SMEs and large firms.
Chart 7
Use of internal and external financing by euro area enterprises across firm size
(percentage of respondents that had used the respective instrument in the past six months)
Internal funds
50
Subsidised loan
40
30
Other sources Credit lines
20 SMEs
10 micro
Equity 0 Bank loans small
medium
large
Debt securities Other loans
Factoring Trade credit
Leasing or hire-purchase
Q4. Are the following sources of financing relevant to your enterprise, that is to say, have you used them in the past or considered
using them in the future? If “yes”, have you obtained new financing of this type in the past six months?
Base: All enterprises for which the respective instrument is relevant. Figures refer to round eighteen (October 2017-March 2018) of the
survey.
SMEs tend to have long-term relationships with few banks toward which they
tend to concentrate their borrowing. To emphasize the importance of the
banking system for the financing decisions of firms, this survey round
included some ad hoc questions on bank relationships along three
dimensions: number, duration and exclusivity. First, enterprises were asked to
indicate how many banks they had an active relationship with. Unsurprisingly, the
number of banks diminishes with firm size (see Chart 8). SMEs have, on average, a
relationship with less than 3 banks, with 29% signalling that they had a relationship
with only one bank. For micro firms, this percentage rises to 43%. By contrast, for
large companies, the average number of banks is six and only 7% of them said they
had a one-bank relationship.
Survey on the Access to Finance of Enterprises in the euro area – October 2017 to March
2018 − External sources of financing and needs of SMEs in the euro area 15Chart 8
Number of bank relationships by size class
(percentage of respondents)
1 2 3 4 5 or more don't know weighted average (right-hand scale)
60 7
6
5
40
4
3
20
2
1
0 0
Micro Small Medium Large SMEs
QA1. Indicate the number of banks with which your enterprise has an active relationship.
Base: All enterprises for which at least one of the following instruments is relevant: bank loan, grant or subsidised bank loan, credit
line, bank overdraft or credit card overdraft. Figures refer to round eighteen (October 2017-March 2018) of the survey.
A second dimension which is important in the bank-firm relationship is for how long a
firm has worked with its main bank. In the survey, the main bank is defined as the
bank with which the enterprise holds most bank debt. The longer the relationship, the
easier it is for the lender to acquire confidential information on the borrowers, which
is otherwise not publicly available. For firms, this should imply an easier access to
financing. It turns out that, as in previous studies 9, enterprises tend to remain with a
single bank for many years, almost irrespective of their size (see Chart 9).
9
See for instance S. Ongena and D.C. Smith (2001), “The duration of bank relationships”, Journal of
Financial Economics, Vol 61, 2001, pp. 449-75; and R. Guida and V. Sabato ( 2017), “Relationship
Lending and Firms’ leverage: empirical evidence in Europe”, European Financial Management, Vol 23,
pp. 807-835.
Survey on the Access to Finance of Enterprises in the euro area – October 2017 to March
2018 − External sources of financing and needs of SMEs in the euro area 16Chart 9
Duration of relationship with main bank
(percentage of respondents)
less than 5 years 5 to 9 years 10 to 14 years 15 to 24 years 25 or more don't know
30
20
10
0
Micro Small Medium Large SMEs
QA3. For how many years has this bank been the enterprise's main bank?
Base: All enterprises that have at least one active bank and for which at least one of the following instruments is relevant: bank loan,
grant or subsidised bank loan, credit line, bank overdraft or credit card overdraft. Figures refer to round eighteen (October 2017-March
2018) of the survey.
A third dimension is the exclusivity of the relationship between borrowers and
lenders. To cover this dimension, firms were asked to report the percentage of their
total bank debt held at their main bank. The survey responses show that there is a
strong negative correlation between the size of firms (and the number of banks with
which firms work) and the concentration of bank debt in the main bank. For instance,
while there are 36% of micro firms and 32% of SMEs with more than 75% of their
bank debt held by the main bank, the percentage decreases to 16% for large
enterprises.
Across euro area countries, SMEs hold different amounts of bank debt in their
main bank, thus reflecting the different national banking structures. In Chart
10, SMEs with at least one bank relationship are considered. In the Netherlands and
Ireland, where SMEs reported, on average, to have an active relationship with the
lowest number of banks (around 1.5), around 60% of these concentrate more than
75% of their bank debt in the main bank. By contrast, firms tend to distribute their
debt across banks and, as a consequence, reduce the amount held by the main
bank where multiple bank relationships are more common. This is the case for SMEs
in Spain and Italy where firms reported to do business, on average, with more than
three banks.
Survey on the Access to Finance of Enterprises in the euro area – October 2017 to March
2018 − External sources of financing and needs of SMEs in the euro area 17Chart 10
Debt held at main bank and average number of banks – SMEs across euro area
countries
(percentage of respondents)
less than 25% between 25% and 50%
between 50% and 75% more than 75%
enterprise has no bank debt don't know
average number of banks (right-hand scale)
100 4
80
3
60
2
40
1
20
0 0
BE DE IE GR ES FR IT NL AT PT SK FI euro
area
QA1. Indicate the number of banks with which your enterprise has an active relationship.
QA2. What percentage of your enterprise’s total bank debt is held at your main bank?
Base: SMEs for which at least one of the following instruments is relevant: bank loan, grant or subsidised bank loan, credit line, bank
overdraft or credit card overdraft. Figures refer to round eighteen (October 2017-March 2018) of the survey.
3.2 Demand for external financing increased
SMEs increased their demand for all external financing instruments during the
period under review (see Chart 11). SME demand for bank loans 10 increased to 3%
(from 0%), while on balance 7% of SMEs indicated a higher demand for credit lines
(from 4%). A greater net percentage of SMEs reported higher demand for non-bank
financing, with 11% of SMEs reporting a higher need for trade credit (from 9%), and
12% indicating an increase in their need for leasing or hire-purchase (from 11%).
Around 7% of SMEs reported a higher demand for other loans (from 4%).
Large firms more frequently reported an increased demand for external
financing than SMEs. In net terms, 8% of large firms reported an increasing
demand for bank loans (from 5%), while 8% indicated a higher demand for credit
lines (unchanged). On balance, demand for trade credit (11%, from 12%), other
loans (3%, unchanged) also continued to expand. A greater net percentage of large
firms reported a higher demand for leasing (19%, from 15%) in comparison to the
previous survey round
10
See the note to Chart 11. Only survey respondents who report that a particular financing instrument is
relevant for their enterprise are asked about their need for this source of financing.
Survey on the Access to Finance of Enterprises in the euro area – October 2017 to March
2018 − External sources of financing and needs of SMEs in the euro area 18Chart 11
Change in external financing needs of euro area enterprises
(over the preceding six months; net percentage of respondents)
SMEs micro small medium large
25
20
15
10
5
0
-5
-10
'15 '17 '15 '17 '15 '17 '15 '17 '15 '17
Credit lines Bank loans Trade credit Leasing and Other loans
hire-purchase
Q5. For each of the following types of external financing, please indicate if your needs increased, remained unchanged or decreased
over the past six months.
Base: Enterprises for which the respective instrument is relevant. Figures refer to rounds eleven (April-September 2014) to eighteen
(October 2017-March 2018) of the survey.
Note: See the note to Chart 1. The categories “Other loans” and “Leasing or hire-purchase” were introduced in round twelve (October
2014-March 2015). A financing instrument is “relevant” if the enterprise used the instrument in the past six months or did not use it but
has experience of it (for rounds one to ten). From round eleven onwards, the respondents were asked whether the instrument was
relevant, i.e. whether the enterprise had used it in the past or considered using it in the future. Given that the current concept of a
“relevant” financing instrument differs from that used in the past, this might have an impact on the comparability over time for the
following questions. Caution should therefore be exercised when comparing the recent results with those of the previous rounds.
Demand for bank financing differed across the large euro area countries, while
it was more homogenous for credit lines and non-bank financial products.
Needs for bank loans strongly increased in Italy (12%, from 4%) and, to a lesser
extent, in France (10%, from 9%). They continued to decline, but at a slower pace, in
Spain (-3%, from -2%) and Germany (-4%, from -9%; see Chart 12). Also the
demand for credit lines increased in all four countries, particularly in Italy (13%, from
5%). Similarly, SMEs from large countries reported, on balance, higher needs for
trade credit and leasing and hire purchases.
In the other euro area countries, demand for external financing was strongest
in Greece. In Greece, on balance, 23% of SMEs indicated a higher demand for bank
loans (from 19%), and 28% signalled a higher demand for credit lines (from 23%;
see Chart 5a in Annex 1).
Survey on the Access to Finance of Enterprises in the euro area – October 2017 to March
2018 − External sources of financing and needs of SMEs in the euro area 19Chart 12
Change in external financing needs of euro area SMEs
(over the preceding six months; net percentage of respondents)
euro area DE ES FR IT
30
20
10
0
-10
-20
'15 '17 '15 '17 '15 '17 '15 '17 '15 '17
Credit lines Bank loans Trade credit Leasing and hire- Other loans
purchase
Q5. For each of the following types of external financing, please indicate if your needs increased, remained unchanged or decreased
over the past six months.
Base: SMEs for which the respective instrument is relevant. Figures refer to rounds eleven (April-September 2014) to eighteen
(October 2017-March 2018) of the survey.
Note: See the notes to Charts 1 and 11.
3.3 SMEs continued to use financing mostly for fixed
investments, inventory and working capital
Financing from external and internal sources was mainly used for fixed
investment, followed by inventories and working capital. Moreover, a higher
percentage of euro area SMEs used financing to hire and train new employees
and to develop and launch new products than in the previous survey round.
Around 44% of SMEs (from 40%) reported using financing for fixed investment, while
35% (from 33%) mentioned inventory and working capital (see Chart 13).
Survey on the Access to Finance of Enterprises in the euro area – October 2017 to March
2018 − External sources of financing and needs of SMEs in the euro area 20Chart 13
Purpose of the financing as perceived by euro area enterprises
(over the preceding six months; percentage of respondents)
SMEs micro small medium large
70
60
50
40
30
20
10
0
'15 '17 '15 '17 '15 '17 '15 '17 '15 '17
Fixed investment Inventory and working Hiring and training of Developing and Refinancing or paying
capital employees launching new products off obligations
or services
Q6A. For what purpose was financing used by your enterprise during the past six months?
Base: All enterprises. Figures refer to rounds eleven (April-September 2014) to eighteen (October 2017-March 2018) of the survey.
Note: The figures are based on the new question introduced in round eleven (April-September 2014).
Perhaps unsurprisingly, the prevalence of fixed investment was strongly
associated with company size. While 63% of large firms reported using financing
for fixed investment, this applied to only 33% of micro firms. Investment in working
capital and inventories was also correlated with firm size. Less frequently, SMEs
used financing to hire employees (21%, from 16%), develop new products (21%,
from 15%), and refinancing obligations (13%, from 12%).
Among the large euro area countries, German SMEs continued to stand out in terms
of the high prevalence of fixed investment. About 56% of German SMEs used
financing for that purpose, compared with only 34% of Spanish SMEs. Apart from
that, German SMEs more frequently reported using financing for the development of
new products, hiring of employees and refinancing of obligations than SMEs in the
other large euro area economies. Spanish firms continued to use financing for
inventory and working capital (44%) more frequently than for fixed investment (see
Chart 14).
Survey on the Access to Finance of Enterprises in the euro area – October 2017 to March
2018 − External sources of financing and needs of SMEs in the euro area 21Chart 14
Purpose of the financing as perceived by SMEs across euro area countries
(over the preceding six months; percentage of respondents)
euro area DE ES FR IT
60
50
40
30
20
10
0
'15 '17 '15 '17 '15 '17 '15 '17 '15 '17
Fixed investment Inventories and working Hiring and training of Developing and Refinancing or paying
capital employees launching new products off obligations
or services
Q6A. For what purpose was financing used by your enterprise during the past six months?
Base: All SMEs. Figures refer to rounds eleven (April-September 2014) to eighteen (October 2017-March 2018) of the survey.
Note: See the note to Chart 13.
Survey on the Access to Finance of Enterprises in the euro area – October 2017 to March
2018 − External sources of financing and needs of SMEs in the euro area 224 Availability of external financing for
SMEs in the euro area
4.1 Improved availability of external financing, with some
moderation particularly for the larger firms
4.1.1 Improved availability of all external financing sources
In the last round of the survey, SMEs continued to report an improved
availability of external financing sources relevant for their business (see Chart
15). 11 Particularly for bank loans — one of the most important sources of financing
for SMEs — the net percentage of respondents indicating greater availability
increased to 14% (from 12%). For all other financing instruments, the net percentage
of SMEs conveying easier access remained positive and roughly constant, at 11%
for credit lines, 13% for trade credit, 17% for leasing and hire-purchase, and 10% for
other loans.
Chart 15
Change in the availability of external financing for euro area enterprises
(over the preceding six months; net percentage of respondents)
SMEs micro small medium large
40
20
0
-20
-40
'11 '17 '11 '17 '11 '17 '11 '17 '11 '17
Credit lines Bank loans Trade credit Leasing and hire- Other loans
purchase
Q9. For each of the following types of financing, would you say that their availability has improved, remained unchanged or
deteriorated for your enterprise over the past six months?
Base: Enterprises for which the respective instrument is relevant. Figures refer to rounds three (March-September 2010) to eighteen
(October 2017-March 2018) of the survey.
Note: See the note to Charts 1 and 11.
Across firm size, large and medium-sized companies continued to assess the
availability of external financing most positively. However, the difference
11
See the note to Chart 11. Only survey respondents that report that a particular financing instrument (i.e.
bank loan, credit line, trade credit, leasing and hire-purchase or other loans) is relevant for their
enterprise are asked about the availability of this source of financing.
Survey on the Access to Finance of Enterprises in the euro area – October 2017 to March
2018 − Availability of external financing for SMEs in the euro area 23compared to smaller firms narrowed somewhat in recent rounds of the survey. While
the net percentage of firms signalling better access to external financing was on an
upward trend among micro and small enterprises for most financing instruments, it
remained almost unchanged for medium-sized companies and fell slightly for large
enterprises. However, the gaps remained sizeable, particularly in the case of bank
loans where, in net terms, 7% of micro firms reported greater availability, whereas, in
net terms, this figure rose to 24% for large companies. This compares with
somewhat smaller differences in trade credit (7% to 21%), credit lines (5% to 17%),
other loans (6% to 18%) and leasing and hire-purchases (12% to 23%).
Across countries, the indications were somewhat mixed (see Chart 16). A higher
net percentage of respondents indicated greater availability of all types of financing
in France and Germany. In Italy, by contrast, the net percentage of respondents
reporting better access to financing fell across all financing instruments. Lastly,
SMEs in Spain remained most sanguine about their external financing environment.
At the same time, they provided a mixed assessment about changes in their access
to different types of financing in the recent round of the survey, with a rising net
percentage signalling easier access to bank loans and trade credit, but with fewer
firms doing so for credit lines, leasing and hire-purchases and other loans.
Chart 16
Change in the availability of external financing for euro area SMEs
(over the preceding six months; net percentage of respondents)
euro area DE ES FR IT
40
20
0
-20
-40
'11 '17 '11 '17 '11 '17 '11 '17 '11 '17
Credit lines Bank loans Trade credit Leasing and Other loans
hire-purchase
Q9. For each of the following types of financing, would you say that their availability has improved, remained unchanged or
deteriorated for your enterprise over the past six months?
Base: SMEs for which the respective instrument is relevant. Figures refer to rounds three (March-September 2010) to eighteen
(October 2017-March 2018) of the survey.
Note: See the notes to Charts 1 and 11.
In other euro area countries, a broadly unchanged to slightly lower net
percentage of SMEs reported greater availability of banks loans (see Chart 5a
in Annex 1). Whereas SMEs in Belgium (10%), Finland (13%), Ireland (18%) and
Slovakia (16%) signalled close to no change in their access to bank loans, the
assessment by SMEs of the availability of bank loans in Austria (10%, from 11%), the
Netherlands (12%, from 15%) and Portugal (19%, from 22%) worsened somewhat.
In Greece, the only country where more SMEs are still reporting a deterioration
Survey on the Access to Finance of Enterprises in the euro area – October 2017 to March
2018 − Availability of external financing for SMEs in the euro area 24rather than an improvement in the availability of bank loans, the rapid rise in the
(negative) net percentage of respondents towards a more balanced level seen in
previous vintages of the survey came to a halt in the recent round, hovering at -3%.
4.1.2 External financing availability seen to rise faster than needs
For the euro area as a whole, SMEs perceived improvements in their access to
external financing to be larger than increases in corresponding financing
needs, thereby resulting in a negative external financing gap of -4% (see Chart 17).
At the level of individual euro area countries, the financing gap was negative in the
majority of cases, most notably in Germany (-8%, unchanged), the Netherlands (-
10%, from -8%), Portugal (-9%, from -14%) and Spain (-11%, from -10%) (see also
Chart 6a in Annex 1). In Belgium and France, external financing availability and
needs were balanced in the last round of the survey. By contrast, SMEs in Italy
perceived some difficulties in meeting all their external financing needs for the first
time since the April to September 2015 survey, with the financing gap turning from -
4% to +2%. Finally, SMEs in Greece continued to remain financially constrained, with
some of the substantial improvement in the financing gap witnessed in the previous
round of the survey (11% from 24%) partially reversing this time (14%).
Chart 17
Change in the external financing gap perceived by SMEs across euro area countries
(over the preceding six months; weighted net balances)
30
20
10
0
-10
-20
'11 '17 '11 '17 '11 '17 '11 '17 '11 '17
DE ES FR IT euro area
Q5. For each of the following types of external financing, please indicate if your needs increased, remained unchanged or decreased
over the past six months.
Q9. For each of the following types of financing, would you say that their availability has improved, remained unchanged or
deteriorated for your enterprise over the past six months?
Base: SMEs for which the respective instrument is relevant. “Non-applicable” and “Don’t know” answers are excluded. Figures refer to
rounds three (March-September 2010) to eighteen (October 2017-March 2018) of the survey.
Note: See note to Chart 11. The financing gap indicator combines both financing needs and availability of bank loans, credit lines,
trade credit, equity and debt securities at firm level. For each of the five financing instruments, an indicator of a perceived financing
gap change takes the value of 1 (-1) if the need increases/decreases and availability decreases/increases. If enterprises perceive only
a one-sided increase/decrease in the financing gap, the variable is assigned a value of 0.5 (-0.5). The composite indicator is the
weighted average of the financing gap related to the five instruments. A positive value of the indicator suggests an increasing financing
gap. Values are multiplied by 100 to obtain weighted net balances in percentages.
Survey on the Access to Finance of Enterprises in the euro area – October 2017 to March
2018 − Availability of external financing for SMEs in the euro area 25You can also read