Oakridge Centre Retail Impact Assessment - Draft June 2013 Prepared for: By: City of Vancouver
←
→
Page content transcription
If your browser does not render page correctly, please read the page content below
Oakridge Centre Retail Impact Assessment

                                          Draft
                                     June 2013

                                  Prepared for:
                              City of Vancouver

                                            By:
                       Coriolis Consulting Corp.
                            Site Economics Ltd.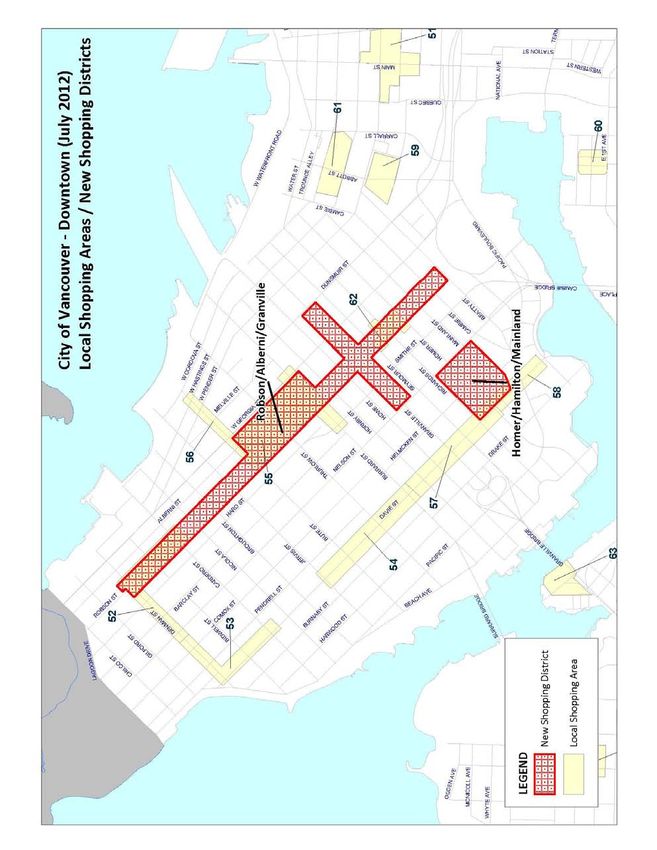
OAKRIDGE CENTRE RETAIL IMPACT ASSESSMENT

Table of Contents

Summary ........................................................................................................................... 1
1.0       Introduction ............................................................................................................ 2
          1.1       Background ........................................................................................................................... 2

          1.2       Objectives ............................................................................................................................. 2

          1.3       Time Frame for the Analysis ............................................................................................... 3

          1.4       Report Format ....................................................................................................................... 4

          1.5       Professional Disclaimer ....................................................................................................... 4

2.0       The Proposed Expansion of Oakridge Centre in the Context of Existing
          Commercial Development in Vancouver ............................................................. 6
          2.1       Composition of Oakridge Centre by Store Category Before and After Expansion ....... 6

          2.2       Existing Retail and Service Floorspace in Vancouver ..................................................... 7

          2.3       Proposed Expansion Compared to Current Zoning and Policy Statement .................... 8

3.0       Approach to the Impact Analysis ......................................................................... 9
          3.1       Retail Categories Included in Impact Assessment ........................................................... 9

          3.2       Impact Assessment Methodology .................................................................................... 11

4.0       Trade Areas for Impact Assessment .................................................................. 13
          4.1       Assessment of Impact on City-Wide Inventory ............................................................... 13

          4.2       Impact on Regional-Oriented Categories......................................................................... 13

          4.3       Neighbourhood Oriented Retail and Service Analysis ................................................... 14

5.0       Impact Assessment ............................................................................................. 16
          5.1       Analysis of Overall Vancouver Retail and Service Inventory ........................................ 16

          5.2       Destination/Regional-Oriented Retail and Service Analysis.......................................... 17

                    5.2.1          Department Store................................................................................................. 18

                    5.2.2          Apparel (Clothing and Shoes) .............................................................................. 20

                    5.2.3          Jewelry ................................................................................................................. 22

                    5.2.4          Home Furnishings ................................................................................................ 24

                    5.2.5          Combined Destination Retail Categories ............................................................. 26

          5.3       Convenience or Neighbourhood-Oriented Retail and Service Analysis ...................... 27

CORIOLIS CONSULTING CORP.                                                                                                                            PAGE I

DRAFT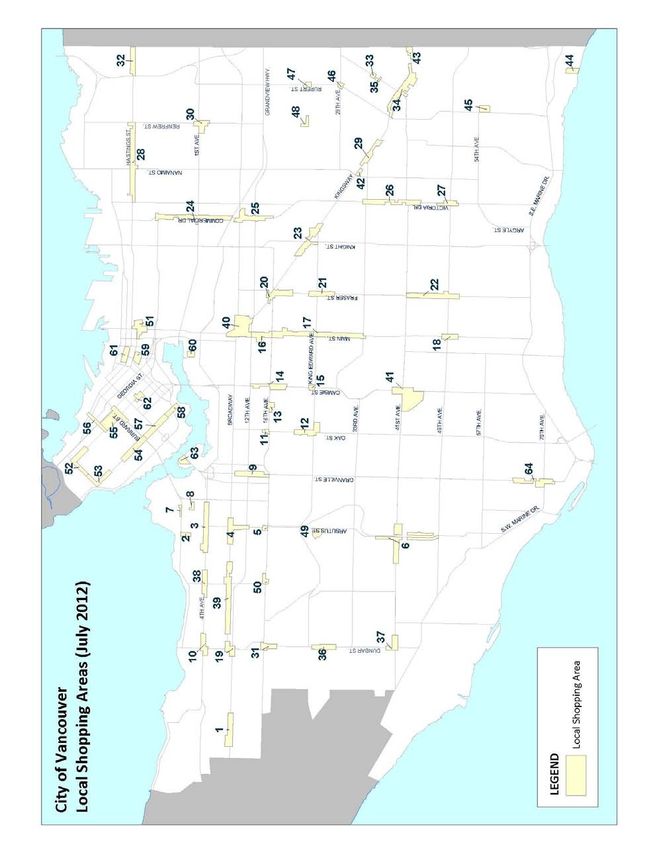
OAKRIDGE CENTRE RETAIL IMPACT ASSESSMENT

                  5.3.1          Supermarket ........................................................................................................ 28

                  5.3.2          Pharmacy ............................................................................................................. 29

         5.4      Summary ............................................................................................................................. 30

6.0      Impact on Individual Commercial Areas ............................................................ 31
         6.1      Identification of Commercial Locations to Evaluate ....................................................... 31

         6.2      Evaluation of Commercial Areas ...................................................................................... 35

                  6.2.1          Main Street (Kingsway to 33rd Avenue) .............................................................. 35

                  6.2.2          South Granville (6th Avenue to 16th Avenue) ..................................................... 36

                  6.2.3          West 4th Avenue (Fir to Balsam) ......................................................................... 38

                  6.2.4          West Broadway (Larch to Waterloo) .................................................................... 39

                  6.2.5          Kerrisdale ............................................................................................................. 40

                  6.2.6          West Point Grey ................................................................................................... 42

                  6.2.7          Robson/Alberni/Granville ..................................................................................... 43

                  6.2.8          Hamilton/Mainland/Homer ................................................................................... 44

                  6.2.9          Summary.............................................................................................................. 45

7.0      Conclusions ......................................................................................................... 47
8.0      Attachments ......................................................................................................... 49
         8.1      Oakridge Current and Expanded Tenant Mix 2011-2021 ................................................ 50

         8.2      Inventory of Retail and Service Floorspace..................................................................... 53

                  8.2.1          Total Floorspace .................................................................................................. 53

                  8.2.2          Floorspace by Local Commercial Area and Type of Business ............................ 54

         8.3      Regional Trade Area Definition and Population Projection ........................................... 59

                  8.3.1          Regional Trade Area ............................................................................................ 59

                  8.3.2          Population Projection ........................................................................................... 60

         8.4      Neighbourhood Trade Area ............................................................................................... 62

                  8.4.1          Local Trade Area Definition ................................................................................. 62

                  8.4.2          Local Trade Area Population Projection .............................................................. 62

         8.5      Retail Spending - Destination/Regional Categories ....................................................... 63

                  8.5.1          Retail Spending per Capita .................................................................................. 63

                  8.5.2          Total Spending by Trade Area Residents ............................................................ 63

                  8.5.3          Inflow Spending ................................................................................................... 64

CORIOLIS CONSULTING CORP.                                                                                                                         PAGE II

DRAFT
OAKRIDGE CENTRE RETAIL IMPACT ASSESSMENT
8.6 Supermarket and Pharmacy Spending per Capita .......................................................... 66
8.7 Estimated Sales Per Square Foot by Location ................................................................ 67
8.7.1 Oakridge Centre Existing Sales Analysis ............................................................ 67
8.7.2 Oakridge Centre Projected After Expansion ........................................................ 69
8.7.3 Street Front Commercial Areas ........................................................................... 71
CORIOLIS CONSULTING CORP. PAGE III
DRAFTOAKRIDGE CENTRE RETAIL IMPACT ASSESSMENT Summary To be included in final version of report. CORIOLIS CONSULTING CORP. PAGE 1 DRAFT
OAKRIDGE CENTRE RETAIL IMPACT ASSESSMENT

1.0          Introduction

1.1          Background
Oakridge Centre is a major regional shopping centre located at the southwest corner of West 41st Avenue
and Cambie Street in the City of Vancouver. The Centre currently has about 560,000 square feet of retail
space and is anchored by The Bay and Safeway (with the former Zeller's store being converted to Target).
The current zoning on the site allows a maximum of 740,000 square feet of retail, service, and
entertainment space.

In 2007, City Council approved the Oakridge Centre Policy Statement, which presented a vision of
Oakridge Centre to become a higher density, vibrant, sustainable hub with additional housing, retail, service
and office uses, including a major expansion of the retail and service component up to a maximum of
950,000 square feet.

The owners of Oakridge Centre are working on a concept plan for a major expansion of the Centre, and in
2012 submitted a rezoning application to expand the shopping centre to about 1,200,000 square feet,
significantly more than envisioned in the 2007 Policy Statement.

Oakridge Centre's central location in Vancouver and the scale of the proposed expansion raise the
possibility of impact on existing stores and other commercial precincts or shopping centres in Vancouver
so, as an input to evaluating the rezoning application, the City required the owners to fund an independent
assessment of the potential impacts.

The City commissioned a team of Coriolis Consulting Corp. and Site Economics Ltd., two firms with
extensive knowledge of the Vancouver retail market and considerable experience in retail impact analysis,
to collaborate in conducting a rigorous and comprehensive assessment of potential impacts.

This report documents the analysis and findings.

1.2          Objectives
Any expansion of the retail and service floor space inventory in the City will of necessity have some impact
on some existing businesses in the City or elsewhere in the region because sales achieved at the new
space would otherwise occur in some other existing location. The new space causes a redistribution of
trade area sales. However there is a wide variety of potential kinds of distributional impacts, in terms of
where the impact occurs and the severity of the consequences from the perspective of the City of
Vancouver. Potential impacts can be categorized as follows:

1. New retail space (and businesses) could capture sales from Vancouver residents that would otherwise
   have leaked to large scale regional commercial locations outside the City (e.g., Burnaby, Richmond,
   North Shore).
2. New space could import sales from residents of trade areas outside Vancouver.
3. New space occupied by chain stores could shift sales from existing outlets of the same chain.
4. Some redistribution could be from existing businesses that are performing at relatively high sales
   volumes, due to an insufficient supply of existing commercial space, so they would not necessarily
   become non-viable as a result of the redistribution.

CORIOLIS CONSULTING CORP.                                                                             PAGE 2

DRAFT
OAKRIDGE CENTRE RETAIL IMPACT ASSESSMENT

5. Some redistribution of sales could be from retailers already located in Oakridge Centre.
6. Some redistribution of sales could be from existing businesses whose sales performance is just at the
   margin of viability and they cannot absorb any reduction. They could become non-viable as a result.
   Depending on the size and type of such retailers, and their role in a commercial precinct, there could
   be impacts on the precinct, ranging from minor (e.g. temporary vacancy and replacement with a new
   business) to major (e.g. protracted vacancy or loss of an anchor).

It is this last possible consequence that is the main concern of the City in evaluating the proposed Oakridge
expansion. The City wants to know if there is a risk that the proposed increase in retail space could cause
a significant decline in the vitality of any existing commercial areas in Vancouver.

Therefore, the focus of this analysis is to identify impacts that could lead to a material and long-term decline
in the viability of any existing shopping areas in the City, including wide-spread and persistent vacancy.

The analysis does not evaluate the potential negative impact on commercial areas outside the City of
Vancouver resulting from sales importation or repatriation of sales currently leaking out to adjacent trade
areas. The analysis does not address potential impacts on individual stores, unless such an impact has the
potential to undermine the viability of a commercial district.

In defining the scope of the analysis, three important characteristics of the Vancouver retail landscape must
be taken into account:

1. Oakridge is primarily a regional shopping centre, so the analysis must consider the potential impact on
   Downtown, which is the City’s other regional shopping area.
2. Oakridge also functions as a community shopping centre for the Oakridge-Langara neighbourhood, so
   the analysis must consider potential impacts on surrounding community shopping precincts that may be
   drawing some trade from the Oakridge-Langara area.
3. Many of Vancouver’s commercial precincts are more than simply community-scale convenience retail
   and service centres. Some also include concentrations in fashion, home furnishings, or other categories
   that may be affected by expansion of Oakridge’s complement of chain stores in these categories.

Therefore the study as three main objectives:

1. Evaluate the potential impacts of the proposed Oakridge expansion on Downtown Vancouver, including
   Pacific Centre Mall and retail destinations such as Robson Street.
2. Evaluate the potential impacts on community scale commercial areas whose local trade areas overlap
   with Oakridge.
3. Evaluate the potential impacts on commercial precincts with concentrations of stores in categories that
   are being materially expanded at Oakridge.

1.3          Time Frame for the Analysis
This analysis examines the retail and service situation in Vancouver and at Oakridge Centre at two different
points in time:

1. The existing situation at 2012.
2. The year the proposed expansion is anticipated to be completed (2021).

We assume that upon completion in 2021 the expanded Oakridge Centre is occupied (except for an
industry standard vacancy allowance) and is achieving its target stabilized rate of sales (i.e., we do not build

CORIOLIS CONSULTING CORP.                                                                                PAGE 3

DRAFT
OAKRIDGE CENTRE RETAIL IMPACT ASSESSMENT

in a period in which occupancy and sales ramp up after construction is complete). This is conservative
because sales may be lower at the expanded Centre than assumed in this analysis for a ramp up period
before actual performance reaches stabilized occupancy and sales.

In addition, the analysis is based on current dollars ($2012) and includes with minimal inflation in retail
sales per capita over time (zero to 0.25% per year, depending on the category) even though the long term
trend has been for increasing sales per capita (in real terms). This ensures that the analysis is conservative
as an assumption of high inflation can create the (unwarranted) appearance of increased retail demand.

1.4          Report Format
This impact assessment required a large amount of data and analysis, including:

1.   Population forecasts for the regional trade area, the City and the Oakridge neighbourhood trade area.
2.   Retail and service floorspace inventory for the City, by neighbourhood and type of space.
3.   Retail expenditure data per capita.
4.   Estimates and projections of sales per square foot (productivity) at Oakridge Centre and other locations
     by type of space.

To enhance the readability of this report, we have organized it as follows:

1. The main body of the report concentrates on explaining our approach, summarizing the analysis, and
   highlighting our conclusions.
2. Technical information, data, and background materials that support the analysis (e.g., population
   projections, sales per capita estimates, sales per square foot assumptions, and the supply of existing
   retail and service space) are contained in the attachments.

The research and analysis for this impact assessment was completed during the second half of 2012.
Therefore, the report relies primarily on data available as at mid 2012.

1.5          Professional Disclaimer
This document may contain estimates and forecasts of future growth and urban development prospects,
estimates of the financial performance of possible future urban development projects, opinions regarding
the likelihood of approval of development projects, and recommendations regarding development strategy
or municipal policy. All such estimates, forecasts, opinions, and recommendations are based in part on
forecasts and assumptions regarding population change, economic growth, policy, market conditions,
development costs and other variables. The assumptions, estimates, forecasts, opinions, and
recommendations are based on interpreting past trends, gauging current conditions, and making judgments
about the future. As with all judgments concerning future trends and events, however, there is uncertainty
and risk that conditions change or unanticipated circumstances occur such that actual events turn out
differently than as anticipated in this document, which is intended to be used as a reasonable indicator of
potential outcomes rather than as a precise prediction of future events.

Nothing contained in this report, express or implied, shall confer rights or remedies upon, or create any
contractual relationship with, or cause of action in favor of, any third party relying upon this document.

CORIOLIS CONSULTING CORP.                                                                              PAGE 4

DRAFT
OAKRIDGE CENTRE RETAIL IMPACT ASSESSMENT In no event shall Coriolis Consulting Corp. or Site Economics Ltd. be liable to the City of Vancouver or any third party for any indirect, incidental, special, or consequential damages whatsoever, including lost revenues or profits. CORIOLIS CONSULTING CORP. PAGE 5 DRAFT
OAKRIDGE CENTRE RETAIL IMPACT ASSESSMENT

2.0          The Proposed Expansion of Oakridge Centre in the
             Context of Existing Commercial Development in
             Vancouver
Oakridge Centre is a large and successful commercial project that is primarily a regional shopping centre
anchored by department stores. However, it also has elements of a neighbourhood commercial area. In
order to analyze the impacts of the proposed expansion, it is necessary to understand how Oakridge fits
into the existing pattern of commercial development in the City, now and after the proposed expansion.

2.1          Composition of Oakridge Centre by Store Category Before and
             After Expansion
Exhibit 1 shows (based on information provided by Ivanhoe Cambridge) the amount of retail, service and
entertainment space (gross leasable area) at Oakridge as at 2012, the proposed additions by category, and
the new total amount upon completion of all phases (in 2021). Additional detail is provided in Attachment
8.1.

Exhibit 1: Oakridge Centre Floorspace by Category - Existing and Proposed
                                     Existing                     Proposed        Expanded Centre
                                 Square Feet        % of           Addition           Square Feet        % of
 Retail Category                         2012      Total       Square Feet                   2021       Total
 Department Store                     262,000       47%             204,500               466,500        39%
 Clothing & Footwear                  115,000       21%             104,500               219,500        18%
 Jewelry                               15,000        3%              20,000                35,000         3%
 Supermarket                           50,000        9%               4,500                54,500         5%
 Cinema                                     0        0%              36,500                36,500         3%
 Restaurant & Fast Food                10,000        2%              42,500                52,500         4%
 Home Furnishings                      28,000        5%              33,500                61,500         5%
 Electronics                           13,000        2%              20,000                33,000         3%
 Financial Services                    19,000        3%              18,000                37,000         3%
 Pharmacy & Personal Care              12,000        2%              19,500                31,500         3%
 Specialty Retail                      11,000        2%              16,500                27,500         2%
 Personal Services                      9,000        2%              15,500                24,500         2%
 Specialty Food                        12,000        2%              10,500                22,500         2%
 Vacant                                 2,000        0%              10,500                12,500         1%
 Liquor                                     0        0%              13,000                13,000         1%
 Fitness & Recreation                       0        0%              39,500                39,500         3%
 Auto Showrooms                             0        0%              15,500                15,500         1%
 Entertainment                              0        0%              16,000                16,000         1%
 Total                                558,000      100%             640,500             1,198,500       100%
Source: Ivanhoe Cambridge

The total proposed expansion includes about 640,500 square feet of retail, service and entertainment
space, bringing the total to just under 1.2 million square feet. It is notable that under existing policy the
Centre could expand to 950,000 square feet, so the proposal is for an additional 250,000 square feet
beyond the approved policy.

CORIOLIS CONSULTING CORP.                                                                             PAGE 6

DRAFT
OAKRIDGE CENTRE RETAIL IMPACT ASSESSMENT A large component of the expansion is in the department store category, which accounts for 32% of the increase. Clothing and footwear account for another 16% of the expansion. Several categories will be expanded by less than 20,000 square feet, which can be considered quite small in the context of Vancouver’s retail landscape, which contains a total of over 20 million square feet of space. 2.2 Existing Retail and Service Floorspace in Vancouver A comprehensive and detailed database of existing retail and service floorspace in Vancouver is not available. For this study, we compiled an estimate of the City's overall retail and service inventory by drawing on several information sources: 1. BC Assessment floorspace information for all commercial properties in Vancouver as of 2007. 2. An inventory of floorspace compiled by the City in 2005 for each of the local commercial areas in the City plus Downtown. 3. Our own fieldwork in selected areas of interest to identify significant changes in the inventory since 2005. 4. Information provided by the City on new retail and service projects completed since 2005. 5. Our own estimates/allowances for locations not covered by the City's inventory or our fieldwork. Our inventory is included in Attachment 8.2. The attachment is divided into two parts: 1. An overall estimate of the total amount of retail and service space in the entire City. 2. For the City's existing street front commercial areas (over 60 areas), a more detailed inventory of the total amount of retail and service space in each location and the amount of space by retail category. Based on available data and our own estimates, there is a maximum of about 20.1 million square feet of retail and service floorspace in the City of Vancouver. The approximate distribution of the total retail and service space is shown in Exhibit 2. CORIOLIS CONSULTING CORP. PAGE 7 DRAFT
OAKRIDGE CENTRE RETAIL IMPACT ASSESSMENT
Exhibit 2: City of Vancouver Retail and Service Floorspace Inventory
Location Square Feet
Downtown1 8,900,000
Oakridge Centre 600,000
Highway Oriented Commercial Areas2 1,400,000
Local Commercial Areas3 9,200,000
Vancouver Total 20,100,000
Source: Coriolis Consulting Corp.
Local commercial areas account for almost half of the City's existing retail and service floorspace inventory.
Oakridge Centre includes about 600,000 square feet of existing retail and service floorspace, or about 3%
of the City's existing inventory of retail and service floorspace.
2.3 Proposed Expansion Compared to Current Zoning and Policy
Statement
The current CD-1 zoning bylaw for Oakridge Centre allows a maximum of about 740,000 square feet of
retail, service and entertainment space (which is larger than the existing centre).
In 2007, City Council approved the Oakridge Centre Policy Statement, which presented a vision of
Oakridge Centre to become a vibrant, sustainable hub with more housing, retail, service and office uses,
including an expansion of the retail and service component to 950,000 square feet.
The current proposal would result in an expansion of the existing shopping centre to include about
1,200,000 square feet (GLA) of retail, service and entertainment space, or about 640,000 square feet
beyond the existing amount of space and 250,000 square feet beyond the amount envisioned in the
4
approved Policy Statement .
1
This figure is based on a combination of:
Detailed property by property 2005 floorspace information for parts of Downtown provided by
the City of Vancouver plus updates from Coriolis Consulting Corp.
2007 BC Assessment floorspace information for the parts of Downtown excluded from the City
of Vancouver data.
Estimates for Pacific Centre provided by the owner of the mall.
2
This figure is based on fieldworks, air photos and estimates by Coriolis Consulting Corp.
3
This figure is based on detailed property by property 2005 floorspace information provided by the
City of Vancouver plus updates from Coriolis Consulting Corp. to add in new buildings.
4
The rezoning floorspace shown above is gross leasable area. It is not clear whether the Policy
Statement and Zoning floorspace is gross leasable area or another measure (such as gross floor
area). Therefore, these comparisons may not be precisely accurate.
CORIOLIS CONSULTING CORP. PAGE 8
DRAFTOAKRIDGE CENTRE RETAIL IMPACT ASSESSMENT
3.0 Approach to the Impact Analysis
3.1 Retail Categories Included in Impact Assessment
Oakridge is near the geographic centre of the City of Vancouver and is able to draw customers from
throughout the City as well as from nearby municipalities (primarily Richmond, Burnaby, and the North
Shore). Consequently, Oakridge competes with the large regional malls such as Pacific Centre (Downtown
5
Vancouver), Metropolis (Burnaby), Lansdowne (Richmond) and Richmond Centre (Richmond) . Clearly the
analysis must include the retail categories that are the core of Downtown’s strength as a retail destination,
including department stores and fashion.
Oakridge also competes with some local commercial areas, including those that have overlapping trade
areas for local convenience commercial sales and those that have concentrations in categories of
comparison shopping (e.g. fashion or home furnishings) that make up a large part of the regional shopping
centre floorspace.
But some of the proposed Oakridge expansion is in categories that by definition can have no impact on
existing commercial areas either because the Oakridge increase is very small (e.g. the un-allocated
increase of 16,500 square feet of specialty retail) or because the nature of the business is not at all
competitive with the commercial precincts of interest (e.g. the 15,500 square feet of auto showroom space).
Therefore, to select the retail categories for inclusion in the impact analysis, we proceeded as follows:
1. We inventoried the types of retail and services businesses that are currently located in Downtown and
in the approximately 60 local commercial areas in the City. Note that these areas do not include auto-
oriented service commercial strips with uses such as auto-sales, auto service and repair, fast food
restaurants, or building supplies.
2. We identified the retail categories that could reasonably be considered to be vital to the health of each
commercial area.
3. We compared our inventory with the proposed expansion of Oakridge in order to identify retail
categories that meet two conditions: they play a key role in the ongoing viability of existing commercial
areas and they account for a significant amount of new floor area as proposed for Oakridge’s
expansion.
Using this approach, we selected the following categories for inclusion in the impact analysis:
1. Department stores. Department stores are important anchors in Downtown and account for 32% of the
Oakridge expansion.
2. Fashion categories (clothing, footwear). These are vital to some Downtown shopping districts, they
make up a large share of space in some of the City’s on-street shopping precincts (e.g. South Granville,
th
Main, West 4 ), and account for 16% of the proposed Oakridge expansion.
3. Home furnishings. These account for a large amount of space in some shopping districts (e.g.
Yaletown, South Granville) and account for 5% of the proposed Oakridge expansion.
5
Park Royal and other more distant malls are minor competitors with Oakridge due to physical
distance and the fact that they are separated from Oakridge by the largest retail concentration in
BC (Downtown and Pacific Centre).
CORIOLIS CONSULTING CORP. PAGE 9
DRAFTOAKRIDGE CENTRE RETAIL IMPACT ASSESSMENT
4. Jewelry. This category accounts for a large amount of space in Downtown and about 3% of the
Oakridge expansion.
5. Supermarkets. Supermarkets are vital to the ongoing health of many local commercial areas. Even
though the Oakridge expansion only includes 4,500 square feet of additional supermarket space, we
elected to include this category to identify any risk of impact on a neighbourhood shopping centre’s
anchor.
6. Pharmacy. Pharmacies can also act as important anchors in a local commercial area and Oakridge is
proposing to increase this category to almost three times its current size in the centre.
Obviously this selection of categories for impact analysis leaves out some categories included in the
expansion of Oakridge:
1. Cinema. There are a few local commercial areas that include a movie theatre (e.g. Cambie Village,
Dunbar). However, the proposed new space at Oakridge is replacing a former multi-screen cinema that
operated at Oakridge for many years before being replaced (by Crate and Barrel) in the most recent
renovation. The local screens operated throughout that time, so it seems unlikely that they would be
affected by the return of this space. As well, after careful consideration of the situation facing the local
screens, it is our view that they are at more risk from redevelopment of their sites (as happened with the
th
Varsity on West 10 Avenue) than from competition at Oakridge.
2. Restaurant and fast food. This category is a huge use of floor space in the City and the number of
existing restaurants and cafes in the City is well over a thousand. The increase at Oakridge represents
such a small addition to the total inventory of restaurant and fast food space in the City that it cannot
possibly have a significant impact on any single area. This is not to say that individual restaurants won’t
see some change in sales, but the impacts cannot cause a significant and persistent impact on any
commercial area.
3. Electronics. Consumer electronics are primarily sold in a few very large outlets in the City (e.g. Best
Buy, Future Shop, and to a lesser extent London Drugs). The small Oakridge increase (20,000 square
feet) is not large enough, and electronics as a category is not prevalent enough, for this to warrant
analysis.
4. Financial services. Branch banking is exclusively a “chain” outlet and all the major institutions have
outlets in most of the commercial areas, for reasons of convenient customer access. The location of
additional (or larger) outlets at Oakridge is not likely to lead to the closure of any outlets in local areas.
5. Specialty Retail. Ivanhoe Cambridge has not yet determined the actual mix of tenants in this category
which can include a wide array of retailers, such as toys, hobbies, musical instruments, arts, crafts, gifts
and cards, stationary, luggage and other types of businesses. The proposed increase of 16,500 square
feet of specialty retail is too small to have an impact on existing businesses in the City.
6. Personal services. The proposed increase of 15,500 square feet of personal services (across a wide
number of categories) is too small to have an impact on existing businesses in the City.
7. Specialty food. Ivanhoe Cambridge has not yet determined the actual mix of tenants in this category
which can include a wide array of retailers such as coffee and tea, deli, produce, seafood, nuts,
chocolates, and other types of businesses. The proposed increase of 10,500 square feet of specialty
food is too small to have an impact on existing businesses in the City.
8. Liquor. The proposed increase of 13,000 square feet of liquor store space is too small to have an
impact on existing businesses in the City.
9. Fitness and recreation. Privately operated fitness facilities do no act as a key anchor business in the
City's existing local commercial areas.
CORIOLIS CONSULTING CORP. PAGE 10
DRAFTOAKRIDGE CENTRE RETAIL IMPACT ASSESSMENT
10. Auto showroom. This is not a key anchor business in the City's existing local commercial areas.
11. Entertainment. Ivanhoe Cambridge has not yet determined the actual mix of tenants in this category
which can include a range of businesses such as video games, bowling and other forms of recreation.
The proposed increase of 16,000 square feet is too small to have an impact on existing entertainment
businesses, and this use is not key business in the City's existing local commercial areas.
We reviewed our proposed categories for inclusion in the analysis with the City of Vancouver staff before
we proceeded. The City agreed with the categories that we included and accepted our rationale for the
categories not included.
3.2 Impact Assessment Methodology
There are several factors which can make retail impact analysis challenging:
1. Regional shopping centres primarily compete with other regional shopping centres. However, Oakridge
also functions as a community shopping node, so the analysis cannot be confined to the impact on
regional centres. As well, several Vancouver shopping areas have become concentrated destinations
(in clothing for example) that will compete with Oakridge to some extent. Therefore, it is not possible to
divide the analysis into regional and local components, because there is overlap.
2. Department stores tend to primarily compete with other department stores. One might think that there
would be head-to-head competition between department stores and chain retailers in overlapping
merchandise categories (e.g. clothing or housewares) but in fact the two kinds of stores tend to act as
“silos” in terms of capturing sales. However, the entry in the market place of new department store
chains, particularly if they are heavily oriented to fashion, is likely to raise concerns on the part of
existing retailers (perhaps especially independents) so in our view we should not structure the analysis
to assume that departments stores and specialty stores do not compete.
3. While sales data is (or can be) available from shopping centre owners, sales data is not generally
available for independent retailers or most chains in on-street locations. In order to analyze the
distribution of sales, and impacts caused by new market entrants, it is necessary to estimate sales
volumes based on other indicators which necessarily involve approximation and uncertainty.
Because of these factors, we elected to approach the impact analysis using several different approaches,
each of which offers a perspective on the impact of a significant addition to the inventory of space and the
number of businesses. We applied each approach individually and then we integrate the results to obtain
the most comprehensive view possible regarding potential impacts.
The approaches we use are as follows:
1. We examined the total retail and service inventory in City before and after the Oakridge expansion,
compared to the City’s population to determine if the City-wide market is at equilibrium, under-supplied,
or over-supplied with retail and service space relative to the rest of the Metro region.
2. We estimated total trade area retail sales potential and estimated the distribution of these sales among
stores in different locations in the City, before and after the Oakridge expansion, for each of the
following retail categories:
Department stores.
Clothing, footwear and related stores (apparel).
CORIOLIS CONSULTING CORP. PAGE 11
DRAFTOAKRIDGE CENTRE RETAIL IMPACT ASSESSMENT
Jewelry stores.
Home furnishings stores.
For this analysis, we assumed that department stores compete with other department stores and that
specialty retailers compete with other specialty retailers.
3. We repeated the analysis in step 2, but incorporated the assumption that department stores might
compete with specialty retailers for shares of the fashion, jewelry, and home furnishings market. In a
sense, this is the worst case from the perspective of independent on-street retailers, as it assumes that
they must compete with new and existing chain retailers in the mall as well as new and existing
department stores in the mall. We examined the potential impact of the proposed expansion at
Oakridge Centre on the surrounding local commercial areas for the key neighbourhood oriented retail
anchors: supermarkets and pharmacies.
4. Using the output of steps 1, 2, and 3, we reached conclusions about the potential impact on the other
regional shopping locations in Vancouver (such as Pacific Centre Mall and existing department stores).
5. Using the output of steps 1, 2, and 3, we then examined each of the street front commercial areas in
the City with the intent of flagging any possible cause for concern about significant, persistent impact for
any category of store. We divided the districts into 58 with no apparent concerns and eight that
warranted a closer (and more qualitative) assessment.
6. We examined the selected areas more closely and reached conclusions about potential impact.
7. We summarized our overall analysis.
CORIOLIS CONSULTING CORP. PAGE 12
DRAFTOAKRIDGE CENTRE RETAIL IMPACT ASSESSMENT
4.0 Trade Areas for Impact Assessment
Because we use several different approaches to the impact analysis, we use three different trade areas:
1. For the assessment of the size of the City’s total retail inventory (relative to its population), the trade
area is the City of Vancouver. We are trying to ascertain if the City in total has too much retail (i.e. the
Oakridge expansion makes a highly competitive overall market worse), not enough retail (i.e. it is likely
that the City is exporting retail sales to adjacent municipalities), or the right amount, when compared to
the rest of the urban region.
2. For the retail sales distribution analysis for selected categories (department store, clothing, shoes,
jewelry, home furnishings), the trade area is determined based on the trade areas for Oakridge and
Pacific Centre. These trades areas extend beyond the City of Vancouver to include parts of Richmond,
Burnaby, and the North shore. Inside this larger trade area, we are analyzing the distribution of sales
among Oakridge, Pacific Centre and on-street retail locations.
3. For the neighbourhood oriented retail categories (supermarket and pharmacy), the trade area is based
rd
on the pattern of these anchor stores in the south-central part of the City (generally bounded by 33
Avenue, MacDonald Street, Knight Street, and the Fraser River).
The following sections provide more detail on the definition of (and rationale for) these trade areas.
Population trends and projections for each area are included in Attachment 8.3 and 8.4.
4.1 Assessment of Impact on City-Wide Inventory
The City of Vancouver is the geographic trade area for our evaluation of the impact of the proposed
Oakridge Centre expansion on the overall inventory of retail and service floor space in the City. This not a
trade area in the true sense, because we are not saying that floor space in the City captures all of (and
only) sales from inside the City boundary. We are evaluating whether the City as a jurisdiction (rather than a
trade area) contains more or less the amount of space that is warranted by the spending power of City
residents.
4.2 Impact on Regional-Oriented Categories
The primary competition for Oakridge Centre is from other comparable regional shopping centres. Within a
given region, these centres often have similar (or even the same) tenants located in a similar enclosed
building. In a typical situation, regional malls are the only important competition for other regional malls
because they are anchored by department stores, have similar tenant/merchandizing mix, offer a
destination shopping experience, and are highly accessible to large geographic areas.
We examined customer origin data for major regional malls in Vancouver and the surrounding
municipalities to help determine the trade area that should be used to examine the impact of the proposed
expansion at Oakridge on the regional/destination retail categories in the City. The analysis is included in
Attachment 8.3.
The key implications of the consumer research that we examined are as follows:
CORIOLIS CONSULTING CORP. PAGE 13
DRAFTOAKRIDGE CENTRE RETAIL IMPACT ASSESSMENT 1. Oakridge Centre's primary trade area as a regional shopping centre is City of Vancouver and the UBC/UEL district. Burnaby and Richmond are secondary trade areas. Oakridge draws limited sales from residents of other parts of the Lower Mainland. 2. Pacific Centre draws about half of its customers from Vancouver plus UBC/UEL . The remainder is drawn from residents of a wide variety of locations in the Lower Mainland, partly because of the Central Business District’s regional employment draw and partly because the regional rapid transit system is radially focused on Downtown. 3. Residents of the City of Vancouver account for a significant share of the customers at the major regional centres in Richmond, Burnaby and the North Shore, indicating that Vancouver is exporting sales (probably mainly from neighbourhoods in the south and east parts of the City) to retail areas in other municipalities. Because Vancouver and UBC/UEL residents account for 70% of customers at Oakridge Centre and about 50% of all customers at Pacific Centre, the primary trade area for our impact assessment for department stores and the selected specialty retail categories is the City of Vancouver and the UEL. There will continue to be inflow from surrounding municipalities (and some outflow to them as well) but the majority of all sales at the selected specialty retail categories and department stores in Vancouver will be generated by residents of Vancouver and the UBC/UEL area 4.3 Neighbourhood Oriented Retail and Service Analysis Oakridge has a significant amount of neighbourhood-oriented convenience retail and services and some of these categories are proposed for expansion, including the supermarket and pharmacy categories. Therefore, the impact assessment must look at the potential impact of the proposed neighbourhood oriented retail expansion on surrounding local commercial areas. To identify the appropriate trade area for the neighbourhood oriented retail and service analysis, we examined the existing (and planned) pattern of supermarkets and pharmacies in the neighbourhoods surrounding Oakridge. We also considered the existing road network. Based on our evaluation, we defined a trade area that includes all of the supermarkets and pharmacies in the neighbourhoods surrounding Oakridge, including Marpole, Kerrisdale and parts of South Cambie, Riley Park, Shaughnessy, and Sunset. The study area for the neighbourhood oriented assessment is bounded roughly by 33rd Avenue on the north, the Fraser River on the south, Knight Street on the east and MacDonald Street on the west. Exhibit 3 shows the boundaries of this neighbourhood trade area. CORIOLIS CONSULTING CORP. PAGE 14 DRAFT
OAKRIDGE CENTRE RETAIL IMPACT ASSESSMENT

Exhibit 3: Neighbourhood Trade Area

CORIOLIS CONSULTING CORP.                  PAGE 15

DRAFT
OAKRIDGE CENTRE RETAIL IMPACT ASSESSMENT

5.0          Impact Assessment

5.1          Analysis of Overall Vancouver Retail and Service Inventory
The first approach we use is to evaluate City of Vancouver retail inventory compared to its population.

We estimate that there is a maximum of about 20.1 million square feet of existing retail and service space in
the City of Vancouver as at 2011 According to Stats Canada (Census), the City's 2011 population was
about 606,000 so there is currently about 33 square feet of retail and service space per capita in the entire
City.

Based on available data, there is about 40 to 45 square feet of retail and service space per capita in the
entire Metro Vancouver region (including Vancouver). Therefore, the City of Vancouver currently has about
20% to 25% less retail and service space per capita than the regional average. One would expect the
opposite (a higher ratio in Vancouver than in the region) for several reasons:

1. Parts of Vancouver have very high average income compared to the regional average.
2. Vancouver is a large regional employment centre that draws workers from a large area. These workers
   spend some of their disposable income near their place of work rather than their place of residence.
3. Vancouver has specialty retail and service businesses that have regional drawing power.
4. Vancouver is the main tourist destination in the region, so it captures a very large share of total tourist
   retail sales.

Vancouver’s comparatively low ratio is a strong indicator that the City is under-supplied with retail and
service floor space relative to the rest of Metro.

If the proposed expansion of Oakridge proceeds, it will add about 640,500 square of additional retail and
                                                                                                6
service space to the inventory by 2021. In addition, we identified about 500,000 square feet of new retail
and service space that is planned at other commercial projects in the City. Assuming all of this space is
built, the City's total retail and service inventory would increase to about 21.3 million square feet by 2021.
Our projected City of Vancouver 2021 population is 686,000. Therefore, the projected 2021 retail and
service floorspace per capita in the City is about 31 square feet per capita, which is less than the current
ratio.

These floorspace per capita figures indicate that:

1. The City of Vancouver has 20% to 25% less retail space per capita than the Metro Vancouver average,
   a strong indicator that the total inventory of retail space in the City is too small.

2. Proposed additions to retail inventory (including Oakridge expansion) will not keep pace with growth in
   demand based on forecast population growth. In other words, the retail under-supply will increase.

6
         Most of this space (about 250,000 square feet) is at the Marine Gateway project. The remainder is
         comprised of small amounts of space at a variety of mixed use projects. This figure excludes the
         proposed 94,000 square feet of retail and service space at Arbutus Village as this space will be
         replacing existing retail space at the site so it is not net new space.

CORIOLIS CONSULTING CORP.                                                                             PAGE 16

DRAFT
OAKRIDGE CENTRE RETAIL IMPACT ASSESSMENT This under-supply situation means that the City of Vancouver is exporting a significant share of its retail spending to other municipalities, or Vancouver retail businesses are achieving (on average) higher retail sales per square foot than retail businesses in other parts of the region. 5.2 Destination/Regional-Oriented Retail and Service Analysis This section summarizes our analysis of trade area retail spending and the potential impacts of the proposed Oakridge expansion for each of the following four retail categories: 1. Department stores. 2. Clothing, footwear and related stores. 3. Jewelry stores. 4. Home furnishings stores. As noted earlier, we approach this analysis in two different ways: 1. First we look at the four categories individually, on the premise that department stores do not tend to compete head-to-head with specialty retailers. Each format has its own market niche. 2. Second, we combine the categories on the premise that there could be competition between department stores and the other categories. For each category, we present the analysis for 2011 (the latest year for which a full year of retail sales data was available). We analyzed retail demand (spending) and supply (floorspace) by category to identify potential impacts. For each category, we use these steps: 1. We estimate total spending by primary trade area residents (Vancouver and the UEL). 2. We estimated total inflow spending to the City from residents who live outside the primary trade area. 3. We calculate total potential retail sales in stores in the primary trade area (1 + 2). 4. We allocate the sales to different locations using available indicators of market share. The areas we use in this step are Oakridge, Pacific Centre, Other Downtown, and the local commercial areas, at 2011 and 2021. 5. We calculate the implied outflow spending (spending by primary trade area residents that is not being captured by Vancouver stores and so is assumed to be leaking out to adjacent trade areas, mainly Burnaby and Richmond). The analysis includes some conservative assumptions, as our intent is to calculate the “worst case” from the perspective of possible impact on local commercial areas. Accordingly, it is likely that our analysis overstates any impact on stores in the selected categories. 1. We have included a minimal allowance for real growth in retail spending per capita (a maximum of 0.25% per year) for these categories over the next decade. The long term historic trend has been an increase in real spending per capita (net of inflation), so we are possibly understating total retail sales potential in the trade area. CORIOLIS CONSULTING CORP. PAGE 17 DRAFT
OAKRIDGE CENTRE RETAIL IMPACT ASSESSMENT

2. We assume that the achieved value of retail sales per square foot in the existing portion of Oakridge
   are not negatively affected by the expansion (except for the existing jewelry stores at Oakridge which
   are currently achieving extremely high sales per square foot). This means we are assuming that all
   “new” sales at Oakridge are extracted from the rest of the City's retail inventory, not cannibalized from
   other existing Oakridge stores. In reality, we would expect some of the sales in the new Oakridge
   expansion to be captured from retailers in the existing mall.

3. We assume no inflow spending (from residents outside of Vancouver and the UEL) to businesses in the
   local commercial areas. Inflow is only included in the calculations for the main regional-oriented
   shopping locations in the City (including Oakridge, Pacific Centre, Robson/Alberni/Granville, and
   department stores), which is based on detailed third party consumer research. This means we are
   assuming that local commercial areas must depend entirely on competing for a share of Vancouver
   sales potential and they cannot rely on drawing sales in from other municipalities. In reality, we know
   that some of the City’s local areas that have become destinations in their own right (e.g. South
   Granville, West 4th Avenue, Commercial Drive, Main Street) and will derive some of their potential from
   customers travelling in from other regional communities.

Because of these conservative assumptions, it is possible our analysis overstates any potential impact of
the proposed Oakridge Centre expansion on these regional retail categories. We have used this
conservative approach deliberately because we did not want to risk any perception that we masked a
potential sales impact by making beneficial assumptions about real growth in spending, or assuming that
the new stores at Oakridge simply depress sales in the rest of the centre, or that local commercial areas are
on equal footing with regional malls in terms of regional customer drawing power.

5.2.1        Department Store
There is currently about 1.9 million square feet of department store space in the City. Exhibit 4 shows the
estimated department store spending in Vancouver in 2011 by location. The figures in Exhibit 4 are derived
as follows:

1. The Oakridge total sales are based on actual department stores sales data provided by the shopping
   centre owner.
2. The Pacific Centre total sales are estimated based on discussions with industry representatives and
   inferred sales performance for the department stores at this mall. The weighted average assumes that
   Holt Renfrew achieves high sales, but Sears (which is many times larger) does not. Sears had closed
   three levels of the store for years before permanently closing in 2012.
3. The Downtown Bay, Wal-Mart, and Army & Navy sales are based on industry averages and interviews
   with industry representatives and are typical for these types of department stores.
4. Total department sales from trade area residents ($446 million) is estimated by multiplying the 2011
   trade area population (see Attachment 8.5) by the estimated Vancouver department store sales per
   capita (see Attachment 8.3).
5. Inflow is estimated based on consumer research data provided by the major regional malls (see
   Attachment 8.5).
6. Total department store sales in Vancouver ($649 million) is estimated by adding the estimated inflow to
   the sales generated from trade area residents.

CORIOLIS CONSULTING CORP.                                                                            PAGE 18

DRAFT
OAKRIDGE CENTRE RETAIL IMPACT ASSESSMENT

7. Total department store sales ($649 million) less actual estimated sales at the department stores
   indicates that about $117 million of department store sales is being exported from the City as retail
   outflow to other municipalities (mainly Richmond and Burnaby).

Exhibit 4: Department Store Spending Analysis - 2011
                                             Sales                   Sales from
                                Size in Sq    Per     Total Sales    Trade Area     Sales from        2011
                2011                Ft       sq.ft.      2011        Residents        Inflow       Distribution
 Oakridge Bay, Zellers            262,164     $225     $58,986,900    $41,290,830    $17,696,070        9%
 Pacific Centre Sears, Holt
 Renfrew                          783,000     $250    $195,750,000    $97,875,000    $97,875,000      22%
 Downtown Bay, Wal-Mart           772,000     $325    $250,900,000   $165,594,000    $85,306,000      37%
 Army & Navy                      114,000     $225     $25,650,000    $24,367,500     $1,282,500      5%
 Outflow                                              $117,481,737   $117,481,737                     26%
 Department Store Sales
 Vancouver                      1,931,164             $648,768,637   $446,609,067   $202,159,570

Exhibit 4 shows that a substantial amount of City-generated department store potential is currently being
exported to neighbouring municipalities.

The proposed Oakridge Centre expansion will add 204,000 square feet of additional department store
space. There will also be a conversion of the existing Zeller's space at Oakridge to Target, but no
additional change in the total size of this type of space within the Centre.

The amount of department store space at Pacific Centre in Downtown will decline by about 433,000 square
feet due to the closure of Sears and conversion of this space into a combination of new department store
space (Nordstrom's), office space, and additional CRU space. Therefore, the total City-wide department
store inventory will decline to about 1.7 million square feet by 2021.

Exhibit 5 shows the estimated 2021 department store spending in Vancouver by location. The figures in
Exhibit 5 are derived using the same approach and assumptions as in Exhibit 4, except for the following key
differences:

1. The inventory of department store space declines from 1.9 million to 1.7 million square feet.
2. The department store sales per square foot at Oakridge are assumed to increase due to the
   introduction of Target plus another new high quality department store. The new sales per square foot
   rates are based on industry averages for these types of stores and are substantially higher than the
   performance of existing department stores at Oakridge.
3. The department store sales per square foot at Pacific Centre sales are assumed to increase due to the
   introduction of Nordstrom's.
4. Total sales from trade area residents ($505 million) increases due to the projected growth in
   Vancouver's population by 2021 (see Attachment 8.3).
5. Total Vancouver department store sales less actual estimated sales at the department stores indicates
   that about $105 million of department store sales will still be exported from the City to other areas after
   completion of the Oakridge expansion in 2021 (mainly Richmond and Burnaby).

CORIOLIS CONSULTING CORP.                                                                               PAGE 19

DRAFT
OAKRIDGE CENTRE RETAIL IMPACT ASSESSMENT
Exhibit 5: Department Store Spending Analysis - 2021
Sales Sales from
Size in Sq Per Total Sales Trade Area Sales from 2021
2021 Ft sq.ft. 2021 Residents Inflow Distribution
Oakridge Bay, Target, Existing
Space 262,164 $300 $78,649,200 $55,054,440 $23,594,760 11%
Oakridge New Dept Store Space 204,836 $400 $81,934,400 $57,354,080 $24,580,320 11%
Subtotal 467,000 $344 $160,583,600 $112,408,520 $48,175,080 22%
Pacific Centre Nordstrom, Holt
Renfrew 350,000 $425 $148,750,000 $98,175,000 $50,575,000 19%
Downtown Bay, Wal-Mart 772,000 $325 $250,900,000 $165,594,000 $85,306,000 33%
Army & Navy 114,000 $225 $25,650,000 $24,367,500 $1,282,500 5%
Outflow $105,329,624 $105,329,624 21%
Department Store Sales Vancouver 1,703,000 $691,213,224 $505,874,644 $185,338,580
For the department store category, there is currently substantial retail outflow and this is expected to
continue after the proposed Oakridge expansion is completed in 2021 due to two factors:
1. The total inventory of department store space is expected to decline by 2021.
2. The trade area population (and retail demand) is expected to grow significantly.
The analysis of existing and planned stores clearly indicates that there will be no significant sales
transference or measurable impact on existing (or planned) department stores in Vancouver as a result of
the planned expansion of department store space at Oakridge Centre. There is ample sales to support all
of the department stores in 2021.
5.2.2 Apparel (Clothing and Shoes)
There is currently about 1.2 million square feet of clothing and shoe store space in the City.
Exhibit 6 shows the estimated clothing and shoe store spending in Vancouver in 2011 by location. Exhibit 6
shows the estimated apparel spending in Vancouver in 2011 by location. The figures in Exhibit 6 are
derived as follows:
1. The Oakridge total sales are based on actual apparel store sales data provided by the owner.
2. The Pacific Centre total sales are based on interviews with industry representatives and inferred from
reported sales data for stores in this mall.
3. The street retail sales per square foot figures (regional/downtown street retail and local commercial
street retail) is an estimate based on current rents in the various street front retail locations and the
industry standard ratio of sales to rents for retail businesses (see Attachment 8.7). This is a weighted
average estimate that takes into account the geographic distribution of the existing apparel space in the
City and the differing rents (and sales) across each location. In addition, interviews were conducted
with industry representatives to confirm our sales estimates.
4. Total apparel sales from trade area residents ($501 million) is estimated by multiplying the 2011 trade
area population (see Attachment 8.5) by the estimated Vancouver apparel store sales per capita (see
Attachment 8.3).
5. Inflow is estimated based on consumer research data (see Attachment 8.5) and is only applied to the
major malls (Oakridge and Pacific Centre) and to Robson Street, not to any other commercial areas
(this is a conservative assumption).
6. Total clothing and shoe store sales in Vancouver ($700 million) is estimated by adding the estimated
inflow at the regional shopping locations to the sales generated from trade area residents.
CORIOLIS CONSULTING CORP. PAGE 20
DRAFTYou can also read