East Village, Bentleigh East - Assessment of retail potential January 2018 - Retail Assessment (MacroPlan Dimasi)
←
→
Page content transcription
If your browser does not render page correctly, please read the page content below
East Village, Bentleigh East
   Assessment of retail potential

                     January 2018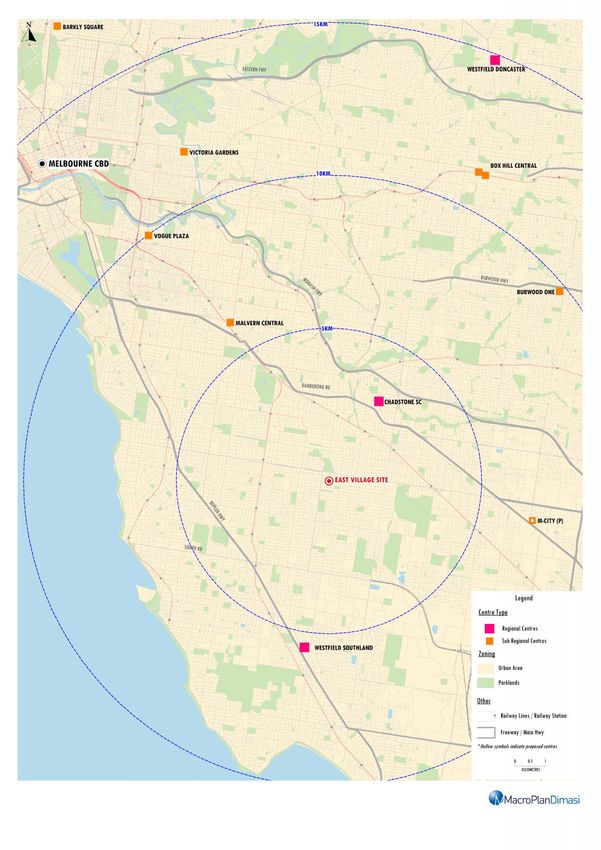
MacroPlan Dimasi

MELBOURNE                                    SYDNEY
Level 16                                     Level 52
330 Collins Street                           19 Martin Place
Melbourne VIC 3000                           Sydney NSW 2000
(03) 9600 0500                               (02) 9221 5211
BRISBANE                                     GOLD COAST
Level 15                                     Level 2
111 Eagle Street                             89 – 91 Surf Parade
Brisbane QLD 4000                            Broadbeach QLD 4218
(07) 3221 8166                               (07) 3221 8166
PERTH
Level 1
89 St Georges Terrace
Perth WA 6000
(08) 9225 7200

Prepared for: Victorian Planning Authority

MacroPlan Dimasi staff responsible for this report:

Ellis Davies, Manager – Retail
Adam Zhong, Analyst
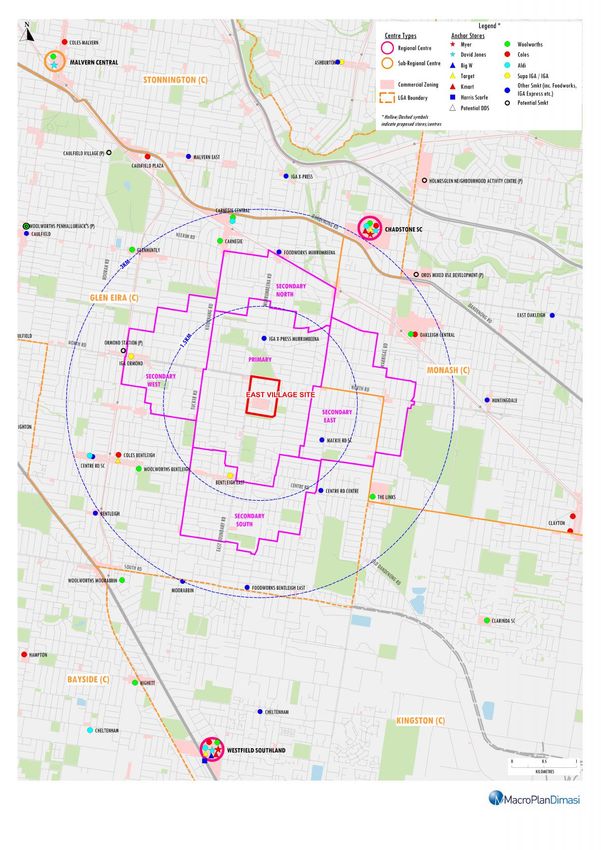
Table of contents

Executive summary                                  i

Introduction                                      iv

Section 1:     Site and regional context           1

      1.1    Site location and regional context    1

      1.2    Proposed development                  5

Section 2:     Trade area analysis                 7

      2.1    Trade area definition                 7

      2.2    Trade area population                10

      2.3    Socio-demographic profile            12

      2.4    Trade area retail spending           16

      2.5    Worker segment                       21

Section 3:     Competition                        23

      3.1    Existing retail facilities           23

      3.2    Proposed competitive developments    26

      3.3    Bulky goods                          29

      3.4    Retail floorspace demand analysis    31

Section 4:     Assessment of retail potential     35

Section 5:     Economic impact considerations     43

      5.1    Economic and social benefits         43

      5.2    Consideration of trading impacts     45

Section 6:     Key findings and conclusions       50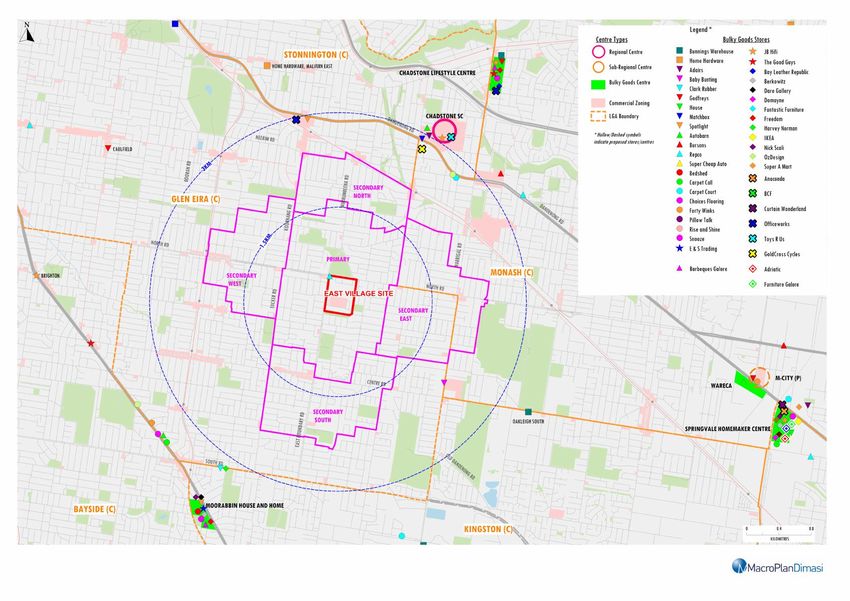
Executive summary

Report purpose
The purpose of this report is to provide Victorian Planning Authority with an independent
assessment of the potential for retail facilities at East Village, an urban renewal site situated
in Bentleigh East.

Site context
East Village is a 24 hectare site, situated near the intersection of North Road and East
Boundary Road in Bentleigh East, approximately 14 km south-east of the Melbourne CBD.
The Victoria Planning Authority (VPA), in conjunction with the City of Glen Eira, is developing
a plan that will facilitate the redevelopment of East Village for mixed-use development over
the medium to long term.

Proposed development
East Village will be a mixed use precinct and is planned to accommodate 60,000 –
80,000 sq.m of commercial development with 3,000 new dwellings, supporting around 5,000
– 6,000 residents. The precinct will also accommodate a variety of retail uses and a potential
new secondary school.

Trade area population
The main trade area population is estimated at 48,000 at mid-2017, including over 14,000
within the key primary sector. The residential component of East Village is expected to be
the main driver of population growth over the forecast period, with the East Village main
trade area population, including future residents at East Village, projected to reach over
59,000 at 2031, with almost 21,000 in the key primary sector. The annual population growth
rate is estimated to average 1.5% over the forecast period.

Socio-demographic profile
The socio-demographic profile of the East Village main trade area population is typical for a
middle-ring eastern area of Melbourne, which is characterised by above average incomes,
solid home ownership rates, above average representation of Asian and European born
residents, with households generally living as traditional families.

                                                                       East Village, Bentleigh East
                                                                                                        i
                                                                       Assessment of retail potential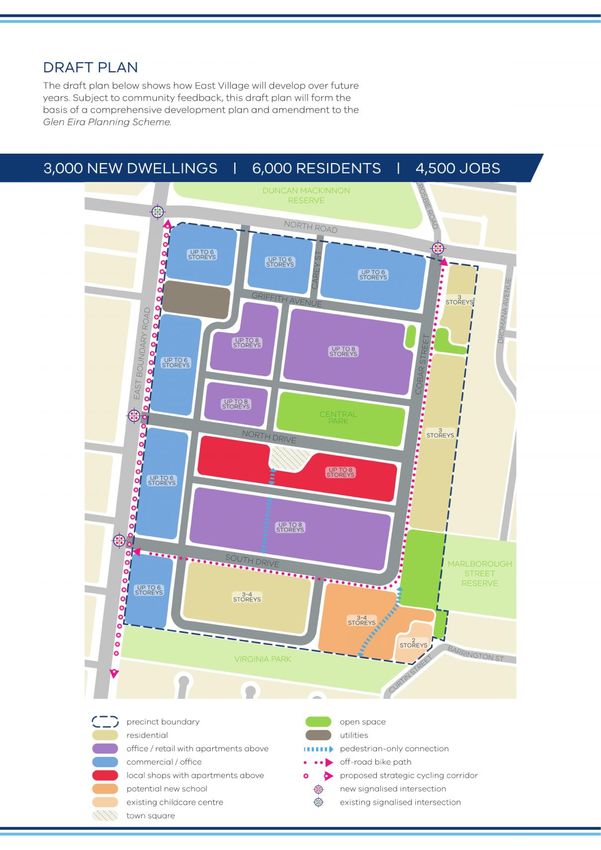
Executive summary

Retail expenditure
Retail spending per person within the main trade area is estimated at $14,538, which is 2.9%
above the average per capita retail expenditure of metropolitan Melbourne. FLG expenditure
(food, liquor and groceries), which is the main expenditure category for supermarkets, is
estimated at $289 million in 2017 and is forecast to increase to $413 million by 2031,
reflecting an average annual growth rate of 2.6%.

Worker population
In addition to serving residents, the future East Village development will also serve workers
in the surrounding area. According the ABS Census of Population and Housing 2016, there
are around 4,900 workers with a 1.5 km radius of East Village. There are two key
employment clusters within this radii, namely the existing worker population within East
Village and also at Moorabbin Hospital, which is situated around 1.5 km to the south.

Competitive retail environment
The main competitive centres to the future East Village are predominantly strip retail
centres, namely at Bentleigh East (anchored by a Ritchie’s Supa IGA), Bentleigh (anchored by
small Target store and Woolworths, Coles and Aldi supermarkets), Ormond (anchored by
IGA). In addition, a number of smaller convenience retail strips anchored by small foodstores
are also situated in the surrounding locality. Overall, there is currently a low provision of
supermarket floorspace in the local catchment.

Retail floorspace demand and retail potential
Based on the analysis presented in this report, we consider that a neighbourhood centre of
around 9,000 sq.m (7,700 sq.m retail and 1,300 sq.m non-retail) is supportable at the subject
site, anchored by a full scale supermarket. A neighbourhood centre of this scale would be
able to effectively serve the food and convenience retail needs of local residents, while the
majority of the non-food retail needs of surrounding residents would still be served by
higher-order activity centres in the broader region.

                                                                    East Village, Bentleigh East
                                                                                                     ii
                                                                    Assessment of retail potential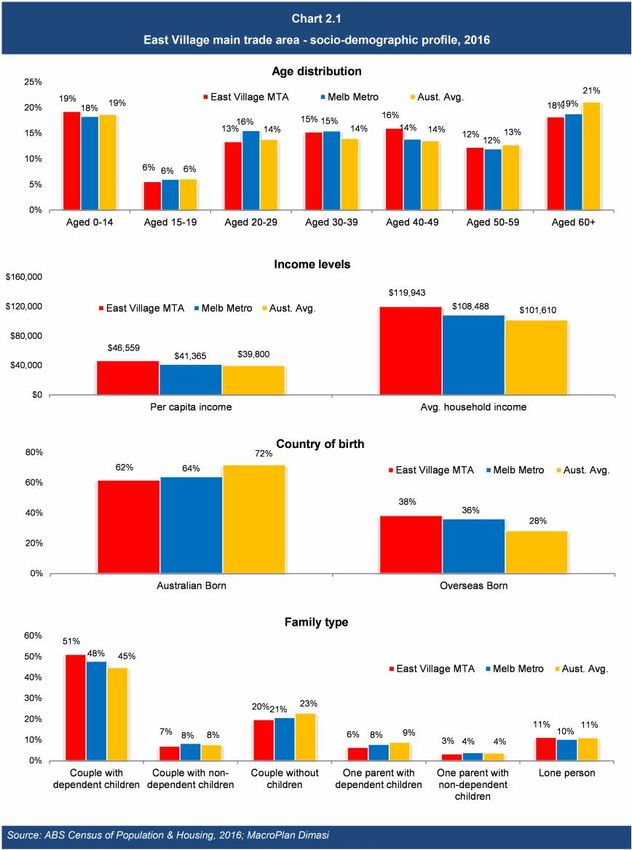
Executive summary

Bulky goods competition and potential
The northern part of the East Village site is considered the most appropriate location for
large format retail outlets at the subject site. The location would give large format retailers
high visibility and the stores would be easily accessible. Given the catchment population and
the site location, we do not consider that the East Village site is an appropriate location for
anchor large format retailers (i.e. greater than 10,000 sq.m in size) but that several smaller
scale (i.e. 1,000 – 2,000 sq.m in size) large format retailers are expected to be supportable at
the subject site fronting North Road.

Economic impact considerations and net community benefit
The development of retail facilities at East Village is likely to result in a range of economic
impacts, with the key positive impacts including the ability of the centre to serve the future
residents of East Village; providing for the convenience retail needs of other local residents;
creating a focal point for the community; and providing local employment opportunities.

The East Village retail centre, of the scale recommended, is expected to have some trading
impacts on existing facilities. The estimated impacts are not considered to threaten the
viability of any centre in the region. This conclusion reflects the broad range of facilities and
services at the major activity centres in the area, and the top-up shopping role of the smaller
centres. In addition, the proposed retail facilities at East Village will source a substantial
proportion of sales from future residents on site, which will mitigate potential impacts on
other centres in the surrounding area.

                                                                       East Village, Bentleigh East
                                                                                                        iii
                                                                       Assessment of retail potential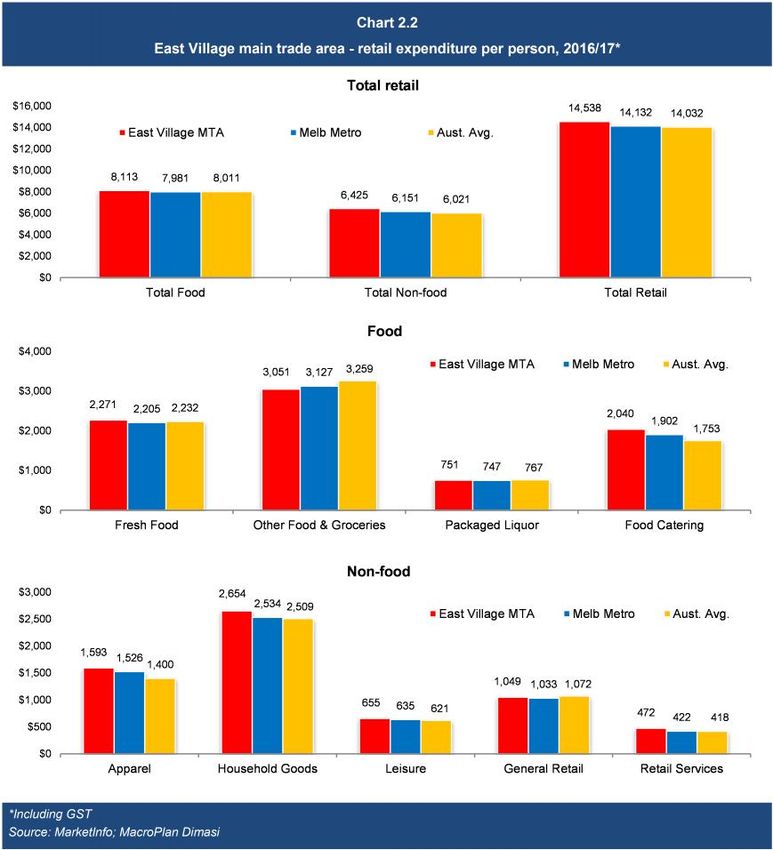
Introduction
This report presents an independent assessment of the potential for retail facilities at
East Village, an urban renewal site situated in the established suburb of Bentleigh East,
approximately 14 km south-east of the Melbourne CBD.
This report has been prepared in accordance with instructions from Victorian Planning
Authority, and is presented in six sections as follows:
Section 1 provides an overview of the site context of East Village and summarises the
proposed development of the subject site.
Section 2 examines the trade area available to the proposed East Village development,
including current and projected population levels, the socio-demographic profile of the
population, and the estimated current and future retail expenditure capacity of trade
area residents. This section also reviews the local worker customer segment.
Section 3 reviews the competitive environment in which the East Village will operate,
including existing and future competitive developments, and also provides a retail
floorspace demand assessment.
Section 4 provides an assessment of the retail floorspace considered supportable at the
subject site.
Section 5 outlines the potential economic impacts that can be anticipated from the
proposed development.
Section 6 outlines the key findings and conclusions.
East Village, Bentleigh East
iv
Assessment of retail potentialSection 1: Site and regional context
This section of the report provides an overview of the site context of East Village and
summarises the proposed development of the subject site.
1.1 Site location and regional context
East Village is a 24 hectare site, situated near the intersection of North Road and East
Boundary Road in Bentleigh East, approximately 14 km south-east of the Melbourne CBD
(refer Map 1.1). The Victoria Planning Authority (VPA), in conjunction with the City of
Glen Eira, is developing a plan that will facilitate the redevelopment of East Village for mixed-
use development over the medium to long term. This report analyses the retail opportunities
considered supportable at the site, and gives recommendations to the potential scale and
offer.
A range of light industrial, commercial and non-retail uses currently occupy the East Village
site, such as Repco (auto parts), Budget and Avis car rentals, as well as car repairers, all of
which front North Road (a major east-west arterial in the region providing access to the M1
to the east and Brighton to the west). On the western boundary of East Village, a number of
commercial and warehouse developments front East Boundary Road, including the
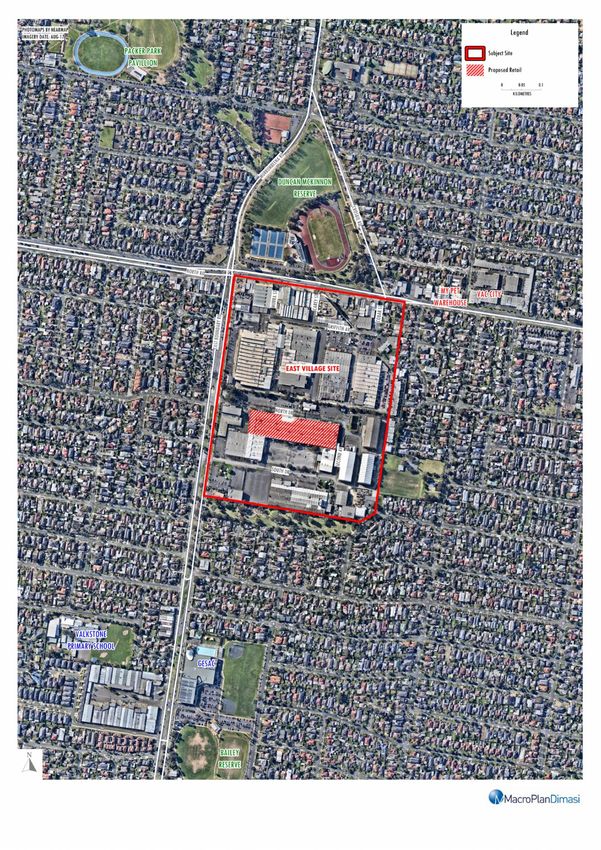
corporate headquarters of office supplies retailer Officeworks. Map 1.2 illustrates the
context of site.
In retailing terms, two super-regional shopping centre are located to the north and south of
East Village (refer Map 1.1). Chadstone, situated approximately 5 km to the north, is the
largest shopping centre in Australia and is anchored by a range of leading retailers. The
centre also contains over 500 retail specialty stores, including the only enclosed luxury
apparel precinct in Melbourne. A $660 million expansion of the centre was recently
completed which introduced an additional food court, a new dining precinct, a Legoland
Playcentre, a redevelopment of the Hoyts cinema complex, and the introduction of
East Village, Bentleigh East
1
Assessment of retail potentialSection 1: Site and regional context
international fast retailers H&M and Uniqlo. According to SCN’s Big Guns 2017 publication,
Chadstone (in the midst of its redevelopment) achieved sales of more than $1.5 billion.
Situated approximately 7 km to the south of the subject site, Westfield Southland is
anchored by Myer and David Jones department stores and all major discount department
store operators – Kmart, Target and Big W. According to SCN’s Big Guns 2017 publication,
Westfield Southland achieved sales of $860 million.
A range of smaller activity centres are also located throughout this part of Melbourne, with
relatively significant centres at Bentleigh to the south-west, Carnegie to the north-west and
Oakleigh to the north-east. These centres are discussed in further detail in Section 3 of this
report.
East Village, Bentleigh East
2
Assessment of retail potentialMap 1.1: East Village Regional context
Map 1.2: East Village
Site location
Section 1: Site and regional context
1.2 Proposed development
The proposed redevelopment of East Village is illustrated on Figure 1.1. The key facets of the
redevelopment to note are summarised as follows:
East Village is planned to accommodate up to 3,000 new dwellings, supporting around
5,000 – 6,000 residents. The redevelopment is planned to accommodate mid-rise towers
of up to 8 storeys, as well as a small provision of townhouses.
A number of commercial office towers, of up to 6 storeys, are planned on the northern
and western boundary of the development, fronting North Road and East Boundary
Road. One of the key visions of the subject redevelopment site is to maintain its use as
an employment cluster, with East Village planned to accommodate approximately
60,000 – 80,000 sq.m of commercial development upon completion.
A potential new secondary school is planned to be developed in the south-eastern
corner of the East Village site.
A town square and open space are planned to be centred around the residential
components of East Village.
Ground floor retail is planned beneath mid-rise residential towers which centre East
Village, accessible from East Boundary Road and the future Cobar Street (a north-south
traffic route to be developed as part of East Village, planned to connect to Crosbie
Street, north of North Road). The scale and offer of the East Village retail component is
the subject of this assessment.
East Village, Bentleigh East
5
Assessment of retail potentialFigure 1.1
Section 2: Trade area analysis
This section of the report analyses the trade area available to the proposed East Village
development, including current and projected population levels, the socio-demographic
profile of the population, and the estimated current and future retail expenditure capacity of
trade area residents. This section also reviews the worker customer segment available to the
proposed East Village.
2.1 Trade area definition
The extent of the trade area or catchment that is served by any shopping centre or retail
facility is shaped by the interplay of a number of critical factors. These factors include:
The relative attraction of the centre, in comparison with alternative competitive retail
facilities. The factors that determine the strength and attraction of any particular centre
are primarily its scale and composition (in particular the major trader or traders that
anchor the centre); its layout and ambience; and carparking, including access and ease of
use.
The proximity and attractiveness of competitive retail centres. The locations,
compositions, quality and scale of competitive retail facilities all serve to define the
extent of the trade area which a shopping centre is effectively able to serve.
The available road network and public transport infrastructure, which determine the ease
(or difficulty) with which customers are able to access a shopping centre.
Significant physical barriers which are difficult to negotiate, and can act as delineating
boundaries to the trade area served by an individual shopping centre.
The trade area defined for the East Village retail centre reflects its location, which will be
accessible from East Boundary Road; the potential role of the future centre, which is likely to
primarily serve the food, grocery and convenience-oriented needs of the future East Village
population and other local residents; and the network of competitive retail facilities in the
region.
East Village, Bentleigh East
7
Assessment of retail potentialSection 2: Trade area analysis
Map 2.1 illustrates the main trade area defined for the planned East Village development,
which includes a primary sector and four secondary sectors, described as follows:
The primary sector encompasses parts of Bentleigh East, Carnegie and Murrumbeena and
is generally bounded by Poath Road and Tambet Street to the east, and Koornang Road
and Tucker Road to the west;
The secondary north sector contains parts of Carnegie and Murrumbeena, and is
generally bound by the Pakenham Line railway track to the north, Poath Road to the east
and Koornang Road to the west;
The secondary east sector encompasses parts of Bentleigh East, Hughesdale, Oakleigh
and Oakleigh South, and is generally bound by Kangaroo Road to the north, Golf Road to
the east, Tudor Street to the south and Poath Road and Tambet Street to the west;
The secondary south sector contains parts of Bentleigh East and is generally bound by
Mawby Road to the south and Tucker Road to the west;
The secondary west sector encompasses parts of Ormond, Carnegie and McKinnon, and
is generally bound by Koornang Road and Tucker Road to the east and the Frankston Line
railway tracks to the west.
In combination, the primary and secondary sectors form the main trade area for East Village.
East Village, Bentleigh East
8
Assessment of retail potentialMap 2.1: East Village Main trade area and retail competitive context
Section 2: Trade area analysis
2.2 Trade area population
Table 2.1 details the estimated current and future population levels within the East Village
main trade area. This information has been collected from a range of sources including the
following:
Australian Bureau of Statistics (ABS) Census of Population and Housing (2016);
ABS Dwellings Approvals and Estimated Residential Population Data (2011 – 2016);
Population projections prepared by forecast.id for the City of Glen Eira (updated in
October 2017);
Population projections prepared by forecast.id for the City of Monash (updated in
September 2017);
Victoria in Future (2016) population projections prepared by the Victorian Government;
and
Other investigations of future residential developments.
The main trade area population is estimated at 48,000 at mid-2017, including over 14,000
within the key primary sector. Over the most recent intercensal period (2011 to 2016), the
main trade area population increased by 1.8% or 790 residents per annum.
The residential component of East Village is expected to be the main driver of population
growth over the forecast period to 2031. The urban renewal site is projected to yield up to
3,000 medium and high density dwellings, accommodating 5,000 – 6,000 residents on
completion. For the purposes of this assessment, is it assumed that East Village is completed
and fully occupied by around 2026, though it is acknowledged that the development may not
be fully completed by this time.
Population growth in the East Village main trade area will also be underpinned by a number
of smaller urban infill developments, which will raise the density of housing in the area.
East Village, Bentleigh East
10
Assessment of retail potentialSection 2: Trade area analysis
Taking the above in account, the East Village main trade area population is projected to
reach over 59,000 at 2031 (including almost 21,000 in the key primary sector). This reflects
an average annual growth rate of 1.5% over the forecast period.
Table 2.1
East Village trade area population, 2011-2031*
Estimated population Forecast population
Trade area sector 2011 2016 2017 2021 2026 2031
Primary 12,800 13,870 14,070 14,870 19,870 20,870
Secondary sectors
• North 6,670 7,440 7,590 8,190 8,690 9,190
• East 9,040 9,810 9,910 10,230 10,630 10,880
• South 7,050 7,760 7,860 8,260 8,660 8,960
• West 7,800 8,430 8,530 8,850 9,150 9,450
Total secondary 30,560 33,440 33,890 35,530 37,130 38,480
Main trade area 43,360 47,310 47,960 50,400 57,000 59,350
Average annual growth (no.)
Trade area sector 2011-16 2016-17 2017-21 2021-26 2026-31
Primary 214 200 200 1,000 200
Secondary sectors
• North 154 150 150 100 100
• East 154 100 80 80 50
• South 142 100 100 80 60
• West 126 100 80 60 60
Total secondary 576 450 410 320 270
Main trade area 790 650 610 1,320 470
Average annual growth (%)
Trade area sector 2011-16 2016-17 2017-21 2021-26 2026-31
Primary 1.6% 1.4% 1.4% 6.0% 1.0%
Secondary sectors
• North 2.2% 2.0% 1.9% 1.2% 1.1%
• East 1.6% 1.0% 0.8% 0.8% 0.5%
• South 1.9% 1.3% 1.2% 1.0% 0.7%
• West 1.6% 1.2% 0.9% 0.7% 0.6%
Total secondary 1.8% 1.3% 1.2% 0.9% 0.7%
Main trade area 1.8% 1.4% 1.2% 2.5% 0.8%
*As at June
Source: ABS Census 2016; Victoria In Future 2016; MacroPlan Dimasi
East Village, Bentleigh East
11
Assessment of retail potentialSection 2: Trade area analysis
2.3 Socio-demographic profile
Table 2.2 and Chart 2.1 detail the socio-demographic profile of the East Village trade area
population, sourced from the 2016 ABS Census of Population and Housing. The profile is
compared with benchmarks for metropolitan Melbourne and Australia. The key points to
note include the following:
Main trade area residents earn incomes which are almost 13% above the metropolitan
Melbourne benchmark on both a per capita basis, with above average incomes evident
for all trade area sectors. Over the intercensal period from 2011 to 2016, per capita
incomes in the main trade area grew at around 3% faster than the Melbourne
metropolitan average.
The average age of the East Village main trade area population is generally in-line with
the metropolitan Melbourne benchmark. However, there is an above average
representation of children, teenagers and middle aged residents in the 40-59 age
brackets, and an below average representation of young and middle aged adults in the
20-39 year brackets, all of which is particularly evident in the primary sector.
The home ownership levels of households in the main trade area, at 67.1% (down from
69.6% in 2011), are below the metropolitan Melbourne average of 68.5%. This is
underpinned by the low ownership rates in the secondary north and secondary west
sectors, with both sectors also recording lower ownership levels in 2016 compared to
2011. The remaining sectors exhibit home ownership rates above 73%, driven by above
benchmark outright ownership rates.
Residents in the East Village main trade area are predominantly Australia born,
representing 61.7% of residents (down from 63.5% in 2011), although this is below the
metropolitan Melbourne benchmark. This is driven by an above average representation
of European born residents in the primary, secondary east and secondary south sectors,
and a significant above average representation of Asian born residents in the secondary
north and secondary west sectors.
East Village, Bentleigh East
12
Assessment of retail potentialSection 2: Trade area analysis
The main trade area contains an above average proportion of traditional families
(i.e. households comprising couples with dependent children) at 51.2% of all households
(up from 48.8% in 2011), which is above the metropolitan Melbourne average of 47.8%.
77.1% of households in the trade area own 1 or 2 cars, which is above the metropolitan
Melbourne benchmark of 73.4%.
The socio-demographic profile of the East Village main trade area population is typical for a
middle-ring eastern suburbs area of Melbourne, which is characterised by above average
incomes, solid home ownership rates, above average representation of Asian and European
born residents, with households generally living as traditional families.
East Village, Bentleigh East
13
Assessment of retail potentialSection 2: Trade area analysis
Table 2.2
East Village main trade area - socio-demographic profile, 2016
Primary Secondary sectors Main Melb Metro Aust.
Census item sector North East South West TA avg. avg.
Per capita income $47,327 $47,239 $44,284 $44,452 $49,279 $46,559 $41,365 $39,800
Var. from Melb Metro bmark 14.4% 14.2% 7.1% 7.5% 19.1% 12.6%
Avg. household income $128,292 $107,728 $121,376 $115,987 $120,987 $119,943 $108,488 $101,610
Var. from Melb Metro bmark 18.3% -0.7% 11.9% 6.9% 11.5% 10.6%
Avg. household size 2.7 2.3 2.7 2.6 2.5 2.6 2.6 2.6
Age distribution (% of population)
Aged 0-14 20.3% 15.0% 20.4% 20.6% 18.8% 19.3% 18.3% 18.7%
Aged 15-19 6.5% 3.6% 5.9% 5.4% 5.8% 5.6% 6.0% 6.1%
Aged 20-29 11.2% 20.1% 12.3% 10.1% 15.3% 13.4% 15.5% 13.8%
Aged 30-39 12.7% 21.6% 15.1% 13.1% 15.9% 15.2% 15.5% 14.0%
Aged 40-49 17.2% 12.3% 16.9% 16.8% 15.6% 16.0% 13.9% 13.5%
Aged 50-59 12.8% 10.5% 12.5% 12.2% 12.8% 12.3% 12.0% 12.7%
Aged 60+ 19.4% 16.9% 16.8% 21.8% 15.8% 18.2% 18.8% 21.1%
Average age 38.5 37.3 37.1 39.4 36.7 37.8 37.6 38.6
Housing status (% of households)
Owner (total) 74.0% 51.5% 73.5% 73.2% 59.6% 67.1% 68.5% 67.4%
• Owner (outright) 36.6% 24.7% 34.6% 37.3% 30.1% 33.0% 31.4% 31.9%
• Owner (with mortgage) 37.3% 26.8% 38.9% 35.9% 29.4% 34.1% 37.1% 35.5%
Renter 25.9% 48.2% 26.4% 26.2% 40.1% 32.7% 30.9% 31.8%
Birthplace (% of population)
Australian born 63.7% 54.1% 65.4% 65.4% 57.6% 61.7% 63.9% 71.9%
Overseas born 36.3% 45.9% 34.6% 34.6% 42.4% 38.3% 36.1% 28.1%
• Asia 14.7% 27.9% 16.2% 11.2% 22.5% 17.9% 17.3% 11.2%
• Europe 13.1% 11.2% 12.2% 13.6% 11.5% 12.4% 11.0% 9.6%
• Other 8.6% 6.8% 6.3% 9.8% 8.3% 8.0% 7.8% 7.4%
Family type (% of households)
Couple with dep't child. 54.9% 43.0% 53.7% 50.6% 51.3% 51.2% 47.8% 44.8%
Couple with non-dep't child. 7.8% 5.4% 8.3% 7.1% 6.0% 7.0% 8.3% 7.7%
Couple without child. 17.7% 25.8% 17.3% 19.8% 19.3% 19.7% 20.7% 22.8%
One parent with dep't child. 6.4% 4.5% 6.8% 7.7% 6.5% 6.4% 7.8% 8.8%
One parent w non-dep't child. 3.3% 2.3% 3.8% 4.1% 2.9% 3.3% 3.9% 3.7%
Lone person 9.1% 17.3% 8.4% 9.7% 12.7% 11.2% 10.2% 11.0%
Car ownership
% 0 Cars 6.9% 8.5% 3.9% 5.5% 8.6% 6.7% 9.1% 7.7%
% 1 Car 35.4% 35.2% 32.2% 40.6% 38.2% 36.1% 36.0% 36.1%
% 2 Cars 40.8% 40.4% 44.2% 40.3% 39.3% 41.0% 37.4% 37.5%
% 3 Cars 11.7% 10.8% 13.6% 9.3% 9.4% 11.1% 11.4% 12.2%
% 4 plus Cars 5.2% 5.0% 6.0% 4.3% 4.6% 5.1% 6.1% 6.5%
Source: ABS Census of Population & Housing, 2016; MacroPlan Dimasi
East Village, Bentleigh East
14
Assessment of retail potentialSection 2: Trade area analysis
East Village, Bentleigh East
15
Assessment of retail potentialSection 2: Trade area analysis
2.4 Trade area retail spending
The estimated retail expenditure capacity of the main trade area population is sourced from
MarketInfo, which is developed by Market Data Systems (MDS) and utilises a detailed micro
simulation model of household expenditure behaviour for all residents of Australia. The
model takes into account information from a wide variety of sources including the regular
ABS Household Expenditure Surveys, national accounts data, Census data and other
information. The MarketInfo estimates for spending behaviour prepared independently by
MDS are used by a majority of retail/property consultants. All spending figures presented in
this report are expressed inclusive of GST and presented in constant 2016/17 dollars (i.e.
excluding retail inflation).
Chart 2.2 details the estimated retail spending levels of the main trade area population on a
per capita basis in 2016/17. Retail spending per person within the main trade area is
estimated at $14,538, which is 2.9% above the average per capita retail expenditure of
metropolitan Melbourne.
‘Fresh food’ and ‘Other food & groceries’, which are the main expenditure categories for
supermarkets, are estimated at $2,271 and $3,051 respectively, with the combined
expenditure total of these two categories measuring in line with the metropolitan
Melbourne average.
East Village, Bentleigh East
16
Assessment of retail potentialSection 2: Trade area analysis
East Village, Bentleigh East
17
Assessment of retail potentialSection 2: Trade area analysis
Table 2.3 details the estimated retail spending capacity of the main trade area population
over the forecast period of 2017 – 2031. The total retail expenditure capacity of the main
trade area population is estimated at $693 million in 2017, including $204 million in the
primary sector. The retail expenditure capacity of the main trade area population is
projected to increase to $977 million by 2031, including $345 million in the primary sector.
Over the forecast period, total retail expenditure by main trade area residents is projected to
grow at 2.5% growth per annum.
The market growth rate in retail expenditure for the East Village main trade area over the
forecast period is made up of the following components:
Average population growth of 1.6% per annum; and
Real per capita spending growth of 0.9% - 1.0% per annum.
East Village, Bentleigh East
18
Assessment of retail potentialSection 2: Trade area analysis
Table 2.3
East Village main trade area - retail expenditure ($M), 2017-2031*
Year ending Primary Secondary sectors Main
June sector North East South West TA
2017 204 112 139 112 125 693
2018 209 115 142 115 127 708
2019 214 118 144 117 130 723
2020 219 122 147 120 132 739
2021 224 125 149 122 135 755
2022 234 128 152 125 137 776
2023 251 131 154 127 139 802
2024 268 134 157 130 141 829
2025 287 136 159 132 144 858
2026 306 139 162 135 146 889
2027 320 142 165 137 148 912
2028 326 145 167 139 151 928
2029 332 148 169 141 153 944
2030 339 151 172 144 155 961
2031 345 154 174 146 158 977
Average annual growth ($M)
2017-2031 10.1 3.1 2.5 2.4 2.3 20.3
Average annual growth (%)
2017-2031 3.8% 2.3% 1.6% 1.9% 1.7% 2.5%
*Constant 2016/17 dollars & including GST
Source: MarketInfo; MacroPlan Dimasi
East Village, Bentleigh East
19
Assessment of retail potentialSection 2: Trade area analysis
Table 2.4 presents the retail spending capacity of the main trade area population across key
retail categories, as well as the category definitions. FLG expenditure (food, liquor and
groceries), which is the main expenditure category for supermarkets, is estimated at
$289 million in 2017 and is forecast to increase to $413 million by 2031, reflecting an
average annual growth rate of 2.6%.
Table 2.4
East Village main trade area - retail expenditure by category ($M), 2017-2031*
Year ending FLG Food Apparel Household Leisure General Retail Total
June catering goods retail services retail
2017 289 97 76 126 31 50 22 693
2018 296 100 77 129 32 51 23 708
2019 303 103 79 132 32 52 24 723
2020 310 106 80 134 33 53 24 739
2021 317 109 81 137 33 54 25 755
2022 326 112 83 141 34 55 25 776
2023 337 117 86 145 35 57 26 802
2024 349 121 88 150 36 58 27 829
2025 361 126 91 155 37 60 28 858
2026 374 131 94 160 39 62 29 889
2027 384 135 96 164 40 63 30 912
2028 391 138 97 167 40 64 30 928
2029 398 142 98 169 41 65 31 944
2030 406 145 100 172 41 66 32 961
2031 413 148 101 175 42 67 32 977
Average annual growth ($M)
2017-2031 8.8 3.7 1.8 3.4 0.7 1.2 0.7 20.3
Average annual growth (%)
2017-2031 2.6% 3.1% 2.1% 2.3% 2.1% 2.1% 2.6% 2.5%
*Constant 2016/17 dollars & including GST
Source: MarketInfo; MacroPlan Dimasi
East Village, Bentleigh East
20
Assessment of retail potentialSection 2: Trade area analysis
2.5 Worker segment
In addition to serving residents, the East Village development will also serve workers in the
surrounding area. The redeveloped East Village is planned to accommodate some 60,000 –
80,000 sq.m of commercial development which is likely to result in a substantial increase
from the current worker population of the East Village site, which is approximately 1,500.
According to the ABS Census of Population and Housing 2016, there are around 4,900
workers with a 1.5 km radius of East Village. There are two key employment clusters within
this radii, namely the existing worker population within East Village and also at Moorabbin
Hospital, which is situated around 1.5 km to the south.
This market, in particular the immediate East Village workforce, will drive the food catering
offer within the centre at lunchtime. The surrounding workforce may also utilise
supermarket facilities at East Village for their top-up food and grocery needs.
The profile of workers within the defined trade area is detailed on Table 2.5 and is compared
against the profile of the Melbourne metropolitan workforce, as at the 2016 ABS Census. Key
points to note include the following:
White collar workers (managers and professionals) account for 41.3% of the worker
population, slightly above the average for metropolitan Melbourne of 39.8%. Clerical and
service workers (27.4%) as well as tradespersons and technicians (14.7%) are the other
main occupational categories.
Average incomes of the worker population are estimated at $67,746 per annum, which is
3% below the average for metropolitan Melbourne. 36.3% of the trade area workforce
earns greater than $65,000 per annum, which is below the benchmark of 38.4%.
Travel by car accounts for 74.0% of mode of transport to work.
The main industries of employment for the surrounding workforce are Healthcare and
social assistance (at 23.7%, attributable to the nearby Moorabbin Hospital), Wholesale
trade (12.3%), manufacturing (9.2%) and retail trade (9.2%).
East Village, Bentleigh East
21
Assessment of retail potentialSection 2: Trade area analysis
Table 2.5
East Village worker trade area - Worker population profile, 2016
Worker Melb Metro
Characteristics TA avg.
Gender
Male 47.4% 51.9%
Female 52.4% 48.1%
Age distribution
Aged 15-19 4.7% 4.2%
Aged 20-29 19.8% 21.9%
Aged 30-49 46.0% 47.1%
Aged 50-64 25.5% 23.3%
Aged 65+ 4.0% 3.6%
Average age 41.0 40.1
Occupation
Managers 12.1% 13.8%
Professionals 29.2% 26.0%
Clerical and service workers 27.4% 25.0%
Sales workers 8.4% 10.1%
Tradespersons and technicians 14.7% 17.4%
Labourers & transport workers 8.2% 7.8%
Personal income
Less than $20,799 14.6% 12.2%
$20,800 - $41,599 22.6% 22.8%
$41,600 - $64,999 26.5% 26.5%
$65,000 - $103,999 22.3% 24.1%
$104,000 to $130,000 8.2% 8.7%
$130,000 or more 5.8% 5.6%
Average income 67,746 69,526
Mode of transport
Train 2.9% 11.8%
Tram (& light rail) 0.0% 2.6%
Bus 1.1% 1.4%
Car driver 70.2% 60.0%
Car passenger 3.8% 3.8%
Bicycle 1.1% 1.4%
Other 6.2% 6.0%
Non travel 14.7% 13.0%
Industry of employment
Agriculture, forestry and fishing 0.0% 0.6%
Mining 0.0% 0.2%
Manufacturing 9.2% 8.4%
Electricity, gas, water and waste services 0.2% 1.1%
Construction 8.4% 7.1%
Wholesale trade 12.3% 3.8%
Retail trade 9.2% 10.9%
Accommodation and food services 3.0% 7.0%
Transport, postal and warehousing 2.4% 5.3%
Information media and telecommunications 0.7% 2.3%
Financial and insurance services 2.7% 4.9%
Rental, hiring and real estate services 0.8% 1.8%
Professional, scientific and technical services 5.8% 9.8%
Administrative and support services 2.4% 3.5%
Public administration and safety 2.4% 5.5%
Education and training 7.1% 9.3%
Health care and social assistance 23.7% 12.7%
Arts and recreation services 4.4% 2.2%
Other services 5.3% 3.8%
Source: ABS Worker Population Profile 2016, MacroPlan Dimasi
East Village, Bentleigh East
22
Assessment of retail potentialSection 3: Competition
This section reviews the competitive environment in which the East Village will operate,
including existing and future competitive developments and also provides a retail floorspace
demand assessment.
3.1 Existing retail facilities
To accurately assess the supply of retail facilities in the surrounding area, a retail audit of all
strip and enclosed shopping centres was completed by MacroPlan in December 2017.
Table 3.1 details the provision of retail facilities by category within the surrounding region,
with the previous Map 2.1 illustrating its locations. The key points to note are as follows:
Situated around 1.5 km south of East Village, the Bentleigh East strip centre is
predominantly situated on Centre Road. The strip centre is anchored by a Ritchies Supa
IGA of almost 2,000 sq.m and is supported by almost 70 retail specialties. There is a small
provision of F&G retailers supporting the supermarket, which includes 4 fresh food
operators, a bakery, as well as convenience oriented retail such as a pharmacy and a
newsagency. The centre encompasses a solid food and beverage offer, containing
10 cafes (including the popular Merchant’s Guild and Boosa), 6 take-away food operators,
as well as a small restaurant offer (with an emphasis placed on Asian cuisines). The
Bentleigh East strip centre also contains a strong retail services provision, accommodating
a range of hairdressers and beauty salons, as well as an optometrist and 2 drycleaning
operators.
To the west of the Bentleigh East strip centre, the Bentleigh strip centre is also situated
on Centre Road, and is concentrated around Bentleigh Station. The strip centre is sub-
regional in nature, anchored by a small Target discount department store, as well as
Woolworths, Coles and Aldi supermarkets. The centre encompasses a strong food and
beverage provision, highlighted by the diverse offering of 15 restaurants, 18 cafes and 18
take-away food outlets. While parts of the offer is dated, the strip centre contains a
number of boutique café and modern restaurant concepts which are popular and well-
East Village, Bentleigh East
23
Assessment of retail potentialSection 3: Competition
reviewed including Little Tommy Tucker, Mexico City, Noisette Bentleigh and Sumalee.
The centre contains a strong non-food provision, which is atypical of strip centres,
accommodating a range of predominantly independent womenswear retailers,
convenience oriented retail (which includes 3 newsagents, 6 pharmacies and 4 discount
variety stores), as well as retail services (which includes 5 hairdressers, 8 beauty salons
and 3 optometrists).
Situated approximately 3 km to the south-west of East Village, McKinnon Village is a
small strip specialty centre. The offer of the centre is ad hoc and generally dated, and
contains a small food-catering offer, a pharmacy, a newsagency, as well as 4 hairdressers
and a beauty salon.
The Ormond retail strip centre is predominantly centred on North Road, around Ormond
Station. The centre is anchored by a IGA supermarket, and in addition to the traditional
convenience-oriented supporting retail (food retail, retail services, pharmacy,
newsagency), the centre contains a solid food and beverage offer encompassing 5 cafes,
8 restaurants and 11 take-away food outlets. However, while the strip centre contains a
solid volume of food catering retailers, the offer is generally aged, with a few notable
exceptions providing unique concepts such as Babu Burger and Jimmy Grants.
The Carnegie strip centre is primarily focussed around Koornang Road and also
encompasses Carnegie Central, an enclosed shopping centre anchored by Woolworths
and Aldi supermarkets, as well as a Spotlight outlet (and also contains a small provision of
convenience-oriented specialty). The strip centre has a strong food catering focus and is a
busy dinner time destination, accommodating a number of popular quick service
restaurants such as Auntie’s Dumpling Restaurant and Shyun Ramen Bar, as well as
national franchises operators Grill’d and Nando’s. Overall, the food and beverage offer at
the Carnegie strip centre encompasses 11 cafes, 33 restaurants (serving predominantly
Asian oriented cuisine) and 9 take-away food outlets.
The Murrumbeena (North) retail strip is anchored by a Foodworks outlet and contains an
ad hoc provision of specialty retailers. The food catering offer at the centre is generally
dated and accommodates 4 cafes, 3 restaurants and 2 take-away food operators. In
East Village, Bentleigh East
24
Assessment of retail potentialSection 3: Competition
addition to a solid provision of convenience-oriented retail which includes 4 hairdressers,
a beauty salon and a pharmacy, the centre contains an independent electrical appliances
retailer.
The Murrumbeena (South) retail strip is a small centre anchored by an IGA X-press and
supported by 8 specialties, which includes a pharmacy, 3 take-away food outlets and a
hairdresser.
Mackie Road SC is a small strip centre, predominantly serving the food and grocery top-
up and convenience oriented needs of surrounding local residents. The centre contains an
independent foodstore, and is supported by key convenience-oriented components
which include a bakery, 2 fresh food retailers, a café, 2 take-away food operators, a
packaged liquor outlet, a pharmacy, newsagency and hairdresser.
Centre Road Bentleigh East is also a small strip centre, which serves a similar top food
and grocery and convenience-oriented function as Mackie Road SC. The centre is
anchored by a small Foodworks foodstore, and is supported by 8 specialty retailers (a
fresh food retailer, a bakery, a take-away food outlet, a pharmacy, a newsagency, a
hairdresser and a drycleaners).
The Links SC in Oakleigh South is a Woolworths anchored supermarket based centre,
which was adjoined to a Master Home Improvement centre (currently vacant). The centre
encompasses a small food catering provision, limited to a café, a Chinese restaurant and 2
take-away food outlets, with the volume of food catering retailers generally typical of a
small supermarket based centre. In addition, McDonald’s, Red Rooster and La Porchetta
Italian restaurants are situated in close proximity, reinforcing the food catering offer of
the centre. A number of core convenience-oriented specialties support the supermarket,
including a pharmacy, a newsagency, a discount variety store and a hairdresser.
Situated 4.2 km north-east of East Village, Oakleigh Central is an enclosed double
supermarket based centre, anchored by Woolworths and Coles supermarkets. The centre
contains around 12,000 sq.m of retail floorspace and provides a range of convenience-
oriented specialties and a small provision of both apparel and food catering retailers.
There is a range of additional strip retail situated to the immediate north of Oakleigh
East Village, Bentleigh East
25
Assessment of retail potentialSection 3: Competition
Central, situated on Portman Street, Chester Street, Atherton Road, Station Street and
the popular café/dining strip – Eaton Mall. The offer of the strip retailers encompasses a
diverse food catering and dining rang and also reinforces the convenience-oriented offer
of Oakleigh Central.
Beyond the main trade area, two super-regional shopping centres are located to the north
and south the East Village site. Chadstone, which is situated approximately 5 km to the
north, is the largest shopping centre in Australia, while Westfield Southland is situated 7 km
to the south. Both centres serve broad trade areas, and cater to the higher-order shopping
needs of surrounding residents.
3.2 Proposed competitive developments
In addition to the current state of play of existing retail facilities surrounding East Village,
proposed competitive developments include:
Ormond Sky Tower, which is a mixed-use high density project, planned to be developed
above Ormond Station. Planning Minister Richard Wynne had approved the 13-storey
tower encompassing 233 apartments and a full-line supermarket (approximately
4,100 sq.m in size) despite a long-running campaign against it by local residents and Glen
Eira Council, which pushed for eight storeys to match the low-rise area. This approval
was later blocked in the Victorian Upper House backed by the state opposition, Greens
and Australian Conservatives. The development may proceed in some diminished
residential form over the medium term, potentially including the proposed retail
component.
Oros Mixed Use Development, which is situated near the intersection of Dandenong
Road and Warrigal Road. The project has been granted planning approval for the
development of 348 apartments and 106 serviced apartments, as well as a 1,400 sq.m
supermarket. Construction is likely to proceed in late 2018, with completion scheduled
for 2021.
East Village, Bentleigh East
26
Assessment of retail potentialSection 3: Competition
Table 3.1
East Village - schedule of competing retail facilities
Bentleigh Bentleigh East McKinnon Village Ormond Carnegie
Anchors
• Discount department store Target Country
• Supermarket Woolworths Ritchies Supa IGA IGA Woolworths X2
Coles Aldi
Aldi
• Foodstore CK Foodstore
• Others Spotlight
Food
• Café 18 10 3 5 11
• Restaurant 15 9 3 8 33
- Chinese 3 5 1 12
- Korean 6
- Thai 2 1 1 3
- Japanese 3 2
- Indian 1 2 1 1
- Italian 1 1 1
- Mexican 2
- Other 4 1 6 8
• Takeaway food 18 6 2 11 9
• Fresh food 12 4 1 6
• Bakery 4 1 1 2 2
• Convenience 7 1 3
• Other 6 1 1 2
• Tobacconist 2 1 2
• Liquor 3 1 2 1
Total food 85 32 11 32 67
Non-food
• Womenswear 13 1 1 2 1
• Footwear 3 1 1
• Jewellery 1 2
• Other apparel 1 1 1
• Giftware 2 1 1
• Homewares/Furniture 3
• Newsagent/ stationery 3 1 1 1 1
• Electronics/Mobile phones 1
• Music/video rentals/ books 2
• Pharmacy 6 1 1 1
• Discount variety store 4
• Florist/toys 3 2 1
• Pet supplies/grooming 1 2 1
• Other
Total non-food 41 11 4 10 3
Retail services
• Hairdresser 5 6 3 6 1
• Beauty salon 8 8 1 3
• Optometrist 3 1 1 1
• Alterations/shoe repairs/Key cutting 2 2
• Drycleaners 1 2
Total retail services 19 19 4 10 2
Total retail 150 63 19 53 76
Source: MacroPlan Dimasi
East Village, Bentleigh East
27
Assessment of retail potentialSection 3: Competition
Table 3.1 (cont.)
East Village - schedule of competing retail facilities
Murrumbeena Murrumbeena Mackie Road Centre Road The Links SC
North South SC Bentleigh East and surrounds
Anchors
• Discount department store
• Supermarket
• Foodstore Foodworks IGA X-Press Independent Foodworks Woolworths
• Others
Food
• Café 4 1 1
• Restaurant 3 0 0 0 1
- Chinese 1 1
- Korean
- Thai 1
- Japanese
- Indian
- Italian
- Mexican
- Other 1
• Takeaway food 2 3 2 1 2
• Fresh food 1 2 1 1
• Bakery 1 1 1
• Convenience 1 1
• Other
• Tobacconist
• Liquor 1 1
Total food 13 4 7 3 5
Non-food
• Womenswear
• Footwear
• Jewellery
• Other apparel
• Giftware 1
• Homewares/Furniture
• Newsagent/ stationery 1 1 1 1
• Electronics/Mobile phones 1
• Electrical/computers 1
• Music/video rentals/ books
• Pharmacy 1 1 1 1 1
• Discount variety store 1
• Florist/toys 1
• Pet supplies/grooming
• Other
Total non-food 5 1 2 2 4
Retail services
• Hairdresser 4 1 1 1 1
• Beauty salon 1
• Optometrist
• Alterations/shoe repairs/Key cutting
• Drycleaners/Other 1 1
Total retail services 5 2 1 2 1
Total retail 24 8 11 8 11
Source: MacroPlan Dimasi
East Village, Bentleigh East
28
Assessment of retail potentialSection 3: Competition
3.3 Bulky goods
Map 3.1 illustrates the bulky goods facilities surrounding East Village, with the main points to
note, summarised as follows:
The nearest critical mass of bulky goods facilities are situated 5 km to the north at
Chadstone SC. The bulky goods offer situated within the enclosed centre is spatially ad
hoc and is generally scattered throughout. However, bulky goods retailers at the centre
such as Toys’ R Us, JB Hi-Fi and Matchbox generally have some crossover with traditional
retail. Situated in close proximity on Warrigal Road, the Chadstone Lifestyle Centre is
dedicated bulky goods precinct, accommodating a number of anchor large format
retailers such as Bunnings, Harvey Norman, Good Guys, Anaconda, Barbecues Galore,
Freedom and Snooze.
Situated approximately 7 km to the south-east, the Springvale Homemaker Centre is one
of the biggest large format retail centres in Melbourne, after Watergardens Town Centre.
The centre is anchored by the largest IKEA in the Southern Hemisphere when it opened in
2011, and also comprises a range of anchor large format tenants such as Anaconda,
Amart Furniture and Harvey Norman.
Moorabbin House and Home Centre is situated approximately 6 km south-west of East
Village and is a small bulky goods precinct with a general focus on bedding and furniture.
Some key retailers trading in these markets at the precinct include Bedshed, Freedom,
Snooze, Berkowitz, Nick Scali and Adriatic, while the centre also contains a Barbecues
Galore outlet.
East Village, Bentleigh East
29
Assessment of retail potentialMap 3.1: East Village Bulky goods competition
Section 3: Competition

3.4   Retail floorspace demand analysis

This section of the report outlines the expected demand for retail floorspace at the
East Village site. Modelling retail demand for a given area or centre is imprecise and depends
on a range of factors. Therefore, the floorspace demand analysis presented in this sub-
section should be viewed as indicative.

Table 3.2 details the total estimated amount of retail floorspace demand by residents in the
defined main trade area. This retail floorspace demand would be served by existing and
future retail facilities located within the trade area, as well as by major centres situated
beyond the trade area such as Bentleigh, Chadstone and Westfield Southland, amongst
many others.

The retail floorspace demand figures are calculated by applying an average Retail Turnover
Density (RTD) to the estimated available retail sales volume by category. The RTD is simply
the level of sales per sq.m which retailers in each category typically achieve. Adopted RTD
levels are the highest for food, liquor & groceries (FLG) retailers, including supermarkets, at
$9,000 per sq.m, and average around $6,500 per sq.m.

The figures illustrate that the retail floorspace demand of trade area residents will increase
by just over 20,000 sq.m over the forecast period to 2026. A proportion of this increase will
come from new residents within the East Village development, and future retail facilities at
East Village will be well placed to serve some of the increasing demand for retail floorspace
by trade area residents.

                                                                     East Village, Bentleigh East
                                                                                                       31
                                                                      Assessment of retail potential
Section 3: Competition
Table 3.2
East Village main trade area - Estimated retail floorspace demand (sq.m), 2017-2026
Year ending FLG Food Total Apparel H'hold Leisure General Retail Total Total
June catering food goods retail services non-food retail
2017 32,142 14,950 47,090 15,179 28,098 5,676 7,142 4,090 60,190 107,280
2018 32,628 15,254 47,880 15,333 28,454 5,734 7,213 4,152 60,890 108,770
2019 33,101 15,554 48,650 15,478 28,796 5,789 7,281 4,212 61,560 110,210
2020 33,581 15,860 49,440 15,625 29,143 5,844 7,350 4,274 62,240 111,680
2021 34,069 16,172 50,240 15,774 29,495 5,899 7,420 4,336 62,920 113,160
2022 34,756 16,576 51,330 16,012 30,020 5,989 7,533 4,424 63,980 115,310
2023 35,668 17,086 52,750 16,351 30,740 6,117 7,695 4,540 65,440 118,190
2024 36,623 17,621 54,240 16,706 31,494 6,251 7,864 4,661 66,980 121,220
2025 37,624 18,182 55,810 17,077 32,284 6,392 8,042 4,788 68,580 124,390
2026 38,672 18,771 57,440 17,466 33,112 6,539 8,228 4,922 70,270 127,710
RTD* 9,000 6,500 8,200 5,000 4,500 5,500 7,000 5,500 5,100 6,500
*Retail Turnover Density - Turnover ($) per sq.m in 2017, growth assumed at 0.8% p.a
Source: MarketInfo; MacroPlan Dimasi
A retail centre at the subject site will mostly serve the food and convenience needs of the
local residents, with the demand for retail floorspace driven primarily by the level of retail
sales which a future centre can reasonably expect to retain from the pool of expenditure
generated by the primary sector, and to a lesser extent, the secondary sectors.
Table 3.3 outlines the indicative amount of retail floorspace estimated to be supportable at
the East Village site over the forecast period (excluding large format retail). A neighbourhood
type centre at the subject site would serve mainly the food and convenience retail needs of
local residents and has the potential to retain a moderate proportion of the fresh food, take-
home liquor and grocery (FLG) spending of local residents, while it would retain lower
proportions of the other retail categories. The majority of non-food expenditure of trade
area residents is expected to continue to be directed to higher-order facilities in the
surrounding area.
The expected retention rates by retail category in the primary sector are estimated to range
from 27.5% of FLG expenditure to around 1 - 2% of apparel and household goods spend.
These retention rates take into account the proposed development at East Village as well as
East Village, Bentleigh East
32
Assessment of retail potentialSection 3: Competition
the provision of retail facilities in the surrounding area. In other words, primary sector
residents are estimated to direct 27.5% of their FLG spend to future retail facilities at East
Village, with 72.5% of their FLG spend expected to be directed to other retail facilities in the
area. These retention rates will be lower in the secondary sectors, reflecting the additional
shopping options available to these residents.
As an example, in 2022 the total FLG floorspace demand by all trade area residents is
estimated at 34,756 sq.m (refer Table 3.2). We expect that a neighbourhood centre at East
Village can retain some 15.3% of the FLG expenditure of trade area residents (refer
Table 3.3), and allowing for around 10% of sales to come from beyond the trade area, the
resultant indicative supportable amount of FLG floorspace at a future retail centre at East
Village is estimated at 5,845 sq.m in 2022. This level of retention is based on the typical
retention rates of shopping centres and is considered reasonable to ensure that future retail
facilities at the subject site would not have an undue impact on surrounding activity centres.
Across the total retail spectrum, the proportion of available retail expenditure expected to
be retained by a retail centre at the subject site is estimated at around 11.2% for the primary
sector and approximately 4% across the secondary sectors (with an average of some 6.2% for
the main trade area). This analysis indicated that around 7,500 sq.m to 9,000 sq.m of retail
floorspace is potentially supportable at the subject site in the medium term. I.e. in 2022 total
retail floorspace demand by main trade area residents is estimated at 115,300 sq.m as
detailed in Table 3.2, of which around 6% is expected to be able to be retained by a retail
centre at East Village, or approximately 7,880 sq.m after allowing around 10% of sales to be
captured from beyond the trade area.
East Village, Bentleigh East
33
Assessment of retail potentialSection 3: Competition
Table 3.3
East Village - Indicative supportable floorspace by category (sq.m), 2017-2026
Year ending FLG Food Total Apparel H'hold Leisure General Retail Total Total
June catering food goods retail services non-food retail
% retail expenditure retained
Primary 27.5% 7.5% 21.2% 2.0% 1.0% 7.5% 10.0% 8.0% 3.4% 11.2%
Secondary 10.0% 1.5% 7.2% 1.0% 0.5% 1.5% 5.0% 3.5% 1.5% 4.0%
Main TA 15.3% 3.2% 11.4% 1.3% 0.7% 3.3% 6.5% 4.9% 2.1% 6.2%
2017 5,362 527 5,890 216 201 206 511 217 1,350 7,240
2018 5,445 538 5,980 219 204 208 516 220 1,370 7,350
2019 5,527 549 6,080 221 206 210 521 224 1,380 7,460
2020 5,610 560 6,170 223 209 212 527 227 1,400 7,570
2021 5,694 571 6,270 225 211 215 532 230 1,410 7,680
2022 5,845 591 6,440 229 216 220 542 236 1,440 7,880
2023 6,070 621 6,690 236 223 229 558 245 1,490 8,180
2024 6,308 652 6,960 243 230 238 575 254 1,540 8,500
2025 6,559 686 7,240 251 238 248 593 263 1,590 8,830
2026 6,823 722 7,540 258 246 259 612 273 1,650 9,190
*Retail Turnover Density - Turnover ($) per sq.m in 2017, growth assumed at 0.8% p.a
Source: MarketInfo; MacroPlan Dimasi
East Village, Bentleigh East
34
Assessment of retail potentialSection 4: Assessment of retail potential
This section of the report provides an assessment of the amount and type of retail floorspace
considered suitable for the subject site.
The East Village site is well located at the intersection of North Road and East Boundary
Road, and is generally easily accessible from the surrounding region. The site is proposed to
accommodate a range of uses, and some 5,000 to 6,000 residents are planned to eventually
live at the planned apartments and townhouses on the subject site. The retail component at
East Village has the potential to serve the food and convenience retail needs of residents on
site, as well as other surrounding local residents. The subject site is also well suited to
provide a range of other uses such as non-retail and commercial facilities.
Some of the key considerations taking in account when assessing the potential for retail
facilities on the subject site include the following:
The location of the subject site on North Road, a key east-west traffic thoroughfare in the
surrounding area. The site is well located, ensuring that a future retail centre at East
Village will be easily accessible by local residents.
The available population within the main trade area defined for the East Village retail
centre, which is estimated to reach 50,000 residents by 2021, with close to
15,000 residents within the primary sector at that time.
The surrounding competition context, which includes a number of retail strip centres of
greatly varied sizes. It is worth noting that there are no supermarkets/foodstores over
500 sq.m in size within the primary sector, and no full scale supermarkets of at least
3,000 sq.m in size in the main trade area.
East Village, Bentleigh East
35
Assessment of retail potentialSection 4: Assessment of retail potential
Discount department store
There are no discount department stores (dds), i.e. Big W, Kmart and Target, located in the
trade area. The closest dds to the subject site are located at Chadstone to north (Kmart and
Target) and at Westfield Southland to the south, with includes all three major dds chains.
Throughout Greater Melbourne, as a rule of thumb, there is approximately one dds for every
40,000 – 45,000 residents. The population of the catchment is estimated to exceed
50,000 residents by 2021 and approach 60,000 by 2031. This level of population would
typically indicate that a dds would be supportable at the subject site.
However, while dds have been a popular retail format in the past, they have experienced a
tough trading environment over recent years and is one of the sectors most likely to be
vulnerable to digital disruption. The discretionary spending market has generally been in
decline over the past decade, particularly when compared to the food retail market. In
addition, growth in online retailing and the introduction of a range of international entrants
in the Australian market has put increasing pressure on the sales and profit performance of
dds. For example, the recent introduction of Amazon in Australia, whose offer and pricing
points was described as ‘patchy’ in its opening, contained many similar dds product lines at a
cheaper cost.
As a result, comparable store sales (sales minus incremental increases as a result of new
store openings) have been flat or in decline for a number of years. In FY17, sales for Big W
(-5.7%) and Target (-14.9%) fell, though Kmart is performing better and has recorded more
solid sales growth over recent years (4.2% growth in comparable sales for FY17). Big W and
Target are now only opening very few new stores, and it is considered highly unlikely that
Big W or Target would consider opening a store at East Village. Kmart is the only plausible
dds operator that would consider the site, though Kmart stores are already located at
Chadstone and Westfield Southland in the surrounding region.
East Village, Bentleigh East
36
Assessment of retail potentialYou can also read