Profiling Italian cat and dog owners' perceptions of pet food quality traits
←
→
Page content transcription
If your browser does not render page correctly, please read the page content below
Vinassa et al. BMC Veterinary Research   (2020) 16:131
https://doi.org/10.1186/s12917-020-02357-9

 RESEARCH ARTICLE                                                                                                                                    Open Access

Profiling Italian cat and dog owners’
perceptions of pet food quality traits
Marica Vinassa1,2*†, Diana Vergnano1†, Emanuela Valle1, Marzia Giribaldi3, Joana Nery1, Liviana Prola1,
Domenico Bergero1 and Achille Schiavone1

  Abstract
  Background: Over recent years, pet owners have started to demonstrate increased sensitivity toward their
  companion animals, which includes an increase in the attention paid towards their nutrition, seen as a way of
  safeguarding their pets’ welfare. The aim of this study was to identify how pet food quality traits are perceived as
  being the most important by dog and cat owners. To this end, a survey of dog and cat owners was conducted by
  means of a questionnaire distributed in pet stores and trade fairs throughout Italy.
  Results: A total of 935 surveys were collected; 61.8% of which were compiled by female pet owners. The
  respondents were relatively homogeneously distributed between cat (30.8%), dog (39.4%), and cat and dog (29.8%)
  owners. A quarter of the owners (25.5%) reported to have asked their veterinarian for advice on which pet food to
  buy, and almost a third (30.4%) trusted the advice posted on the web sites of well-known brands. “Contains natural
  ingredients” was the characteristic that obtained the highest mean score (4.3 out of 5).
  Elderly owners (> 65 years) placed most importance on whether a product had a high price, and least on feed
  appearance, animal satisfaction, and stool quality. Young owners (< 35y) paid most attention to the stool quality,
  the percentage of protein in the feed, and the presence of recyclable packaging, and least attention to feed
  appearance, smell, and animal satisfaction. Feed appearance, smell, a higher cost, and certain label indications
  (protein content, presence of fresh meat, grain free) were mostly important among the buyers of wet pet food.
  Some specific differences also emerged between dog, cat, and dog and cat owners.
  Conclusions: In this survey of Italian pet food buyers, the presence of “natural” ingredients was considered to be
  the most important indicator of pet food quality, whereas characterized by a high price was considered least
  important. The data obtained from this survey could be used to help pet food companies identify which pet food
  quality traits are perceived as important by dog and cat owners.
  Keywords: Pet food, Quality indicators, Survey, Perception of pet food

* Correspondence: marica.vinassa@unito.it
†
 Marica Vinassa and Diana Vergnano contributed equally to this work.
1
 Department of Veterinary Sciences, University of Turin, Largo Paolo Braccini
2, 10095 Grugliasco, TO, Italy
2
 CNR, University of Turin, Largo Paolo Braccini 2, 10095 Grugliasco, TO, Italy
Full list of author information is available at the end of the article

                                         © The Author(s). 2020 Open Access This article is licensed under a Creative Commons Attribution 4.0 International License,
                                         which permits use, sharing, adaptation, distribution and reproduction in any medium or format, as long as you give
                                         appropriate credit to the original author(s) and the source, provide a link to the Creative Commons licence, and indicate if
                                         changes were made. The images or other third party material in this article are included in the article's Creative Commons
                                         licence, unless indicated otherwise in a credit line to the material. If material is not included in the article's Creative Commons
                                         licence and your intended use is not permitted by statutory regulation or exceeds the permitted use, you will need to obtain
                                         permission directly from the copyright holder. To view a copy of this licence, visit http://creativecommons.org/licenses/by/4.0/.
                                         The Creative Commons Public Domain Dedication waiver (http://creativecommons.org/publicdomain/zero/1.0/) applies to the
                                         data made available in this article, unless otherwise stated in a credit line to the data.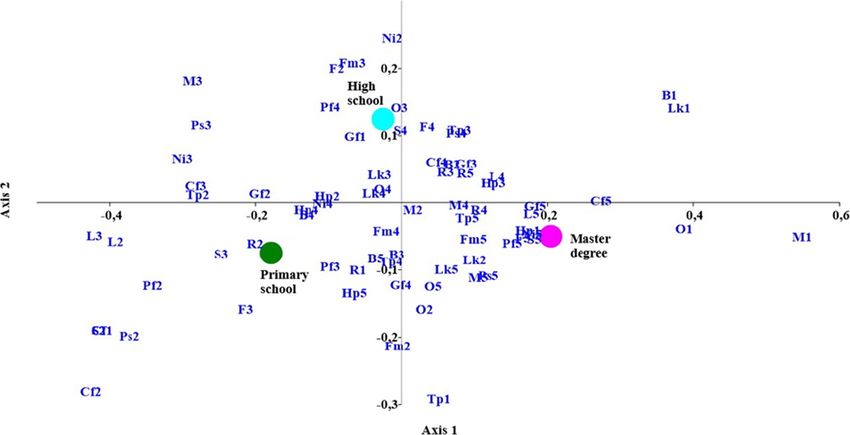
Vinassa et al. BMC Veterinary Research   (2020) 16:131                                                                       Page 2 of 10

Background                                                        Results
Around 39% of the population in Italy own at least one            A total of 972 questionnaires were distributed during
cat or dog [1], and over the last 10 years the dog and cat        the observation period; following the elimination of in-
feed market has shown significant positive growth [1].            complete questionnaires, 935 were left for analysis.
Furthermore, pet owners are becoming more sensitive to-             The socio-demographic characteristics of the surveyed
ward pet care issues [1], and nutrition is seen as a way of       pet owners are reported in Table 1. Sixty-one point 8 %
safeguarding their animals’ welfare. However, different pet       were women. The majority of questionnaires were com-
owners consider different and specific criteria they expect       pleted by people in work and with a medium-high level
the pet food to fulfill, which inevitably determine the diet      of education. Amongst half (49.5%) the tested population
choices they make for their pets. Nowadays, pet owners            was resident in the regions that make up Northern Italy
are more aware about the importance of the quality of             (Piedmont, Valle d’Aosta, Liguria, Lombardy, Trentino
their pets’ feeds and the ingredients they contain. Further-      Alto Adige, Veneto, Friuli-Venezia Giulia, and Emilia-
more, it is known that different social and cultural factors      Romagna), 34.4% were living in Central Italy (Tuscany,
can influence the decision-making processes underlying            Umbria, Marche, and Lazio), and 16.1% were from the
pet food purchasing, the same that govern consumer                South (Abruzzo, Molise, Campania, Puglia, Basilicata,
choices in relation to their own food purchasing habits.          and Calabria) or the Islands (Sicily and Sardinia). The
According to Michel et al. [2], wholesomeness, perceived          number of interviews conducted with cat (30.8%), dog
ingredient safety, and perceptions about nutritional value
are the major features that influence pet owner choices,          Table 1 Socio-demographic characteristics of the surveyed pet
together with their sources of information about pet nutri-       owner population
tion. In fact, pet food buyers have access to numerous            Characteristics                              n° and % of valid responses
sources of information about pet nutrition (veterinarians,        Gender                                       (n = 935)
the internet, animal trainers, pet shop employees, books            Women                                      61.8
on pet nutrition, pet nutrition company websites, other             Men                                        38.2
pet owners, etc.), even though this information may not
                                                                  Age                                          (n = 929)
always derive from reliable sources [3]. Some feed features
are perceived as positive and linked to health benefits,            18–34 years                                31.5
such as “organic” or “grain free”, whereas certain ingredi-         35–50 years                                38.6
ents, such as wheat and corn, sometimes may be consid-              51–64 years                                22.1
ered as negative features because they have been                    > 64 years                                 7.8
associated with the perception of being potentially harm-         Geographical area of residence               (n = 932)
ful [4]. Pet food producers take this information into ac-
                                                                    Northwest Italy                            29.0
count, and promote their products using claims such as
“cruelty-free”, “organic”, and “natural” [5, 6]. The quality        Northeast Italy                            20.5
of the complete commercial feed is cited as a contributing          Central Italy                              34.4
factor for longer and healthier lives in pets [7]. Further-         Southern Italy and the Islands             16.1
more, their use is widespread in developed countries, as it       Educational level                            (n = 893)
is in Italy [1], even though interest in alternative feeding        Primary / secondary school                 14.4
strategies are also on the rise [8–11].
                                                                    High school / professional qualification   58.1
   This growing trend to pay more attention to specific pet
food characteristics is affecting consumers‘purchasing              Degree / Master                            27.4
choices [6, 12], whose decisions are now influenced more          Occupation                                   (n = 931)
by the perceived quality than by price [6, 13]. According           Student                                    15.7
to Landes et al. [14], dog and cat owners prefer to spend           Housewife                                  8.8
more money to buy premium feeds rather than pet acces-              Retired                                    8.6
sories (e.g. toys, collars, etc.). The social and cultural fac-
                                                                    Worker                                     61.5
tors that influence pet owners’ own eating habits also
influence the decision-making processes underlying pet              Unemployed                                 3.1
food purchasing and pet feeding practices [15].                     Other                                      2.3
   The aim of the study was to identify which pet food qual-      Animal(s) owned (dogs and/or cats)           (n = 932)
ity traits are perceived as being the most important by dog         Dogs                                       39.4
and cat owners. To this end, a survey was developed to in-          Cats                                       30.8
vestigate the relevant habits and attitudes of dog and cat
                                                                    Dogs and cats                              29.8
owners when choosing and purchasing their pets’ food.
Vinassa et al. BMC Veterinary Research (2020) 16:131 Page 3 of 10
(39.4%) and cat and dog (29.8%) owners was quite evenly Multivariate correspondence analysis
distributed. Multivariate correspondence analyses were performed in
Some questions were used to profile the purchasing order to underline any relevant associations between
habits of the participants (Table 2). The majority (65.3%) specific population segments and important factors in
of the sampled population bought both dry and wet pet the decision-making process of pet food purchasing. The
food, whereas about 10% purchased wet pet food only. surveyed population was segmented according to age,
The preferred marketing channel of the tested popula- educational level, occupation, geographical provenance,
tion was a pet store (63.3%). About one quarter (25.5%) the type of pet food purchased, and the animal owned
of the interviewees had asked for advice from their vet- (dog or cat or both).
erinary about which pet food to purchase, and almost The results of segmentation according to age category
one-third (30.4%) relied on the information provided by are shown in Fig. 1. Elderly respondents (> 65 y) reported
major brands on their websites. a high price to be important to them when choosing pet
Table 3 reports the percentage of responses awarding food, whereas they attributed least importance to the use
each score value of the 1–5 Likert scale (where 1 = not im- of recyclable packaging and the presence of the “cruelty-
portant, and 5 = fundamental) in relation to each quality free” claim. Relatively little importance was also attributed
characteristic assessed and the average score considering by elderly people to certain aspects of label information,
the whole population. The claim “contains natural ingredi- such as label comprehension, location of the pet food pro-
ents” had the highest average score considering the re- duction facilities, and the presence of “natural” ingredi-
sponses from all interviewees, whereas the characteristic ents. Moreover stool quality was not considered as
“higher price than others” had the lowest average score, important by these respondents. On the other hand,
indicating that, in the surveyed population, purchasing de- young owners (< 35 y) placed most relevance on the ap-
cisions were not made on the basis of the product having pearance of the stools, a high percentage of proteins in the
a high price. pet food, and to the presence of recyclable packaging. Fur-
thermore, pet food appearance and smell were less rele-
vant as was consideration of their pet’s preference. The
Correlation analysis “cruelty-free” and the “grain-free” claims received on aver-
The correlation analysis showed that less than 50% of age higher scores for the population aged 35 to 50, who
correlations were relevant (Table 4). The location of also attributed a lot of importance on whether the pet
the pet food production facilities correlated with the food had a higher price than other products.
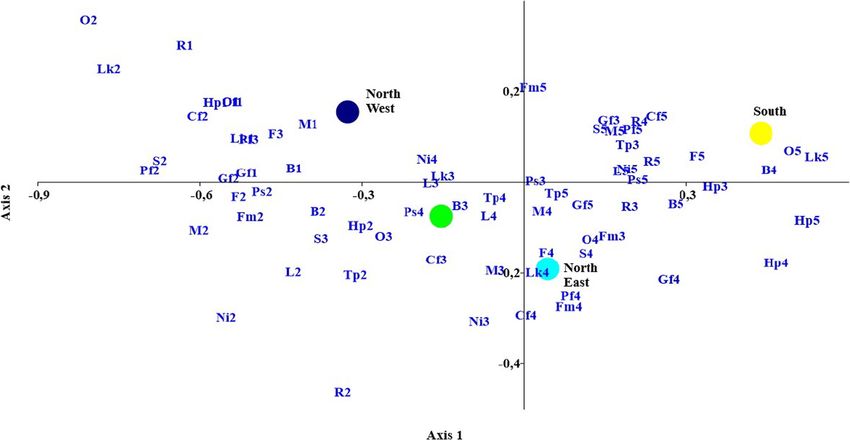
presence of specific information on the label (compre- The results of the education level segmentation are
hension of label R = 0.660; contains natural ingredi- given in Fig. 2. Pet owners with a higher educational
ents R = 0.584; cruelty-free R = 0.564). The importance level (degree/master) claimed to attribute little import-
placed on whether the food gave their pet a shiny ance to the smell and appearance of the pet food, a high
coat correlated with the importance placed on stool price, and to whether the brand is well-known, but they
appearance (R = 0.579); and the importance placed on declared to attribute a high level of importance to the
the pet’s preferences (i.e. palatability) correlated with appearance of their pet’s stools and coat. Label compre-
the importance placed on both shiny coat and stool hension, the location of production, the presence of nat-
appearance (R = 0.591 and R = 0.529, respectively). ural ingredients, and grain-free and cruelty-free claims
Consumer preference for the food being a well-known all received positive scores for this population segment.
brand correlated with importance attributed to a high Unlike the respondents with a degree, the segment of
price (R = 0.616). A correlation was also observed be- the population with only a primary-school level of
tween the importance of the food’s smell and its ap- education considered certain aspects of the label infor-
pearance (R = 0.761). mation (production site, protein percentage, and label
Table 2 Purchasing habits of the surveyed pet owners
Type of pet food purchased % Preferred marketing channel for the pet food % Prime source of nutritional advice used %
(n = 914) (n = 915) (n = 931)
Dry 24.7 Supermarket 15.8 Friends and relatives 13.0
Wet 10.0 Pet store 63.3 Online blog 9.8
Dry & wet 65.3 Online 6.6 Online website 30.4
More than one 14.3 Veterinarian 25.5
Other 6.7
More than one 14.7Vinassa et al. BMC Veterinary Research (2020) 16:131 Page 4 of 10
Table 3 Average relevance score of the surveyed quality characteristics of the chosen pet food
Characteristics Score (% for each category) Average score
(n = 935)
1 2 3 4 5
Contains natural ingredients 0.4 3.7 15.3 29.7 50.9 4.3
Location of pet food production facilities clearly labeled 0.9 3.8 16.8 31.0 47.5 4.2
Comprehension of the label 1.0 4.8 19.0 27.3 47.9 4.2
Pet’s preference (i.e. palatability) 0.3 2.7 18.5 32.5 46.0 4.2
Normal stool appearance 0.7 2.8 18.8 33.4 44.3 4.2
Contains fresh meat 1.5 6.0 21.5 27.1 43.9 4.1
Cruelty free 3.3 6.9 23.1 22.6 44.1 4.0
Produce shiny coat 1.0 5.0 22.7 35.5 35.8 4.0
Meat as the main ingredient 2.2 7.3 23.2 26.7 40.6 4.0
Good food smell 3.3 11.6 26.5 33.6 25.1 3.7
High protein content 1.3 8.5 28.7 37.9 23.5 3.7
Food appearance 4.3 10.8 29.0 31.5 24.4 3.6
Grain free 6.0 19.4 32.2 24.6 17.8 3.3
Recyclable packaging 13.9 18.3 24.5 22.0 21.3 3.2
Known brand 12.0 20.3 28.8 25.3 13.5 3.1
Higher price than other products 24.1 27.6 26.9 13.7 7.7 2.5
(1 = not important, 5 = fundamental)
comprehension) as less relevant. The presence of a focused more on the presence of meat as the main in-
cruelty-free claim did not constitute a decisional factor gredient and on a healthy stool appearance.
for this population segment. A healthy stool and coat
appearance was highly relevant for the interviewees with Discussion
high school or professional qualifications, together with Even though the survey was only administered in pet
the presence of recyclable packaging. stores and trade fairs, thereby neglecting some pet food
Those working from home and housewives paid more sectors (i.e. e-commerce, hypermarkets, supermarkets
attention to cruelty-free and grain-free claims. Label and discount stores), it was possible to highlight the
comprehension, feed smell and appearance, pet prefer- main quality indicators Italian pet owners bear in mind
ences, coat quality, and stool appearance were all rated when they choose their pet food. In this study, the pet
by students as being of little importance. Given that our owners were divided according to whether they owned a
findings were based on an unbalanced number of house- dog, a cat or both (39.4, 30.8, and 29.8%, respectively).
wives and students with respect to workers, the results These data corroborate the national report [1], a higher
from these analyses should be treated with considerable percentage of dog owners (27.1%) than cat owners
caution. (18.3%) have been found in Italian citizen. Of all respon-
The results from the segmentation according to the dents, 61.8% were women, confirming the trend revealed
macroscopic regions of the Italian peninsula are reported in a 2019 Italian study [16].
in Fig. 3. It should be noted that the scores assigned by Our survey data reveal a higher incidence of pet stores
respondents in Southern Italy and the islands were al- as the “preferred shopping channel” (63.3%), but our
ways higher than those for the rest of Italy, whereas data should only be considered as partial since the sur-
lower scores were selected in Northwest Italy. The mean vey was conducted in pet stores and trade fairs. In 2019,
score assigned to the importance of a high price was ap- Assalco-Zoomark [1] reported that the majority of pet
proximately 50% higher in Southern Italy compared with food was bought in supermarkets (63.6% of all pur-
Northwest Italy. chases, considering hypermarkets, supermarkets and dis-
The appearance, smell, higher cost, and some label in- count stores), whereas little over a quarter was bought
dications (high protein content, meat as the main ingre- in pet stores (26.3%).
dient, grain free) were scored as being more relevant by When assessing the quality of pet food, the Italian
wet pet food buyers. Cat owners attributed more import- buyers in this study considered the presence of “natural”
ance to the appearance and smell of the pet food, but ingredients as the most important aspect (average score:
less to recyclable packaging, whereas dog owners 4.3). This may reflect the current trends also observed inTable 4 Correlation coefficients between quality characteristics scored by the surveyed population
Vinassa et al. BMC Veterinary Research
Preference Shiny Stool Food Food Location of pet Cruelty-free Comprehensive Natural Meat main Fresh Total Grain Well-known High
coat smell appearance food production label ingredients ingredient meat protein % free brand price
facilities
Recyclable 0.302 0.297 0.324 0.256 0.228 0.359 0.428 0.414 0.373 0.209 0.209 0.233 0.430 0.305 0.416
High price 0.103 ns 0.218 0.101 ns 0.372 0.411 0.159 0.205 0.183 0.190 0.260 0.122 ns 0.228 0.447 0.616
Well-known brand 0.168 0.177 0.085 ns 0.328 0.367 0.111 ns 0.139 ns 0.126 0.148 0.227 0.194 0.300 0.365
(2020) 16:131
Grain free 0.256 0.372 0.311 0.379 0.382 0.372 0.414 0.371 0.396 0.373 0.304 0.396
High protein % 0.211 0.205 0.249 0.181 0.247 0.331 0.175 0.326 0.345 0.402 0.511
Fresh meat 0.237 0.184 0.302 0.197 0.233 0.398 0.263 0.390 0.480 0.649
Meat main ingredient 0.205 0.250 0.301 0.271 0.285 0.378 0.310 0.435 0.521
Natural ingredients 0.310 0.284 0.384 0.216 0.219 0.584 0.508 0.670
Comprehensive label 0.341 0.344 0.462 0.241 0.262 0.660 0.643
Cruelty-free 0.361 0.396 0.459 0.339 0.352 0.564
Location of pet food 0.331 0.377 0.494 0.305 0.338
production facilities
Food appearance 0.373 0.459 0.338 0.761
Food smell 0.426 0.524 0.403
Stool appearance 0.529 0.579
Shiny coat 0.591
ns: non significant correlation. Bold values are considered to be relevantly correlated (> 0.5)
Page 5 of 10Vinassa et al. BMC Veterinary Research (2020) 16:131 Page 6 of 10 Fig. 1 Results from multivariate correspondence analysis of the segmentation as per age class. Legends: Pf1-Pf5: pet preference (i.e. palatability); F1-F5: produces shiny coat; S1-S5: normal stool appearance; O1-O5: food smell; Lk1-Lk5: feed appearance; Ps1-Ps5: manufacturing facilities location; Cf1-Cf5: cruelty-free; L1-L5: label comprehension; Ni1-Ni5: presence of natural ingredients; M1-M5: meat as main ingredient; Fm1-Fm5: contained fresh meat; Tp1-Tp5: high protein content; Gf1-Gf5: grain free; B1-B5: well-known brand; Hp1-Hp5: higher price than others; R1-R5: recyclable packaging. Age classes: 18–34 y; 35–50 y; 51–64 y; > 64 y Fig. 2 Results from multivariate correspondence analysis of the segmentation as per educational level. Legends: Pf1-Pf5: pet preference (i.e. palatability); F1-F5: produces a shiny coat; S1-S5: normal stool appearance; O1-O5: food smell; Lk1-Lk5: feed appearance; Ps1-Ps5: manufacturing facilities location; Cf1-Cf5: cruelty-free; L1-L5: label comprehension; Ni1-Ni5: presence of natural ingredients; M1-M5: meat as main ingredient; Fm1-Fm5: contains fresh meat; Tp1-Tp5: high protein content; Gf1-Gf5: grain free; B1-B5: well-known brand; Hp1-Hp5: higher price than others; R1-R5: recyclable packaging. Master’s degree: degree/specialization; High school: high school/professional qualification; Primary school: primary/secondary school
Vinassa et al. BMC Veterinary Research      (2020) 16:131                                                                                 Page 7 of 10

 Fig. 3 Results from multivariate correspondence analysis of the segmentation according to the macroscopic regions of the Italian peninsula.
 Legends: Pf1-Pf5: pet preference (i.e. palatability); F1-F5: produces a shiny coat; S1-S5: normal stool appearance; O1-O5: food smell; Lk1-Lk5: feed
 appearance; Ps1-Ps5: manufacturing facilities location; Cf1-Cf5: cruelty-free; L1-L5: label comprehension; Ni1-Ni5: presence of natural ingredients;
 M1-M5: meat as main ingredient; Fm1-Fm5: contains fresh meat; Tp1-Tp5: high protein content; Gf1-Gf5: grain free; B1-B5: well-known brand; Hp1-
 Hp5: higher price than others; R1-R5: recyclable packaging. North West: Northwest Italy (Piedmont, Valle d’Aosta, Liguria, Lombardy); North East:
 Northeast Italy (Trentino Alto Adige, Veneto, Friuli-Venezia Giulia, Emilia-Romagna); Center: Central Italy (Tuscany, Umbria, Marche, Lazio); South:
 Southern Italy (Abruzzo, Molise, Campania, Puglia, Basilicata, Calabria) and islands (Sicily, Sardinia)

relation to human nutrition, where demand is increasing                      by the Italian pet owners interviewed. The average score
for a more “natural” diet [17]. Thus, pet food is becom-                     of this feature was one of the lowest at 3.3. Other low-
ing more “humanized”, and so follows human food pref-                        scoring characteristics were the presence of recyclable
erences and purchasing habits. The feed types chosen                         packaging (average score: 3.2) and the importance of a
for pets are likely to reflect the relationship that has de-                 brand being well-known (average score: 3.1). According
veloped between the person and their animals. It could                       to Italian buyers, when considering a range of products
even be considered as symbolic of the pet’s inclusion                        (i.e. products with similar characteristics), a higher price
into the owner’s family and reflect the pet owner’s cul-                     (average score: 2.5) was the least important parameter.
ture or ideology. In fact, a recent study that investigated                     Around a quarter of the interviewees (25.5%) asked
the relationship between children and household pets,                        their veterinarians for advice about the choice of pet
70.7% of the interviewed families considered the family                      food, suggesting the important role of veterinarians in
pet as the child’s playmate [18]. Furthermore, some pet                      the decision-making process of pet food purchasing.
owners believe that choosing “natural” ingredients posi-                     This result confirms the findings of a previous study
tively contributes to the health of their pets [15].                         [20] in which veterinarians were the most frequent
   Other characteristics rated by the sample population                      source used to obtain information about pet nutrition.
as being important were: the location of the pet food                        However, nearly a third of the interviewees (30.4%) re-
production facilities (average score: 4.2), and the infor-                   ported to trust the details provided by pet food compan-
mation provided on the label and its comprehension                           ies on their respective websites, suggesting that the pet
(average score: 4.2). The correlation analysis also re-                      food industry also plays an important role in the
vealed a link between these two aspects.                                     provision of information to consumers. In a study con-
   Another current trend in pet food marketing is the de-                    ducted in the United States and in Australia [20] on the
velopment of “grain free” products. According to                             attitudes of owners toward pet food, it was shown that a
Laflamme et al. [19], cereals in pet food may give rise to                   significant proportion of pet owners (15.8% of dog
food adverse reactions. However, according to our sur-                       owners and 16.9% of cat owners) used the internet and
vey, this characteristic was not deemed a major priority                     other media as their primary sources of information.
Vinassa et al. BMC Veterinary Research   (2020) 16:131                                                         Page 8 of 10

  The terminology “cruelty-free” is another aspect that       human food. It was interesting that the elderly people in
should be taken into consideration, even though there         our study seemed to behave in the same way as those in
are still some concerns about its definition. When talk-      the human study by Mascarello et al. [23], in which they
ing about ingredients in cosmetic products, the United        place less importance on nutritional aspects and more
States Food and Drug Administration [21] considers            importance on marketing aspects. In that study [23], it
“cruelty-free” products to infer that they have not been      was found that elderly people were most interested in
tested on animals. The tendency of pet owners to buy          buying certified and local food products.
feeds that have not been tested on laboratory animals,          The present study also reveals the respondents’ educa-
commonly referred to as “cruelty-free” feed, is spreading     tional level to be associated with which pet food traits they
in Italy. This aspect was perceived as being very import-     perceive as being the most important. Similarly, in a hu-
ant to the Italian interviewees (average score: 4.0). It is   man study, it was also reported that differences in the
an aspect that the media and public opinions are focus-       educational level of mothers were linked to differences in
ing on; however, the term is not yet regulated by any         the eating habits of their children (the consumption of soft
specific legislation. Updating the legislation in reference   drinks, sweets, fruit and vegetables) [24].
to this topic therefore poses an important issue and            When the data were segmented according to pet spe-
could be a possible perspective for the Italian and Euro-     cies, it resulted that cat owners were more interested in
pean legislative bodies.                                      the features characterizing the pet food’s external ap-
  Other concerns revealed as important pertain to the         pearance. In fact, cats are notoriously fussy when it
comprehension of the label, shown to be one of the fac-       comes to what they will eat, and cat owners know that
tors most important to the interviewees (average score:       pet food palatability is strongly influenced by both the
4.2). However, it is important that the label should not      smell and appearance (i.e. texture), as well as feed taste.
mislead with regard to the feed’s use consumers, as           On the contrary, dog owners express more interest on
clearly stated in Reg. (EC) No. 767/2009 on the placing       the nutritional composition of the feed, mainly on the
of feed on the market and their use, as pointed out by        quantity of protein, perhaps because of the common
FEDIAF (European Pet Food Industry Federation), which         opinion that a dog’s diet should reflect the dog’s evolu-
developed the Code of Good Labeling Practices [22]. Al-       tion from the ancestral wolf. A healthy stool appearance
though Reg. (EC) No. 767/2009, which addresses on pla-        scored high among dog owners. Indeed, stool
cing feeds onto the market and their use within the           consistency problems are common in dogs, especially
European Community, already includes general require-         large dogs [25]. However, further information on the size
ments for labelling. It could be a further step forward if    of the respondents’ dogs would be necessary to under-
the general requirements for labelling would be imple-        stand whether a correlation existed between dog size
mented for specific aspects, especially claims.               and the importance attributed to stool consistency when
  A distinction between two large categories of pet           purchasing dog food.
owners emerged from the correlation analysis. Inter-
viewees that placed great importance on pet palatability      Conclusion
preferences also paid attention to the appearance of their    To the best of our knowledge, this study provides the
animal’s coat and stools. On the other hand, the inter-       first data on the decision-making processes of Italian pet
viewees interested in well-known brands also reported         owners when purchasing commercial pet food. The fea-
to pay attention to the price and external characteristics    ture rated by the Italian pet food buyers as being the
of the feeds (such as its appearance and the smell).          most important quality indicator was the presence of
  This study also revealed differences in how pet food        “natural” ingredients, whereas least importance was
quality is perceived that depended on the age of the in-      attributed to whether products cost more others. Fur-
terviewees. For example, elderly people did not tend to       thermore, our results highlight that the interviewees pre-
consider the use of recyclable packaging as important,        ferred to ask their veterinarians for advice on pet food
which was deemed important to young pet owners (< 35          or to consult the websites of specific brands, which were
y), which may reflect a greater level of awareness of en-     rated almost equally. Of the investigated parameters
vironmental impacts in this age group. Furthermore, of        rated as most important to pet owners, some were
all the items considered, elderly interviewees placed         linked to indicators of animal welfare (such as a shiny
most importance on whether a product cost more than           coat, normal stool appearance, and palatability). Some
other products, whereas they paid least attention to label    pet food quality parameters tended to be perceived dif-
information; on the other hand, the young interviewees        ferently depending on whether the respondent was a dog
(< 35 y) were most interested in the information written      or cat owner. Furthermore, the pet owner decision-
on the label. According to Mascarello et al. [23], age also   making process was strongly influenced by their level of
influences the evaluation of the perceived quality of         education.
Vinassa et al. BMC Veterinary Research   (2020) 16:131                                                                        Page 9 of 10

  In conclusion, the obtained data here may be helpful        important at all, 2 = not very important, 3 = quite import-
to identify the factors that influence the perceptions of     ant, 4 = very important, and 5 = fundamental) on the rele-
dog and cat owners regarding the quality of animal feed       vance of 16 specific quality-associated characteristics in
products.                                                     the decision-making process of choosing pet food. The
                                                              surveyed characteristics included pet preferences, coat and
Methods                                                       stool appearance, food smell and presentation, label infor-
The survey (see Additional file 1 to view the English ver-    mation, location of pet food facilities, ingredients, brand,
sion) was designed to investigate the relevant habits and     price, recyclable packaging, and cruelty-free claim.
attitudes of dog and cat owners when choosing and pur-
chasing pet food.                                             Statistical analyses
  No approval by an institutional review board was re-        The choice of the statistical analyses that were per-
quired because enrollment was on a voluntary basis and        formed was made on the basis of the surveys designed
the participants consented to anonymous data collec-          by [23, 26]. The data generated were submitted to ex-
tion. In addition, the questionnaires were blinded prior      ploratory, correlation, and correspondence analyses. The
to statistical analysis, which was performed independ-        exploratory analysis provided a description of the sample
ently by a specialist on a database containing summa-         interviewed through frequency analysis, the use of syn-
rized data.                                                   thetic indicators (median, mean, coefficient of variation),
                                                              and the cross tabulation of specific variables in order to
Respondents                                                   identify the main differences between the consumer
The survey was designed and administered by trained           groups. Bonferroni’s corrected Spearman Rho Correl-
staff over a period of 9 months, from March to Novem-         ation analyses were carried out in order to highlight
ber, 2018.                                                    highly or poorly connected features. A strong correlation
  People were contacted directly by representatives pro-      was detected for a correlation coefficient R > ±0.5 and a
moting the survey in pet stores and trade fairs across        weak correlation for a R < ±0.2. Finally, profiling of the
Italy. The survey participants filled out the paper-format    respondents, according to the clusters of interest (age,
questionnaire and immediately returned it to the study        education, occupation, geographical origin, type of pet
representative. The sample consisted of 935 returned          food, dog and/or cat ownership) was achieved using a
questionnaires compiled by an equal number of cat/dog         multivariate correspondence analysis approach between
owners from across Italy. A pilot version of the ques-        the scores and specific population segments. To this
tionnaire had been presented to 100 people prior to con-      end, the data were first converted to Dummy variables,
ducting the survey in order to ascertain whether it was       then grouped into specific Burt tables (one table for each
easy to understand.                                           target profiling feature), which were subsequently used
                                                              for a multivariate correspondence analysis. When a spe-
Structure of the questionnaire                                cific preference class was poorly represented (less than
The questions selected for the survey were based on           10 cases), the cases were assigned to the adjacent prefer-
those already present in the literature; in particular,       ence class. The relative weight of each class of prefer-
those reported by Mascarello et al. [23]. Each question       ence was standardized by considering its percentage
was developed with the assistance of experts (a veterin-      occurrence in each specific population segment. All the
arian, a nutritionist and a marketing research specialist)    analyses were performed using PAST version 2.3 [27].
in order to gather relevant information from owners
about the target topics.                                      Supplementary information
  Ten questions, divided into two sections, were in-          Supplementary information accompanies this paper at https://doi.org/10.
cluded in the survey. The first section, containing 9         1186/s12917-020-02357-9.
multiple-choice questions, was designed to profile the
population sample. The demographic variables included          Additional file 1. Questionnaire: how is pet food quality assessed? In
                                                               this file the questionnaire used during the survey is reported, translated
in the profiling were: gender, age, geographical area of       in English language.
residence (see Additional file 2), education, and occupa-      Additional file 2. Map of Italy. Map of Italy and segmentation in North,
tion. Additional variables were included to profile the in-    Center, South and Islands. Source: own source.
terviewees in terms of pet food purchasing attitudes
(type(s) of animal owned, preferred marketing channel,        Abbreviations
type of purchased pet food, sources of pet nutrition          FEDIAF: European Pet Food Industry Federation; y: years; Reg. (EC)
                                                              No.: Regulation of the European Community number
information).
  In the second part, the pet owners were asked to express    Acknowledgements
their opinion using a 5-point scoring system (1 = not         Not applicable.
Vinassa et al. BMC Veterinary Research (2020) 16:131 Page 10 of 10
Authors’ contributions 7. Kraft W. Geriatrics in canine and feline internal medicine. Eur J Med Res.
MV: data collection, support of data analysis and preparation of manuscript. 1998;3:31–41 http://www.ncbi.nlm.nih.gov/pubmed/9512965. Accessed 3
DV: data collection, support of data analysis and preparation of manuscript. Oct 2019.
EV: coordination and preparation of manuscript. MG: data management and 8. Handl S. The barf trend advantages, Drawbacks and Risks. Vet Focus. 2014;24:
data analysis. JN: data management, planning of the study. LP: data 16–23 https://www.scribd.com/document/381885688/Articulo-de-Royal-Canin-
management, planning of the study. DB: data management, planning of the The-Barf-Trend-Advantages-Drawbacks-and-Risks. Accessed 17 May 2019.
study. AS: planning of the study, preparation of manuscript. All authors have 9. van Bree FPJ, Bokken GCAM, Mineur R, Franssen F, Opsteegh M, van der
read and approved the final manuscript. Giessen JWB, et al. Zoonotic bacteria and parasites found in raw meat-
based diets for cats and dogs. Vet Rec. 2018;182:50. https://doi.org/10.1136/
vr.104535.
Funding
10. Waters A. Raw diets: are we at a turning point? Vet Rec. 2017;181:384.2–384.
This research was funded by Natural Line SRL, Via Mazzini 26, 54027
https://doi.org/10.1136/vr.j4709.
Pontremoli (MS) Italy (funding 2018: SCHA_CT_RIC_18_02). The funding body
11. Freeman LM, Chandler ML, Hamper BA, et al. J Am Vet Med Assoc. 2013;
approved the proposed study design, data collection and analysis.
243:1549–58.
12. Boya UO, Dotson MJ, Hyatt EM. Dimensions of the dog–human relationship:
Availability of data and materials a segmentation approach. J Targeting Meas Anal Mark. 2012;20:133–43.
The datasets analysed during this study are available from the corresponding https://doi.org/10.1057/jt.2012.8.
author on reasonable request. 13. Pask E, Scott L. Feeding Fido: How to really read a dog food label. 2012.
https://moderndogmagazine.com/articles/feeding-fido/4870. Accessed 28
Ethics approval and consent to participate May 2019.
No ethics approval process by an institutional review board within national 14. Landes L. Pet Ownership: A Financial and Emotional Responsibility •
or European legal systems was needed for the present procedure as Consumerism Commentary. 20/06/2018. 2010. https://www.
enrolment onto the survey was on a voluntary basis and the participants consumerismcommentary.com/pet-ownership-a-financial-and-emotional-
consented verbally to participate in the anonymous data collection as per responsibility/. Accessed 28 May 2019.
Regulation (EU) N. 2016/679 of the European parliament and of the council 15. Michel KE. Unconventional Diets for Dogs and Cats. Vet Clin North Am Small
of 27 April 2016. Data were directly collected from pet owners who were Anim Pract. 2006;36:1269–81. https://doi.org/10.1016/j.cvsm.2006.08.003.
contacted directly by front desk personnel in the pet stores. These personnel 16. Morelli G, Bastianello S, Catellani P, Ricci R. Raw meat-based diets for dogs:
explained the aim of the questionnaire and collected the participants’ survey of owners’ motivations, attitudes and practices. BMC Vet Res. 2019;
consent. The interviewees agreed to participate in the study voluntarily by 15:74. https://doi.org/10.1186/s12917-019-1824-x.
self-enrolling. They were informed that their answers would be published in 17. Nie C, Zepeda L. Lifestyle segmentation of US food shoppers to examine
a study. No animals were involved in the study. organic and local food consumption. Appetite. 2011;57:28–37. https://doi.
org/10.1016/j.appet.2011.03.012.
18. Russo N, Vergnano D, Bergero D, Prola L. Small pilot survey on parents’
Consent for publication perception of the relationship between children and pets. Vet Sci. 2017;4:1–
All participants consented to anonymous data collection as per the Italian 5. https://doi.org/10.3390/vetsci4040052.
Data Protection Code - Legislative Decree N. 196/2003. The interviewees 19. Laflamme D, Izquierdo O, Eirmann L, Binder S. Myths and misperceptions
agreed to participate in the study voluntarily by self-enrolling. They were in- about ingredients used in commercial pet foods. Vet Clin North Am Small
formed that their answers would be published in a study. Anim Pract. 2014;44:689–98, v. https://doi.org/10.1016/j.cvsm.2014.03.002.
20. Laflamme DP, Abood SK, Fascetti AJ, Fleeman LM, Freeman LM, Michel KE,
Competing interests et al. Pet feeding practices of dog and cat owners in the United States and
The authors declare that they have no competing interests. Australia. J Am Vet Med Assoc. 2008;232:687–94. https://doi.org/10.2460/
javma.232.5.687.
Author details 21. U.S. Food & Drug. “Cruelty Free”/“Not Tested on Animals”. 2017. https://
1
Department of Veterinary Sciences, University of Turin, Largo Paolo Braccini www.fda.gov/cosmetics/cosmetics-labeling-claims/cruelty-freenot-tested-
2, 10095 Grugliasco, TO, Italy. 2CNR, University of Turin, Largo Paolo Braccini animals. Accessed 28 May 2019.
2, 10095 Grugliasco, TO, Italy. 3Research Centre for Engineering and 22. European Pet Food Industry Federation (FEDIAF). Code of Good Labelling
Agro-Food Processing, CREA, Strada delle cacce, 73, 10135 Turin, Italy. Practice for Pet Food; 2018. p. 1–63.
23. Mascarello G, Pinto A, Parise N, Crovato S, Ravarotto L. The perception of
Received: 28 November 2019 Accepted: 4 May 2020 food quality. Profiling Italian consumers. Appetite. 2015;89:175–82. https://
doi.org/10.1016/j.appet.2015.02.014.
24. Vereecken CA, Keukelier E, Maes L. Influence of mother’s educational level
on food parenting practices and food habits of young children. Appetite.
References 2004;43:93–103. https://doi.org/10.1016/J.APPET.2004.04.002.
1. Assalco-Zoomark. Alimentazione e cura degli animali da compagnia. 25. Hernot DC, Biourge VC, Martin LJ, Dumon HJ, Nguyen PG. Relationship
Bologna. 2019. http://www.assalco.it/showattach.php?nid=8040. Accessed between total transit time and faecal quality in adult dogs differing in body
28 May 2019. size. J Anim Physiol Anim Nutr (Berl). 2005;89:189–93. https://doi.org/10.
2. Michel KE, Willoughby KN, Abood SK, Fascetti AJ, Fleeman LM, Freeman LM, 1111/j.1439-0396.2005.00544.x.
et al. Attitudes of owners towards pet foods. Timely Top Nutr. 2008;233:1–5. 26. Montouto-Grana M, Cabanas-Arias S, Porto-Fojo S, Vazquez-Odériz ML,
https://doi.org/10.2460/javma.233.11.1699. Romero-Rodriguez MA. Sensory characteristics and consumer acceptance
3. Suarez L, Peña C, Carretón E, Juste MC, Bautista-Castaño I, Montoya-Alonso and purchase intention toward fresh-cut potatoes. J food Sci. 2012;71.
JA. Preferences of owners of overweight dogs when buying commercial https://doi.org/10.1111/j.1750-3841.2011.02453.x.
pet food. J Anim Physiol Anim Nutr (Berl). 2012;96:663–7. https://doi.org/10. 27. Hammer Ø, Harper DAT, Ryan PD. PAST: paleontological statistics software
1111/j.1439-0396.2011.01193.x. package for education an data analysis. Palaeontol Electron. 2001;4:1–9.
4. Contreras S. The dog food project - ingredients to avoid. 2007. http://www.
dogfoodproject.com/index.php?page=badingredients. Accessed 28 May
2019. Publisher’s Note
5. Bohrer T. Pet Food Packaging: Evolution, Revolution & Innovation - Paper, Springer Nature remains neutral with regard to jurisdictional claims in
Film & Foil Converter. 19/08/2011. 2011. https://www.pffc-online.com/ published maps and institutional affiliations.
flexpack/9770-pet-food-evolution-0819. Accessed 28 May 2019.
6. Boya UO, Dotson MJ, Hyatt EM. A comparison of dog food choice criteria
across dog owner segments: an exploratory study. Int J Consum Stud. 2015;
39:74–82. https://doi.org/10.1111/ijcs.12145.You can also read