Towards the Direct Detection of Viral Materials at the Surface of Protective Face Masks via Infrared Spectroscopy - Research Square
←
→
Page content transcription
If your browser does not render page correctly, please read the page content below
Towards the Direct Detection of Viral Materials at the Surface of Protective Face Masks via Infrared Spectroscopy Vanessa Schorer Ulm University Julian Haas Hahn-Schickard https://orcid.org/0000-0001-9378-8922 Robert Stach Hahn-Schickard Vjekoslav Kokoric Hahn-Schickard Rüdiger Groß Ulm University Medical Center https://orcid.org/0000-0003-0355-7915 Jan Münch University of Ulm https://orcid.org/0000-0001-7316-7141 Tim Hummel Boehringer Ingelheim Therapeutics GmbH vormals Labor Dr. Merk & Kollegen GmbH Harald Sobek Labor Dr. Merk & Kollegen GmbH Jan Mennig Labor Dr. Merk & Kollegen GmbH Boris Mizaikoff ( boris.mizaikoff@uni-ulm.de ) Ulm University https://orcid.org/0000-0002-5583-7962 Article Keywords: Transmission Chains, Acute Respiratory Infections, Direct Virus Detection, Multivariate Statistical Algorithms, Large-scale Monitoring Routine Posted Date: June 28th, 2021 DOI: https://doi.org/10.21203/rs.3.rs-644857/v1 License: This work is licensed under a Creative Commons Attribution 4.0 International License. Read Full License
Towards the Direct Detection of Viral Materials at the Surface of
Protective Face Masks via Infrared Spectroscopy
Vanessa Schorer, a Julian Haas, b Robert Stach, b Vjekoslav Kokoric, b Rüdiger Groß, c Jan Münch, c
Tim Hummel, d,e Harald Sobek, d Jan Mennig, d and Boris Mizaikoff a,b *
a. Institute of Analytical and Bioanalytical Chemistry, Ulm University, Albert-Einstein-Allee 11, 89081 Ulm, Germany.
b. Hahn-Schickard, Sedanstraße 14, 89077 Ulm, Germany.
c. Institute of Molecular Virology, Ulm University, Meyerhofstr. 1, 89081 Ulm, Germany.

d. Labor Dr. Merk & Kollegen GmbH, Beim Braunland 1, 88416

   Ochsenhausen
e. Present address: Boehringer Ingelheim Therapeutics GmbH, Beim Braunland 1, 88416 Ochsenhausen
* boris.mizaikoff@uni-ulm.de
The ongoing COVID-19 pandemic represents a considerable risk for the general public and especially for health care workers.
To avoid an overloading of the health care system and to control transmission chains, the development of rapid and cost-
effective techniques allowing for the reliable diagnosis of individuals with acute respiratory infections are crucial. Uniquely,
the present study focuses on a direct face mask sampling approach, as worn (i.e., used) disposable face masks contain
exogenous environmental constituents, as well as endogenously exhaled breath aerosols. Optical techniques – and specifically
infrared (IR) molecular spectroscopic techniques - are promising tools for direct virus detection at the surface of such masks.
In the present study, a rapid and non-destructive approach for monitoring exposure scenarios via medical face masks using
attenuated total reflection infrared spectroscopy is presented. Complementarily, IR external reflection spectroscopy was
evaluated in comparison for rapid mask analysis. The utility of a face mask-based sampling approach was demonstrated by
differentiating water, proteins, and virus-like particles sampled onto the mask. Data analysis using multivariate statistical
algorithms enabled unambiguously classifying spectral signatures of individual components and biospecies. This approach
readily extends towards the rapid detection of SARS-CoV-2 – as shown herein for the example of virus-like particles which
are morphologically equivalent to authentic virus - without any additional sample preparation or elaborate testing equipment
at laboratory facilities. Therefore, this strategy may be implemented as a routine large-scale monitoring routine, e.g., at health
care institutions, nursing homes, etc. ensuring the health and safety of medical personnel.

     Introduction                                                   several steps, which are in part time-consuming and require
                                                                    a laboratory environment, dedicated equipment, and
  For over a year now, the Covid-19 pandemic has been               extensive human labor.3 The development and approval of
affecting the daily lives of people around the world. In            rapid antigen tests allows for a more rapid detection of
March 2020 the World Health Organization (WHO) has                  infectious individuals (approx. 15 min), and may
declared the outbreak of the severe acute respiratory               advantageously be performed outside dedicated
syndrome coronavirus type 2 (SARS-CoV-2) a global                   laboratories.4 However, these tests are mainly based on
pandemic.1 Since then, millions of people were infected and         nasopharyngeal swabs, which still requires adequate
nearly all countries fight against the virus by slowing the         sample collection routines, and may cause discomfort of
spread of the virus, and thus, avoiding overwhelmed health          patients.5–10 In addition, using self-collected anterior nasal
systems. These measures involve strategies to detect and            and saliva specimens are therefore favorable, as the risk for
stop known chains of transmission. Therefore, the rapid,            healthcare workers is minimized due to maintaining
reliable, and direct detection of SARS-CoV-2 is of particular       physical distancing.5,7,10 Saliva collection is usually
importance for mitigating infection spreading. Evidently,           conducted via a cotton pad device, i.e., ‘lollipop-technique’
there is a distinct demand for testing/screening methods            or by spitting into a sterile tube.6,9,10 The use of self-collected
identifying individuals with acute respiratory infections, or       saliva samples is certainly a convenient alternative for
that have been exposed to respiratory viruses. To date, the         swab-based molecular tests, yet, still requires dedicated
gold standard for clinical diagnosis are assays based on            testing equipment, i.e., cups and solvents.9,10 To address the
detection of viral RNA, mainly reverse-transcriptase                direct need for increased routine testing and large-scale
polymerase chain reaction (RT-PCR) based methods.2 Such             monitoring, the present study focus on direct optical read-
nucleic acid tests provide high sensitivity and specificity,        out techniques, and specifically mid-infrared (MIR)
but also have several drawbacks. The workflow for RT-PCR            spectroscopy operating in the 3-12 µm spectral regime,
tests with a duration of nowadays around 40 min includes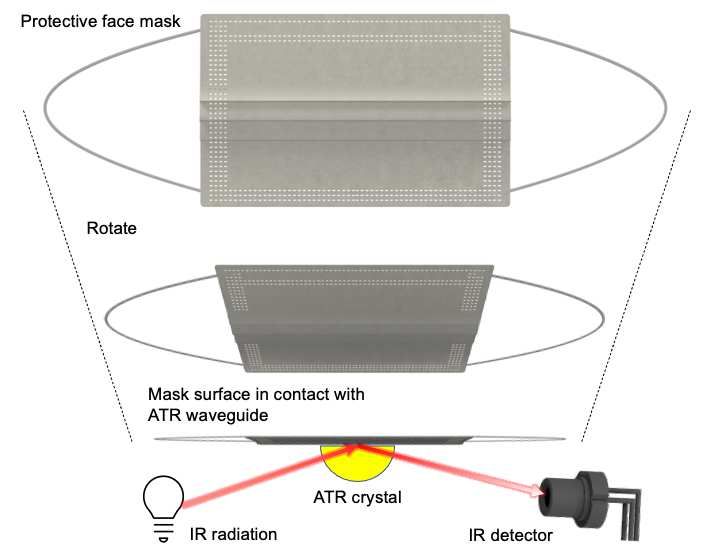
which holds promise for the development of a rapid and spectroscopy is nowadays considered a routine tool for
non-invasive SARS-CoV-2 detection strategy. Herein, we studying protein structure,20 especially IR-ATR techniques
demonstrated an approach to better understand and enable the analysis of otherwise opaque samples (Figure
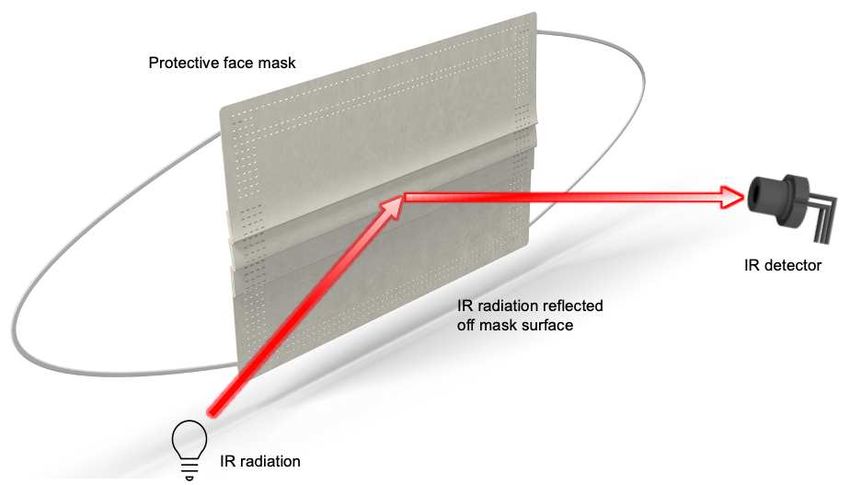
potentially prevent or reduce exposure to viral respiratory 1A).22 Alternatively and if a sufficient signal strength may be
infections such as SARS-CoV-2. obtained, IR- ER - whereby IR radiation is reflected off the
Intriguingly, molecular exposure information is being external surface of a sample (Figure 1B) - may be applied,
produced worldwide but has been widely neglected to date. e.g., for direct particle analysis at a filter surface.23–25 Using
As the pandemic spreads, surgical and/or protective masks multivariate statistics, minute spectral differences may be
are increasingly being worn to prevent infection. Precisely evaluated rather than focusing on identifying the spectral
these protective masks and the contaminants characteristics of individual molecules, thereby enabling
filtered/trapped therein including viruses present the classification of contaminants at the surface of
significant potential for virus detection via protective face masks.
preconcentration at the surface of the mask material. A
Surgical masks are typically made of non-woven, i.e., blown
or spun polypropylene fabric, and typically comprise three
layers.11–13 Few analyses of masks have been performed
focusing on the evaluation of exhaled breath aerosols
(EBA).14,15 However, most applied analytical techniques
require extensive analytical equipment and labor. Hu et al.
presented an approach, which was based on direct analysis
via real-time mass spectrometry (DART-MS). In this study,
a solid phase microextraction (SPME) fiber was inserted
into a face mask for collecting EBA. While this essentially
represents a non-invasive approach for characterization
human exhaled breath, still additional sampling via SPME
and analysis using DART-MS is needed.16 Analytical
procedures classifying surgical face masks without any
sample preparation remain rare.16–19
Staff in hospitals or clinics, nursing homes and
paramedics are subject to a significant risk of infection or B
contagion demanding for the particularly rapid and reliable
detection of SARS-CoV-2, or other pathogens. Within this
study, first promising results of directly using face masks as
‘sampling tool’ in combination with attenuated total
reflection (ATR) and external reflection (ER) infrared
spectroscopy are shown indicating the potential of this
strategy via directly detecting and discriminating model
analytes including bovine serum albumin (BSA), SARS-CoV-
2 virus-like particles (VLPs), and adeno associated virus
type 2 (AAVs) based on chemometric classification of the
directly obtained IR spectra.
Treating protective face masks as ‘sampling device’, the
detection of SARS-CoV-2 is envisioned in a cost-effective
way and without requiring any laboratory facilities. Low- Figure 1 Schematic illustration of A) attenuated total reflection
cost automated IR spectrometers combined with the (ATR), and B) external reflection (ER) infrared spectroscopy.20
developed multivariate data evaluation approach may be The utility of IR spectroscopy in combination with
integrated into a fully automated screening routine. Thus, multivariate data analysis derives from the fact that any
testing in mass screening scenarios may be envisaged broadband IR spectrum is composed of a series of
similar to ion-mobility spectrometry (IMS) based safety characteristic absorption peaks spread along a
routines implemented at airport security checkpoints. wavenumber axis ideally suited for analysis via
Infrared spectroscopy has matured into one of the most unsupervised methods. Principal components analysis
relevant analytical techniques, as it is non-destructive yet (PCA) followed by principal components regression (PCR)
provides molecular information on a wide range of organic is among the most commonly applied multivariate
and inorganic species. The absorption of IR light excites algorithms projecting variances contained within the data
vibrational, rotational, and ro-vibrational transition within set onto a small number of Eigenvectors (i.e., principal
molecules depending on the respective phase, i.e., solid, components; PCs) with the aim of reducing
liquid, or gaseous. Thus, obtained spectra enable identifying dimensionality.26 Conversely, partial least squares (PLS)
chemical and structural characteristics essentially regression is a method related to PCA, yet besides fulfilling
‘fingerprinting’ any molecular species. Likewise, all the criterion that a PC should describe the maximum
biomolecules and even entire biological specimen absorb IR residual variance simultaneously relates the latent
radiation providing potential for pinpointing biomaterials variables to the dependent variables in an optimized way.
including, e.g., virus containing aerosols.21 While IR PLS in combination with linear classification methods
2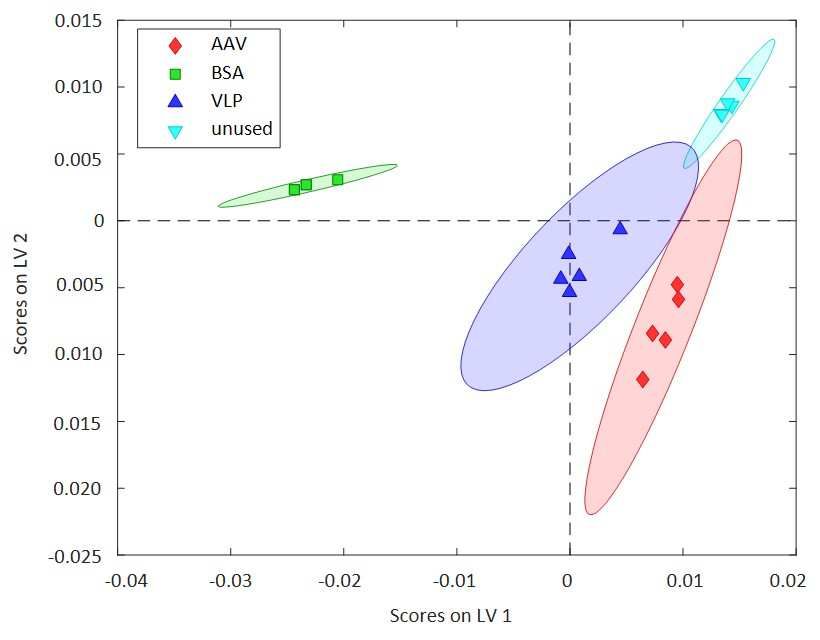
yields so-called PLS-based linear discriminant analysis evanescent field. For ER studies, the samples were pressed
routines (PLS-DA).27 While it should be noted that even evenly towards the aperture of the ER accessory. In both
those rather simple linear multivariate data evaluation cases, no additional sample preparation was done. For each
routines yielded excellent results in the present case, it is measurement, IR spectral data in the range of 4000 cm-1 to
not excluded that currently thriving non-linear algorithms 400 cm-1 was collected averaging 128 scans per spectrum at
as used in artificial intelligence, machine learning, etc. such a spectral resolution of 2 cm-1. Figure 2 shows exemplary
as support vector machines (SVMs) and others may be IR-ATR spectra of untreated masks, masks sprayed with
applied as well, albeit usually requiring much more H20, and masks sprayed with BSA solutions without any
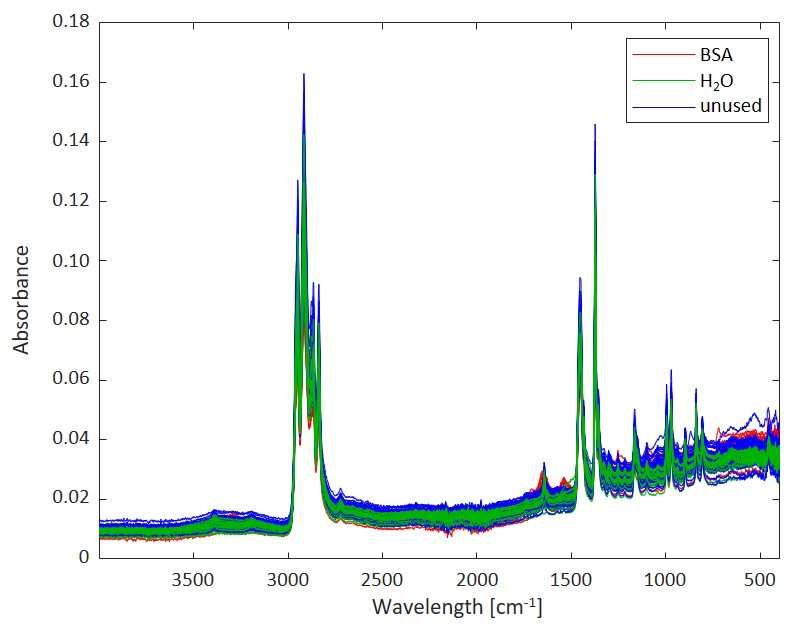
expanded trainings data sets.28 data processing (i.e., raw data), respectively. Five repeat
A main advantage of multivariate data mining and measurements were performed using air as the background
classification techniques is the fact that the data spectrum prior to the acquisition of each sample spectrum.
evaluation/classification may be fully automated, i.e., For cleaning the ATR crystal after each measurement,
provides classification data for any end-user without a isopropyl alcohol (propan-2-ol, IPA) was used.
priori knowledge on the actual measurement routine. While
internally a variety of species including molecules, particles
and viruses may be detected at the mask surface and could
be further analyzed by experts, an end-user may simply be
issued a yes/no decision on whether SARS-CoV-2 has been
exhaled by an infection person, or whether a healthy person
has been exposed to the virus over extended periods during
inhalation when wearing a protective face mask as to
identify potentially critical exposure scenarios.
The present study aims at a first step towards developing
such decision-making models based on surrogate samples
and applying IR spectroscopic techniques in combination
with PCA and PLS-DA as chemometric data evaluation tools.
Materials and methods
Samples and chemicals
For the experiments, conventional surgical face masks
were used. The face masks were all fabricated by the same Figure 2 Exemplary characteristic evanescent field absorbance
manufacturer (Voin) in line with the European standard EN spectra of protective face masks obtained via IR-ATR
14683 for medical use. These masks are three-layered spectroscopy. Unused masks (blue), masks sprayed with BSA
disposable face masks consisting of polypropylene (PP). (red), and masks sprayed with water (green).
The two outside layers are non-woven; the intermediate
layer was a double layer of melt-blown filter paper. Water
(H2O), BSA, AAVs and SARS-CoV-2 VLPs were applied to the Data processing
mask surface by spray or drop casting at the outside/inside After spectral data acquisition, pre-processing of the
emulating deposition after inhalation/exhalation, spectra was performed for extracting the relevant
respectively. Prior to the experiments, crystalline powder information.26,29 The IR spectra were analyzed using
of BSA was dissolved in H2O (0.5% solution). The SARS-CoV- MATLAB (Release 2020a, MathWorks, Natick, USA) with the
2 VLPs were generated by transient transfection of PLS toolbox 8.7 (Eigenvector Research Inc., Manson, USA).
plasmids expressing all viral structural proteins in Typically, a variety of pre-processing steps are used to
HEK293T cells, purified by OptiPrep gradient remove unwanted variance (i.e., variance not characteristic
ultracentrifugation, and characterized by nanoparticle for the target analytes) from individual samples and
tracking analysis. numerically prepare data for modelling.21 In all models
AAVs were purchased at Vigene Biosciences (Rockville, described below, baseline correction, i.e., weighted least
USA) as standard reference material. squares automatic baseline removal (AWLS, order = 2), and
After the deposition of H2O, BSA, AAVs or VLPs, the masks normalization (i.e., 1-norm/standard normal variate) were
were dried for two hours prior to any measurements. For used to improve the signal-to-noise ratio (SNR) of the data
all experiments ultra-pure water was used (resistivity and to adjust the baseline. In addition, applying the
18.2 MΩ at 25 °C; Millipore). 1st derivative Savitzky-Golay filter (filter parameters: order
= 2, window: 15 pt) as well as mean centering were used for
Instrumentation pre-processing the spectra aiming at a possibly robust
A portable FT-IR spectrometer (Alpha II HR; Bruker model. For proteins, characteristic spectral bands are
Optics, Ettlingen, Germany) was utilized for all located in the ‘fingerprint region’ (i.e., 1800 cm-1 to
measurements using a single-reflection ATR and an ER 600 cm-1), thus, spectral region selection was performed
assembly, respectively. For ATR spectroscopy, the masks accordingly.22
were placed onto the diamond ATR element, and a pressure For the established classification models, the number of
applicator ensured intimate contact between the mask latent variables (LVs) varies between two and three as
surface and the crystal ensuring efficient probing via the selected by evaluating the root mean square error of
3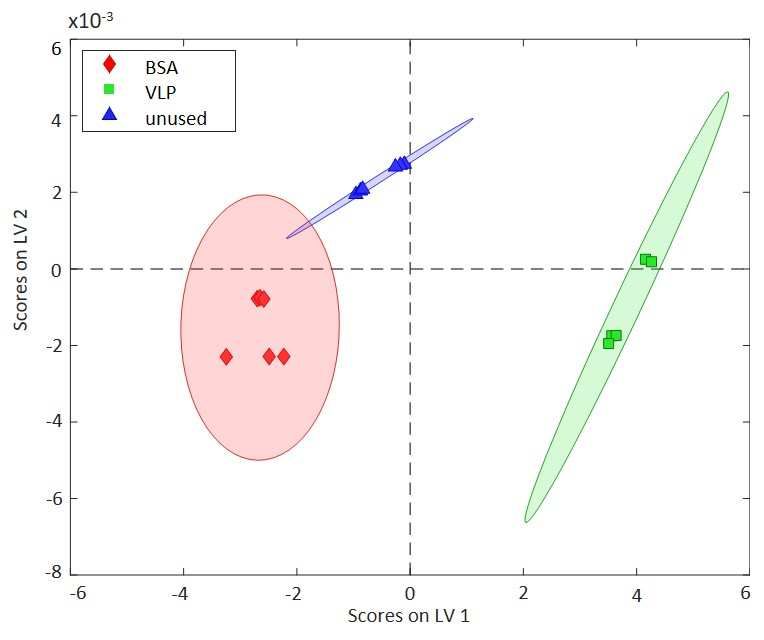
calibration (RMSEC) and the root mean square error of                matrix. Even if PP has a low permeability compared to other
cross-validation (RMSECV) vs. the number of LVs, which               polymers, their results have indicated molecular
yields an optimum number of LVs yet effectively prevents             interactions between water molecules and the polymer
from modeling noise. Cross-validation (CV) was performed             matrix. The corresponding analysis of the obtained IR-ATR
with 10 splits divided by the venetian blinds method using           spectra in the present studies verified these findings via the
a blind magnitude of 1. The most effective model was                 O-H bending vibration in the range 1750-1540 cm-1.31 These
selected based on an optimum in sensitivity, specificity, and        results indicate that residual water may be readily detected
a minimum CV error by modifying data pre-processing and              in surgical mask materials, even after a considerable drying
considering only the fingerprint region (1800-600 cm-1).             time (here, 2 hours). In Figure 3, a minor overlap of
                                                                     confidence ellipses (95%) is evident, which is attributed to
   Results and discussion                                            the spectral similarity of neat water to the H2O bending
 As already briefly described, data pre-processing was               vibration in BSA, as it has been dissolved in aqueous
applied to the raw data prior to modelling for ensuring              solution.
optimum classification and model performance. All samples
were evaluated using PCA and PLS-DA applied separately to            Table 1 Calibration and classification statistics of the
both IR-ATR and IR-ER data.                                          calculated PLS-DA models based on IR-ATR spectra.
IR-ATR analysis of protective face masks                                     Analyte         RMSEC      RMSECV     R2 Cal   R2 CV
                                                                             H2O/BSA (Num. of LVs: 2)
                                                                                 H2O         0.2169     0.2659     0.8117   0.7192
                                                                                  BSA        0.2169     0.2659     0.8117   0.7192
                                                                             BSA/VLP/unused/AAV (Num. of LVs: 3)
                                                                      ATR
                                                                                  BSA        0.0339     0.0420     0.9939   0.9906
                                                                                  VLP        0.0480     0.0641     0.9877   0.9781
                                                                                unused       0.0975     0.1223     0.9493   0.9209
                                                                                  AAV        0.0987     0.1245     0.9480   0.9180
                                                                             BSA/VLP/unused (Num. of LVs: 2)
                                                                                  BSA        0.1326     0.1530     0.9230   0.8990
                                                                      ER
                                                                                  VLP        0.0961     0.1194     0.9555   0.9315
                                                                                unused       0.1688     0.1961     0.8752   0.8327

                                                                       In a next set of experiments, the classification of unused
                                                                     masks vs. masks exposed to VLPs, AAV, and BSA was
                                                                     evaluated.
Figure 3 Scores plot of a PLS-DA evaluation at differently treated
mask samples (i.e., contaminated with H2O and BSA). The two
classes are well separated using two LVs based on the IR-ATR
data set.
  In a first set of experiments, masks sprayed with H2O and
BSA were compared by using both PCA and PLS-DA. The
scores were used to cluster the obtained data. While the
obtained RMSEC value provides information on how well
the model fits data, the RMSECV determines the ability of
the model predicting unknown samples that were not used
to build the model. By plotting the RMSEC/RMESCV vs. the
number of latent variables, two LVs were selected covering
47.65% of the total variance maximizing the predictive
performance of the model and suppressing interferences.
  Table 1 summarizes the obtained classification results
along with their statistical characterization for all
generated PLS-DA models. The coefficient of determination
(R2) values for calibration and CV verifies a high predictive
accuracy of the generated model, as both values are >0.7. As         Figure 4 Scores plot of PLS-DA evaluation comparing four classes
shown in Figure 3, the PLS-DA model classifies the masks             of face masks via IR-ATR spectroscopy. The model covers 98.90%
according to the exemplary analytes H2O and BSA. The                 of total variance and is based on three LVs. Unambiguous
loadings on LV 1 and LV 2 describe the characteristic H2O            classification of differently contaminated protective face masks
bending vibration around 1640-1670 cm-1 (see SI Figure 1).           also vs. untreated masks is clearly evident.
Previous publications have investigated water dispersion
and diffusion into polypropylene (PP) films.30,31 Shen et al.          The resulting PLS-DA model was built using three LVs
determined the presence of water molecules within the PP             following the optimum RMSECV value. Consequently, a
                                                                                                                                     4
RMSEC within 0.0339 and 0.0987, and a RMSECV within masks in combination with multivariate data classification
0.0420 and 0.1245 was derived. For BSA, exceedingly high routines for discriminating a variety of relevant biological
R2 values were obtained ensuring unambiguous species including virus surrogates.
identification (see Figure SI 2A).
As shown in Figure 4, BSA widely separates from the VLP
and AAV clusters along LV 1, which captures 77.99% of the
variance. Evaluating the loadings of LV 1 in more detail, it is
evident that wavelengths in the range of the water
signature are apparent. These loadings indicate that
structural changes of sprayed BSA at and/or within the PP
matrix may be detected via direct IR-ATR spectroscopy (see
SI Figure 3). Likewise, the classification and the
corresponding R2 values for the classes VLP and AAV
indicate superior predictive accuracy ranging from 0.9180
to 0.9877, yet, minutely poorer class statistics compared to
BSA (see Figure SI 2B). Evidently, the data points of these
two classes are spaced wider apart within the scores plot
(see Figure 4) indicating a reduced correlation between
different spots analyzed at the mask surface. In addition, it
should be noted that indeed only a few microliters of each
solution were deposited onto the masks, thus, some
analyzed spots may also include uncontaminated mask
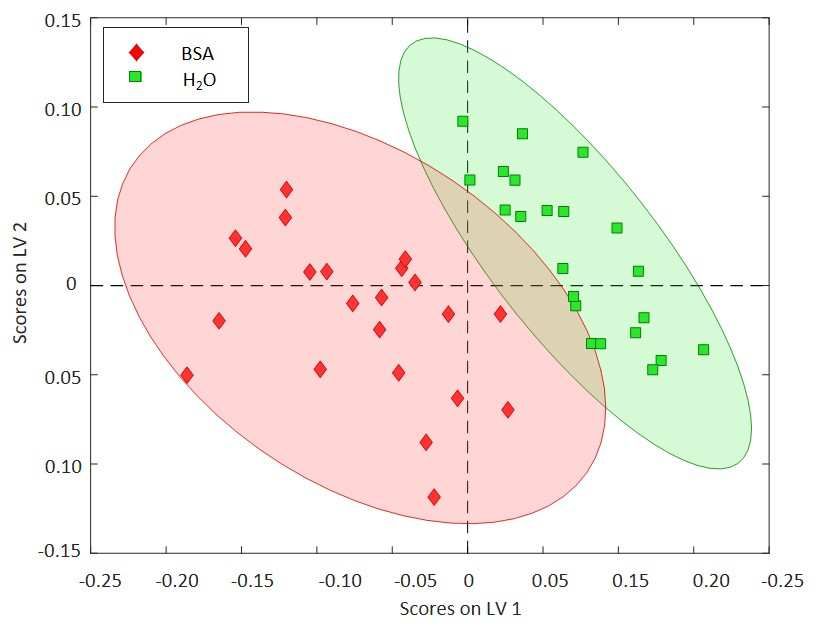
areas. Noteworthy, a clearly evident differentiation on LV 1
compared to BSA and on LV 2 discriminating unused masks Figure 5 Scores plot of PLS-DA evaluation of three different
was obtained (see SI Figure 2B). The loadings of both LV 1 classes of contaminated protective face masks analyzed via IR-
and LV 2 evidence strong peaks around 1375 cm-1, which ER spectroscopy. The classification results confirm unambiguous
are attributed to the characteristic spectrum of PP masks differentiation of the contaminants.
(see Figure SI 3).32 These findings suggest that the sprayed-
on proteins may cause minute changes of the polymer Conclusions
spectrum. Most importantly, the PLS-DA model facilitates In this study, it was demonstrated that IR spectroscopy
an excellent differentiation of used vs. unused masks, and in combined with multivariate data analysis provides true
addition, classifies proteins vs. virus surrogates based on potential for the classification of disposable protective face
rather minimal differences in IR spectral signatures. masks and therein trapped contaminants. Minimal spectral
Consequently, 98.90% of the total variance across all cases differences enable virus detection – and potentially
studied herein may be captured via only three LVs, which discrimination – at worn protective face masks, as shown
confirms that indeed IR-ATR spectroscopy may extract for surrogate virus examples (i.e., AAV and VLPs). Especially
unique spectral features associated within the molecular for health care workers and first responders these masks
structure of contaminants at used protective face masks. are part of the personal protective equipment, and thus, no
IR- ER analysis of protective face masks additional sampling is required for testing. When compared
to other testing routines, most are designed for single usage.
In a final set of experiments, the obtained IR-ATR results
Using face masks as a readily available ‘sampling device’
were compared to – and verified by – external reflection
offers an innovative approach for rapidly testing exposure
measurements. All data were again baseline corrected,
of clinical staff toward relevant pathogens. On top of that,
normalized, and mean-centered as previously described.
using IR spectroscopy in ATR or ER mode provides an
The scores plot in Figure 5 shows that the three classes are
affordable, portable and reusable tool for routing screening
clearly discriminated by 95% confidence ellipses based on
at a large scale. Together, the proposed strategy devises the
two latent variables. These two LVs were selected covering
first monitoring routine for respiratory viral pathogens that
92.72% of the total variance. Importantly, even BSA and
does not require additional sampling procedures,
VLPs were unambiguously classified with R2 values
essentially produces no additional waste, and does not
conforming satisfying predictive accuracy (i.e., average
require trained personnel. Since wearing protective face
values >0.85). More precisely, with a high percentage of
masks has nowadays become routine during respiratory
68.55% scores along LV 1 predominantly contribute to the
disease season, this approach is clearly suitable for
explanation of the overall variance, thereby indicating
detecting other infectious diseases of the respiratory tract
excellent discrimination vs. unused masks (see Figure SI 4).
as well. In a next step, the preliminary results presented in
Noteworthy, in comparison to IR-ATR measurements, IR-
this highly actual study will be verified in both, clinical and
ER provides an even more convenient direct measurement
non-clinical studies investigating extended test groups.
procedure. The considerably larger measurement spot
Cross-contamination as well as exposure in real world
(spot diameter approx. 12 mm in ER vs. approx. 400 µm in
scenarios must be evaluated in detail vs. the first insight
ATR mode, respectively) covers a more representative
generated herein using representative surrogate samples.
mask area, and the mask simply needs to be held against the
In summary, the development of optical sensing
aperture. Yet, IR-ATR data provided slightly more
technologies appears a viable strategy for virus exposure or
discriminatory power. Nonetheless, both methods revealed
exhalation detection that should be expanded also into
the potential of direct IR spectroscopy at protective face
other spectral regimes. Finally, using ubiquitously available
5used protective face masks one may convert a largely publication of the Infectious Diseases Society of America [Online
overlooked ‘sampling tool’ into a valuable dosimeter-type early access]. DOI: 10.1093/cid/ciaa1156. Published Online: Aug. 6,
monitoring device that may mitigate several drawbacks of 2020.
(11) Leonas, K. K.; Jones, C. R. The Relationship of Fabric
conventional rapid antigen testing routines, especially in
Properties and Bacterial Filtration Efficiency for Selected Surgical
professional application scenarios. Face Masks. Journal of Textile and Apparel, Technology and
Management 2003.
(12) Chen, C.-C.; Willeke, K. Aerosol penetration through surgical
AUTHOR INFORMATION masks. American Journal of Infection Control 1992, 20, 177–184.
(13) Tcharkhtchi, A.; Abbasnezhad, N.; Zarbini Seydani, M.; Zirak,
Corresponding Author N.; Farzaneh, S.; Shirinbayan, M. An overview of filtration efficiency
through the masks: Mechanisms of the aerosols penetration.
* Prof. Dr. Boris Mizaikoff, Ulm University, Institute of
Bioactive Materials 2021, 6, 106–122.
Analytical and Bioanalytical Chemistry, 89069 Ulm, Germany. (14) Milton, D. K.; Fabian, M. P.; Cowling, B. J.; Grantham, M. L.;
Author Contributions McDevitt, J. J. Influenza virus aerosols in human exhaled breath:
particle size, culturability, and effect of surgical masks. PLoS
All authors have given approval to the final version of the pathogens 2013, 9, e1003205.
manuscript. (15) Nikitin, N.; Petrova, E.; Trifonova, E.; Karpova, O. Influenza
virus aerosols in the air and their infectiousness. Advances in
ACKNOWLEDGMENT virology 2014, 2014, 859090.
(16) Yuan, Z.-C.; Li, W.; Wu, L.; Huang, D.; Wu, M.; Hu, B. Solid-
We are grateful for the support of this project by the Phase Microextraction Fiber in Face Mask for in Vivo Sampling and
Ministerium für Wissenschaft, Forschung und Kunst (MKW) Direct Mass Spectrometry Analysis of Exhaled Breath Aerosol.
Baden-Württemberg, Germany under the Program “Special Analytical chemistry 2020, 92, 11543–11547.
Measures against the SARS-CoV-2 Pandemic”. (17) Wallace, M. A. G.; Pleil, J. D.; Madden, M. C. Identifying
organic compounds in exhaled breath aerosol: Non-invasive
REFERENCES sampling from respirator surfaces and disposable hospital masks.
(1) World Health Organization. Coronavirus disease 2019 Journal of Aerosol Science 2019, 137, 105444.
(COVID-19): Situation Report - 51, 2020. (18) Williams, C. M.; Abdulwhhab, M.; Birring, S. S.; Kock, E. de;
(2) Eis-Hübinger, A. M.; Hönemann, M.; Wenzel, J. J.; Berger, A.; Garton, N. J.; Townsend, E.; Pareek, M.; Al-Taie, A.; Pan, J.; Ganatra,
Widera, M.; Schmidt, B.; Aldabbagh, S.; Marx, B.; Streeck, H.; Ciesek, R.; et al. Exhaled Mycobacterium tuberculosis output and detection
S.; et al. Ad hoc laboratory-based surveillance of SARS-CoV-2 by real- of subclinical disease by face-mask sampling: prospective
time RT-PCR using minipools of RNA prepared from routine observational studies. The Lancet Infectious Diseases, 20(5), 607-
respiratory samples. Journal of clinical virology: the official 617. The Lancet Infectious Diseases 2020, 20, 607–617.
publication of the Pan American Society for Clinical Virology 2020, (19) Kanaujia, R.; Biswal, M.; Angrup, A.; Ray, P. Inhale, then
127, 104381. exhale: start afresh to diagnose Severe Acute Respiratory Syndrome
(3) Esbin, M. N.; Whitney, O. N.; Chong, S.; Maurer, A.; Darzacq, X.; Coronavirus 2 (SARS-CoV-2) by non-invasive face-mask sampling
Tjian, R. Overcoming the bottleneck to widespread testing: a rapid technique. Clinical Microbiology and Infection [Online early access].
review of nucleic acid testing approaches for COVID-19 detection. DOI: 10.1016/j.cmi.2020.06.034.
RNA (New York, N.Y.) 2020, 26, 771–783. (20) Barth, A. Infrared spectroscopy of proteins. Biochimica et
(4) Krüttgen, A.; Cornelissen, C. G.; Dreher, M.; Hornef, M. W.; biophysica acta 2007, 1767, 1073–1101.
Imöhl, M.; Kleines, M. Comparison of the SARS-CoV-2 Rapid antigen (21) Santos, M. C.; Morais, C. L.; Lima, K. M. ATR-FTIR
test to the real star Sars-CoV-2 RT PCR kit. Journal of virological spectroscopy for virus identification: A powerful alternative. BSI
methods 2021, 288, 114024. 2020, 9, 103–118.
(5) Azzi, L.; Carcano, G.; Gianfagna, F.; Grossi, P.; Gasperina, D. D.; (22) Glassford, S. E.; Byrne, B.; Kazarian, S. G. Recent applications
Genoni, A.; Fasano, M.; Sessa, F.; Tettamanti, L.; Carinci, F.; et al. of ATR FTIR spectroscopy and imaging to proteins. Biochimica et
Saliva is a reliable tool to detect SARS-CoV-2. The Journal of infection biophysica acta 2013, 1834, 2849–2858.
2020, 81, e45-e50. (23) Walker, R.; Cauda, E.; Chubb, L.; Krebs, P.; Stach, R.;
(6) Braz-Silva, P. H.; Mamana, A. C.; Romano, C. M.; Felix, A. C.; Mizaikoff, B.; Johnston, C. Complexity of Respirable Dust Found in
Paula, A. V. de; Fereira, N. E.; Buss, L. F.; Tozetto-Mendoza, T. R.; Mining Operations as Characterized by X-ray Diffraction and FTIR
Caixeta, R. A. V.; Leal, F. E.; et al. Performance of at-home self- Analysis. Minerals 2021, 11, 383.
collected saliva and nasal-oropharyngeal swabs in the surveillance (24) Stach, R.; Barone, T.; Cauda, E.; Mizaikoff, B. A Novel
of COVID-19. Journal of oral microbiology 2020, 13, 1858002. Calibration Method for the Quantification of Respirable Particles in
(7) Hanson, K. E.; Barker, A. P.; Hillyard, D. R.; Gilmore, N.; Mining Scenarios Using Fourier Transform Infrared Spectroscopy.
Barrett, J. W.; Orlandi, R. R.; Shakir, S. M. Self-Collected Anterior Applied spectroscopy 2021, 75, 307–316.
Nasal and Saliva Specimens versus Health Care Worker-Collected (25) Stach, R.; Barone, T.; Cauda, E.; Krebs, P.; Pejcic, B.; Daboss,
Nasopharyngeal Swabs for the Molecular Detection of SARS-CoV-2. S.; Mizaikoff, B. Direct infrared spectroscopy for the size-independent
Journal of clinical microbiology 2020, 58. identification and quantification of respirable particles relative mass
(8) Takeuchi, Y.; Furuchi, M.; Kamimoto, A.; Honda, K.; in mine dusts. Analytical and bioanalytical chemistry 2020, 412,
Matsumura, H.; Kobayashi, R. Saliva-based PCR tests for SARS-CoV-2 3499–3508.
detection. Journal of oral science 2020, 62, 350–351. (26) Ouyang, T.; Wang, C.; Yu, Z.; Stach, R.; Mizaikoff, B.; Liedberg,
(9) Vaz, S. N.; Santana, D. S. de; Netto, E. M.; Pedroso, C.; Wang, B.; Huang, G.-B.; Wang, Q.-J. Quantitative Analysis of Gas Phase IR
W.-K.; Santos, F. D. A.; Brites, C. Saliva is a reliable, non-invasive Spectra Based on Extreme Learning Machine Regression Model.
specimen for SARS-CoV-2 detection. The Brazilian journal of Sensors 2019, 19, 5535.
infectious diseases: an official publication of the Brazilian Society of (27) Gautam, R.; Chauhan, R.; Kumar, R.; Sharma, V. PLS-DA and
Infectious Diseases 2020, 24, 422–427. infrared spectroscopy based rapid and non-destructive
(10) Rao, M.; Rashid, F. A.; Sabri, F. S. A. H.; Jamil, N. N.; Zain, R.; discrimination of black ball and gel pen inks for forensic application.
Hashim, R.; Amran, F.; Kok, H. T.; Samad, M. A. A.; Ahmad, N. Forensic Science International: Reports 2021, 3, 100162.
Comparing nasopharyngeal swab and early morning saliva for the (28) Balabin, R. M.; Lomakina, E. I. Support vector machine
identification of SARS-CoV-2. Clinical infectious diseases: an official regression (SVR/LS-SVM)--an alternative to neural networks (ANN)
for analytical chemistry? Comparison of nonlinear methods on near
6infrared (NIR) spectroscopy data. The Analyst 2011, 136, 1703–
1712.
(29) Müller, C. M.; Pejcic, B.; Esteban, L.; Delle Piane, C.; Raven,
M.; Mizaikoff, B. Infrared attenuated total reflectance spectroscopy:
an innovative strategy for analyzing mineral components in energy
relevant systems. Scientific Reports 2014, 4, 6764.
(30) McKnight, S. H.; Gillespie, J. W. In situ examination of water
diffusion to the polypropylene-silane interface using FTIR-ATR. J.
Appl. Polym. Sci. 1997, 64, 1971–1985.
(31) Shen, Y.; Wu, P. Two-Dimensional ATR−FTIR Spectroscopic
Investigation on Water Diffusion in Polypropylene Film: Water
Bending Vibration. J. Phys. Chem. B 2003, 107, 4224–4226.
(32) Ullah, S.; Ullah, A.; Lee, J.; Jeong, Y.; Hashmi, M.; Zhu, C.; Joo,
K. I.; Cha, H. J.; Kim, I. S. Reusability Comparison of Melt-Blown vs
Nanofiber Face Mask Filters for Use in the Coronavirus Pandemic.
ACS Applied Nano Materials, 3(7), 7231-7241. ACS Appl. Nano Mater.
2020, 3, 7231–7241.
7Supplementary Files
This is a list of supplementary les associated with this preprint. Click to download.
NatureCommunicationsIRMaskVanessa2021SIFINAL.pdfYou can also read