An Economic Perspective to Independent Cinema - Munich ...
←
→
Page content transcription
If your browser does not render page correctly, please read the page content below
Munich Personal RePEc Archive

An Economic Perspective to Independent
Cinema

Arici, Cemali and Yucel, Eray

Ihsan Dogramaci Bilkent University, Ihsan Dogramaci Bilkent
University

1 August 2019

Online at https://mpra.ub.uni-muenchen.de/98679/
MPRA Paper No. 98679, posted 18 Feb 2020 21:25 UTC
An Economic Perspective to Independent Cinema
 Cemali Aricia and Eray Yucelb*
 a,b
 Department of Economics, Ihsan Dogramaci Bilkent University, Ankara, Turkey*

 Abstract

 This paper investigates the economic patterns related to independent cinema, which
 seems to be an understudied perspective in the literature. Using the classification in
 The Movie Database, we delve into basic features of movies and make comparisons
 of mainstream and independent cinema. Applying count regression models to
 alternative classifications of independent movies, we investigate the temporal patterns
 of independent movie creation and the linkages between independent and mainstream
 production volumes. We find that increasing number of independent films may be
 partially an outcome of increase in mainstream movie releases, showing a case of
 positive externality. In addition, increasing production budget for a movie has a
 positive impact on independent movie releases, in which the independent movies are
 more financed by the foundations such as United Artists over years.

 Keywords: cinema; movies; independent movies; economics of art; count regressions

1. Introduction

 Independent film is really a way of thinking. I used to think it was where the money
 comes from, but now it’s clearly about having a vision and a point of view when
 you want to tell a story.
 –Nancy Savoca, film director

After the Lumiere Brothers gave cinema industry a start, it would not be too late to accept
cinema as a branch of art; more precisely, cinema has been categorized as the seventh art by
Ricciotto Canudo (Bordwell, 1997). Cinema has been reshaping the lifestyle and overall habits
of people worldwide. At first, anthropological aspects of visual arts did not change with motion
picture, motion picture was used as means of modern art expression of “speaking and knowing”
(Grimshaw and Ravetz, 2009). In other words, “the narrative potential of film is so marked that
it has developed its strongest bond with the novel… Both film and novels tell long stories with
a wealth of detail and they do it from the perspective of a narrator, who often interposes a
resonant level of irony between the story and the observer” (Monaco, 1981: 27). After that,
cinema, as a giant industry, became a significant economic activity that with the advancements
in technology, it turned to be a mass production material with higher demands for motion
pictures even in 1907 (Balio, 1985). Although technological ease of production and screening
a movie is far behind the digital era of today, Stead (1982) states that 20 million tickets, which
corresponded to 40% of population, were sold every week in the UK, by 1938. Furthermore, in
some cases, cinema industry also turned to be a propaganda device, imposing political or

*
 Arici: Senior Student in Economics, İhsan Doğramacı Bilkent University, 06800, Ankara, Turkey, e-mail:
cemali.arici@gmail.com; Yucel: (Corresponding author) Lecturer, İhsan Doğramacı Bilkent University, 06800,
Ankara, Turkey, e-mail: eray@bilkent.edu.tr. The authors are grateful to Onur Sunay and Ahmet Gonullu for their
earlier contributions and Utku Ozmen for his comments and constructive criticism.

 1
power-related entities in order to convince people for the legitimacy of existing ideology or
political stance of administration. To exemplify, according to Margry (1992), Theresienstandt
(1944) is one of the essential Nazi propaganda films which is about one of the concentration
camps that “depicting as paradise”.
 Independent cinema, on the other hand, has been an important venue especially for the
intellectual. According to Tzioumakis (2006), studio era (mid-1920s to late 1940s) of the
cinema industry was dominated by the major companies of Hollywood and independent cinema
was considered for the low budget movie production companies. Within the post-studio era
(late 1940s to late 1960s) and cont., with the decline in material cost of producing a movie,
more oligopolization of Hollywood-based major production companies, and transformation of
cinema from an art form to as a means of entertainment made the way of “independent cinema”
having relatively late notion. Independent cinema no longer limited to just one economic
definition, but various descriptions made it valuable.
 Ergo, there is no commonly agreed and solid definition of independent cinema. Levy
(1999) states that independent films are mostly qualified by anti-Hollywood bias. While it can
be defined as “the position of individual films, or filmmakers, in terms of (1) their industrial
location, (2) the kinds of formal/aesthetic strategies they adopt and (3) their relationship to the
broader social, cultural, political or ideological landscape” (King, 2005: 1-2) from a
perspective, it can also be defined as “any film that has not been financed, produced and/or
distributed by a major entertainment conglomerate” (Tzioumakis, 2006: 2) of Hollywood from
another. Moreover, it is argued for independent movies that “the abundance of dialogue –
especially, intelligent dialogue–” and valuable preoccupations, methods and sensibilities that
mainstream films do not consider in general (Insdorf, 2005).

 Figure 1. Evolution of Movie Releases According to TMDB Viewer Pool, 1948-2007
 900

 800 Mainstream
 Independent
 700

 600

 500

 400

 300

 200

 100

 0
 1950 1960 1970 1980 1990 2000

 Tracking the progress of mainstream and independent movie releases on a yearly basis
(Figure 1), we see an increasing trend in the total movie releases. Especially after 1992, the
trend became steeper and this means that more releases occur every coming year. From 1948,
independent movies also started to show an increasing trend until 2007; from 1993, the number
of independent movies started to increase with a more rapid fashion. Furthermore, the
distribution of independent movies follows a similar path with the total number of movies. We
observed a decline in total number of movies in 2007, but an increase in independent movies.
 Against this background, we believe that independent cinema has been discussed in the
literature of cinema and art; yet, it deserves some statistical analysis which remains to be an
understudied topic in the earlier work. What we specifically do in this paper is to reveal
economic patterns of released and classified independent movies, their fundamental similarities
and differences from mainstream movies, and driving forces of releasing an independent movie.

 2

The remainder of the paper is as follows: The next section includes a literature review.
Section 3 involves the data and our preliminary observations on distribution of language, genre,
runtimes, and monthly releases of movies over years. Section 4 presents the empirical work of
the paper by firstly giving the statistical framework we employ, then revealing our main
estimates together with Levy (1999)’s classification of independent movies. We discuss the
data and findings in Section 5 before concluding the paper in the last section.

2. The Literature
Considering our context, i.e. independent cinema and economic analysis of motion picture
industry, the literature lacks a study with the perspective of ours. Most of the independent movie
literature analyzes the artistic and technical aspects of cinema, which can be said there were not
enough studies with an economic or statistical perspective. Looking under this, we limited our
review to fields out of artistic and technical aspects. In the first strand of literature as we view,
Bordwell (1997) gives the historical development of cinema and emphasizes that cinema from
its early years could be named as a distinct art that it mostly comprised of a narrative style of
film screening. According to Vogel (2007) motion picture industry was shaped and improved
by several essential factors and structures as follows: (1) Technological advances in film
production, (2) need for high amounts of capital to employ motion pictures, (3) the appearance
of complex theater chains in suburbs, (4) increase in the number of independent productions.
While Staiger (1990) examines the historical roots of Hollywood-based movie advertisements,
she emphasizes that the film industry enhanced its ways of commercializing movies for an
expanded marketplace and higher profits. Further, Grainge (2007) discusses branding side of
Hollywood and adds that Hollywood became an entertainment sector, more precisely, a global
supplier of media entertainment. Additionally, Cook (2016) discusses the rise of the Hollywood
dominance and finds out World War I had a critical impact on it to become a dominant movie
supplier, even the effect of the war was temporary in terms of movie production. Although the
only reason of rising Hollywood dominance was not the impact of the war, he exemplifies 90%
of all movies released in Europe, in 1919 were imported from the US.
 For the independent movie production, most of the studies were comprised of American
independent cinema. Holmlund (2005) underlines that the disengagement of movie production
from studio system paved the way for independent movie production by 1960s. Mekas (2005)
differs the notional definitions of independent cinema that while the term “independent” was
used to refer to those low budget productions before the 1950s, the terms avant-garde and
experimental films were used for movies that bear the characteristics of independent movies
after the 1950s. Levy (1999) looks for human-driven factors of making an independent movie
and describes independent cinema as something belonging to “outsiders” of the sector, meaning
that firstly the characters of movies were reflected as not protagonists but “deviant” ones;
secondly, the filmmakers are actually from minorities or majorities which deviated from
mainstream culture. While placing independent movies in a layout, King (2005) states the
grounds of American independent cinema to be between very low level of budget use to “the
margins of Hollywood”. To be clearer, he emphasizes that “the term ‘independent’
encompasses a wide range of activities in the broad territory located between Hollywood and
the outer reaches of ‘non-industrial’ experimental or avant-garde cinema”. As being a scanty
definition of independent cinema, Tzioumakis (2006) underlines the classification of
independent cinema should not be restricted to financial side of film production and he remarks
that independent films fill some gaps of the mainstream cinema such as important social issues
as well as unorthodox visual styles and narrative structures. Furthermore, Berra (2008)
expresses the consumer side of the cinema; he differentiates the audience of mainstream and
independent movies, and represents independent cinema as “a cinema that is made for an
audience that appreciates and absorbs, rather than one that simply consumes and forgets”. He

 3
also touches upon the market side of the story and places independent cinema as subordinate to
Hollywood majors and states the fact that independent productions, in general, cannot threaten
the majors due to their economic weakness. Independent movies, yet, “are more valued by the
critical establishment as they address serious themes and issues, making them intellectually
prominent examples of America’s cinematic output” (Berra, 2008: 19).
 In the second strand, the absence of empirical studies on independent movies in the
literature pushes us to view the literature of statistical studies on the overall cinema industry.
Firstly, Basuroy et al. (2006) use 175 films to see if there is an interaction between box office
successes and the two signals they consider: Sequels and advertising expenditures. They found
a positive relationship between sequels and advertisement expenditures, suggesting that
producers should advertise more on new movies than sequels. Pokorny and Sedgwick (2010)
analyze the profitability trends of Hollywood movies between 1929 and 1999. What they
emphasize was a difference in demand between the early and late years of their sample. Yet,
after the 1950s, film producers became more successful at earning higher revenues from a
smaller number of movies. They also concluded that while the theatrical releases generated
almost all the revenue before the 1960s, by 2000 it generated around 30% of all revenues of a
movie release. Moreover, Chen (2018) finds a strong correlation between movie budgets and
revenues, but a smaller correlation between runtimes and revenues.
 Secondly, within the globalization process, movie trade has also become a significant
item that Jayakard and Waterman (2000) discuss the impacts of Hollywood movie exports
across countries. According to their study, countries which purchase relatively large portion of
movies than others had higher shares of domestic box office. Moreover, they revealed smaller
market shares for countries having higher spending on cinema. On the other hand, Walls and
McKenzie (2012) look for answers to whether Hollywood makes movies for their domestic
consumers or international demand. Their results are affirmative, indicating a declining
domestic market share in the US. While the movie trade has taken its place, Scott (2004)
analyzes the distribution of motion picture to the globe by Hollywood. He divides production
and distribution activities in Hollywood as majors and independents, where he suggests that
Hollywood hegemony is sustained and there were increasing amount of movie exports in recent
years. He also states that the situation is the result of the trade initiatives provided by the US
government.
 Thirdly, to look at regional studies in the literature, Blanco and Pino (1997) study the
cinema demand in Spain between 1968 and 1992. The findings show that there was a declining
cinema attendance owing to the fact that cinema was categorized as luxury. Yet, the results are
also driven by increasing ticket prices and increasing demand for television programming.
Alternatively, Lee (2002) made a comparison of movie industries of the US and Japan and
found there was a decrease in Japanese box office. The author states that the ratio of movie
spending rate became higher in the US and this caused relatively less box office revenues for
Japan. Moreover, because the US has rapidly improved its movie technology than Japan, there
were more American-exported movies than domestically produced.
 By employing rational addiction theory of Becker and Murphy (1988), Sisto and Zanola
(2010) study 12 European countries’ cinema consumption. They found that cinema demand is
in line with the theory, meaning that past and future consumption is very related for cinema
consumption in European countries. Finally, Chuu et al. (2009) differentiate the art and
mainstream movie audiences and seek different patterns of movie consumption. Their results
show that art film audience considers movies not only as a means of entertainment but as an
integral part of culture. They regularly and frequently go movies and are more tolerant to theater
conditions.

 4
3. Data and Preliminary Observations

In this study, we use a data set by Banik (2017) with some essential alterations. Original data
set contains 45,000 movies retrieved from MovieLens Datasets, affiliated to Social Computing
Research at the University of Minnesota, and involves various features taken from The Movie
Database (TMDB) for movies produced until July 2017. The data set includes IDs for TMDB
and Internet Movie Database (IMDB), release date, main spoken language, runtime, and genres
of each movie. Moreover, we classified independent movies according to plot keywords
determined by the TMDB users, e.g. “independent film” and “indie”. After the identification of
the independent movies, we eliminated from the original data set the TV series, documentaries,
and movies which were not released and those including adult content from the original data
set. Furthermore, we added yearly movie production budgets from The Numbers
(https://www.the-numbers.com) to the data set after deflating the figures with the US CPI.
Eventually, our data set covers 21,071 movies starting from January 1948 to December 2007.
From the keywords, 1,381 movies were determined as independent movie; the first and last
movie were dated to September 1949 and December 2007, respectively.
 Then, it is possible to produce an array of observations. Firstly, English is the most
spoken language in both the whole movie pool and independent movies, followed by French,
Italian, Japanese and German. Secondly, drama was the most popular genre, appeared on
11,890 movies, corresponding to 25% of all; comedy was the second most popular by 7,553
movies and 16%; and noire was the least popular by appearing 291 movies and corresponding
to 1% of all movies (Figure 2).

 Figure 2. Genres of Movies, All Years
 Western, 611, 1% Noire, 291, 1% Sport, 329, 1%
 Musical, 470, 1%
 War, 681, 1% Action, 3326, 7%

 Adventure, 2385, 5%
 Sci-Fi, 1215, 3% Thriller,
 2548, Animation, 531, 1%
 5% Biography, 722, 2%
 Romance, 3719, 8%

 Mystery, 1343, 3% Comedy, 7553, 16%

 Music, 1011, 2%

 Horror, 2215, 5%

 History, 614, 1%

 Fantasy, 1185, 3%
 Crime, 3552, 8%
 Family, 1000, 2%

 Drama, 11890, 25%

 Notes: Labels provide genre name, number and percentage of movies in specific genres.

 Interestingly, Figure 3 demonstrates that both independent films and mainstream films
track a similar pattern for the most popular four genres; drama, comedy, romance, and crime.
There are also diversions that while action is the 5th most popular genre for mainstream movies,

 5
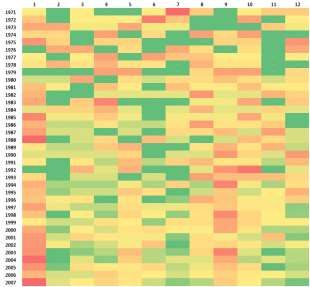
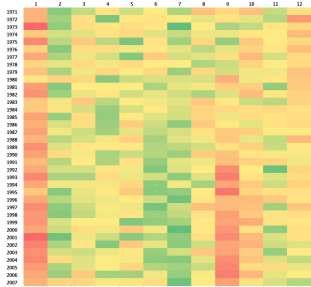
it is the 8th for independent movies. Lastly, for the independent movies, the least popular genre
was noire, as for mainstreams.

 Figure 3. Comparison of Genres by Mainstream and Independent Movies, All Years
 14000 Mainstream 1000
 900
 12000 Independent
 800
 10000 700

 8000 600
 500
 6000 400
 4000 300
 200
 2000
 100
 0 0
 Roman…

 Advent…

 Biogra…

 Animat…
 Family

 War
 Mystery
 Sci-Fi

 History

 Sport
 Music

 Western

 Musical

 Noire
 Drama
 Comedy

 Action
 Thriller
 Crime

 Horror

 Fantasy

 Notes: The genres are sorted in decreasing order of mainstream production (left axis).

 Figure 4. Runtime of Movies by Years
 200
 NDP=0

 160

 120

 80

 40
 YEAR=1948
 YEAR=1950
 YEAR=1952
 YEAR=1954
 YEAR=1956
 YEAR=1958
 YEAR=1960
 YEAR=1962
 YEAR=1964
 YEAR=1966
 YEAR=1968
 YEAR=1970
 YEAR=1972
 YEAR=1974
 YEAR=1976
 YEAR=1978
 YEAR=1980
 YEAR=1982
 YEAR=1984
 YEAR=1986
 YEAR=1988
 YEAR=1990
 YEAR=1992
 YEAR=1994
 YEAR=1996
 YEAR=1998
 YEAR=2000
 YEAR=2002
 YEAR=2004
 YEAR=2006

 200 NDP=1

 160

 120

 80

 40
 YEAR=1948
 YEAR=1950
 YEAR=1952
 YEAR=1954
 YEAR=1956
 YEAR=1958
 YEAR=1960
 YEAR=1962
 YEAR=1964
 YEAR=1966
 YEAR=1968
 YEAR=1970
 YEAR=1972
 YEAR=1974
 YEAR=1976
 YEAR=1978
 YEAR=1980
 YEAR=1982
 YEAR=1984
 YEAR=1986
 YEAR=1988
 YEAR=1990
 YEAR=1992
 YEAR=1994
 YEAR=1996
 YEAR=1998
 YEAR=2000
 YEAR=2002
 YEAR=2004
 YEAR=2006

 Notes: NDP=0 and NDP=1 correspond to mainstream and independent movies respectively.

 Thirdly, Figure 4 displays the categorical box plot of the runtimes of mainstream and
independent movies by years. After eliminating the extreme values higher than 180 minutes

 6
and lower than 30 minutes, we observed an increase in means of runtime over years for
 mainstream movies by the early 1960s. From then on until the late 2000s, it tracks a similar and
 stable trend. While 50% of mainstream movies’ runtimes found between 80 to 100 minutes,
 25% can expand to 140 minutes and 25% can decrease to 40 minutes runtime. Moreover,
 although runtime averages of independent movies show an increasing trend by 1968, it also
 attains a stable trend until 2007. The plot also indicates that independent movies’ runtimes have
 less dispersion.
 Lastly, we examined the monthly distribution of movie releases to see whether there
 were different patterns for both mainstream and independent movies (Figure 5). Because the
 data has gaps for many months for independent movies before 1971, we started to examine
 from this year to 2007. We observed that both types of movies were usually released in January.
 Despite the case, mainstream movie releases followed more frequent releases than independent
 movies in Januaries at least before the 2000s. Once again, September is important for
 mainstream movie releases that from the early 1990s, mainstream movie release became more
 frequent in Januaries, and it seems release date was chosen either one of these two months.
 More precisely, from 1984, either one of these months shows an exact dominance over other
 months.

Figure 5. Release of Movies by Months
Mainstream Movies Independent Movies

Notes: (1) Months are in columns. (2) Density increases from green to red and light to dark.

 For the independent movies, even Septembers could be seen as the second most
 preferred release month, it does not show significant number of releases as mainstream movie
 releases. Particularly before the end of the 1990s, chart shows more dispersion over different
 months which can be considered as the insignificance of a release month for an independent
 movie. Nevertheless, with the 2000s, independent movie releases show a similar pattern as
 mainstream movies, as we further discuss in Section 5.

 4. Empirical Analysis

 Statistical Framework

 While studying the temporal patterns of movie production/release, we employ count models by

 7
Hausman et al. (1984) owing to their good fit to our context. Count models represent the number
 of occurrences in specific and fixed time period of an event, over a non-negative domain. For
 the estimation, count data require to use Poisson regression for the distribution and coefficients,
 and negative binomial model for testing with overdispersion of data. A model is estimated by
 the methods of maximum likelihood (ML) and quasi-maximum likelihood (QML) estimators.
 In our case, as being discrete variables, we took the number of both independent and
 mainstream movies according to their release year between 1948 and 2007.
 Poisson model should be employed when expected number of and independently
 occurring events are to be examined (Hausman et al., 1984: 911-914). Poisson process
 emphasizes the importance of series of discrete events without exact specification of timing;
 yet, average time of occurrences of events is known. On the other hand, Poisson distribution
 leads us to probability of a number of events in a time period. With maximizing the log
 likelihood function, ML estimator can be obtained. A good specification of Poisson model
 necessitates the equality of conditional mean and variance.
 As an alternative to Poisson model, negative binomial can also be used for count data
 (Hausman et al., 1984: 921-928). It again produces probabilities of the number of events in
 time periods as in Poisson model. Nevertheless, it is a more generalized version of Poisson
 model that it relaxed the conditional mean and variance equality restriction. Negative binomial
 is often employed when the data displays overdispersion. We can alternatively use QML
 estimator rather than ML estimators for incorrectly specified distributions with only one
 requirement, i.e. a correctly specified mean. QML estimators for negative binomial provide
 consistent and robust estimates.

 Estimates

 By employing the data set described before, we applied count regression models to explore the
 relationship between independent and mainstream movies. In addition, we included the yearly
 average production budgets from The Numbers (https://www.the-numbers.com) and inflation-
 adjusted series to observe how the production budgets are affecting the number of independent
 movie releases. Thus, number of independent movies are regressed on firstly number of
 mainstream movies, secondly number of mainstream movies and average production budget.
 Lastly, time trends are added to specifications.

Table 1. Estimates for Independent Movies, 1948-2007, Poisson (ML/QML)
Dependent variable: Count of independent movies
 I II III IV V VI VII VIII IX X XI XII
Constant 3.1354*** -1.9703*** 0.4719 -1.1375*** -1.9834*** -1.9726*** -5.0964*** -3.6342* -3.6504* -7.8884*** -1.7640 -1.7837
 (0.0000) (0.0000) (0.5348) (0.0000) (0.0000) (0.0000) (0.0079) (0.0618) (0.0603) (0.0014) (0.3767) (0.3711)
Trend 0.0637*** -0.0006 0.0458*** 0.0640*** 0.0639*** 0.0425*** 0.0634*** 0.0633*** 0.1000*** -0.0028 -0.0025
 (0.0000) (0.9722) (0.0000) (0.0000) (0.0000) (0.0000) (0.0000) (0.0000) (0.0019) (0.8880) (0.9001)
Trend² 0.0004*** -0.0004* 0.0004*** 0.0004***
 (0.0011) (0.0696) (0.0010) (0.0011)
Number of 0.0015*** 0.0016*** 0.0025***
Mainstream Movies (0.0000) (0.0000) (0.0000)
Δ Number of -0.0007 -0.0008 -0.0007
Mainstream Movies (0.1452) (0.1335) (0.1737)
Δ Log Number of -0.5563* -0.5731* -0.5108
Mainstream Movies (0.0883) (0.0803) (0.1122)
Log Real APB 0.2428** 0.0992 0.1008 0.2842** 0.1372 0.1382
 (0.0366) (0.3934) (0.3851) (0.0158) (0.2356) (0.2317)
Sample size 60 60 60 60 60 60 60 60 60 60 60 60
R² 0.0000 0.9118 0.9349 0.9416 0.9176 0.9185 0.9415 0.9147 0.9157 0.9331 0.9367 0.9373
Adjusted R² 0.0000 0.9103 0.9326 0.9396 0.9147 0.9156 0.9384 0.9102 0.9112 0.9283 0.9321 0.9327
LR 1238.2*** 1248.4*** 1262.2*** 1240.3*** 1241.1*** 1266.5*** 1241.1*** 1241.9*** 1269.9*** 1251.5*** 1252.2***
 (0.0000) (0.0000) (0.0000) (0.0000) (0.0000) (0.0000) (0.0000) (0.0000) (0.0000) (0.0000) (0.0000)
Notes: p-values are given in parentheses. (***), (**) and (*) indicate statistical significance at = 0.01, 0.05 0.10.

 8
We initiated the estimation process by testing the Poisson regression. Using both ML
 and QML estimators, we obtained estimates (Table 1) for various specifications. First
 observation shows there is a general tendency for specifications III, XI, XII that if the model
 involves Trend² variable, all others become non-significant coefficients, except for
 Specification X. Secondly, the coefficients of Δ Number of Mainstream Movies are not
 significant in any specification, which implies the growth of mainstream movies does not have
 a significant impact on independent movie releases.
 Before adding Log Real APB, most significant specification is IV with 1262.2 likelihood
 ratio, and all coefficients are significant at 0.01. It implies a positive relation that increasing
 number of mainstream movies has an explanatory effect on independent movies, even if the
 effect is small. Adding the average production budgets to the estimation, Specification X
 becomes the most significant estimate, with 1269.9 likelihood ratio. The estimate shows
 increasing number of mainstream movies, which is significant at 0.01, and production budget,
 which is significant at 0.05, have positive impact on independent movies. Furthermore,
 statistically significant Trend² at 0.1 produces a small negative effect that we believe it is the
 reflection of decreasing number of movies in 2007. The same regression yet without Trend²,
 Specification VII, shows very similar results in terms of coefficients and exact results in terms
 of significance levels. Thus, we may say that Trend² has explanatory power to describe the
 decreasing number of movies in the last year.
 Cameron and Trivedi (1990) represent regression tests for Poisson restrictions and
 overdispersion. According to the tests, even though Poisson estimates give statistically
 significant results, we rejected the Poisson restrictions and found out overdispersion in our data.
 To handle the issue, we secondly estimated negative binomial model by QML estimator,
 employing a fixed variance parameter in each specification.

Table 2. Estimates for Independent Movies, 1948-2007, Negative Binomial (QML)
Dependent variable: Count of independent movies
 I II III IV V VI VII VIII IX X XI XII
Constant 3.1354*** -1.7607*** -0.1988 -1.1372*** -1.7844*** -1.7779*** -6.2745 -4.8081** -4.7707** -9.4911*** -3.0036 -2.9661
 (0.0000) (0.0000) (0.8213) (0.0000) (0.0000) (0.0000) (0.4428) (0.0346) (0.0353) (0.0007) (0.1831) (0.1874)
Trend 0.0611*** 0.0182 0.0458*** 0.0615*** 0.0615*** 0.0509** 0.0604*** 0.0604*** 0.1310*** 0.0148 0.0145
 (0.0000) (0.4336) (0.0000) (0.0000) (0.0000) (0.0435) (0.0000) (0.0000) (0.0005) (0.5272) (0.5325)
Trend² 0.0002* -0.0006** 0.0002** 0.0003**
 (0.0621) (0.0173) (0.0472) (0.0459)
Number of 0.0015*** 0.0011 0.0031***
Mainstream Movies (0.0001) (0.6735) (0.0000)
Δ Number of -0.0006 -0.0007 -0.0007
Mainstream Movies (0.4516) (0.4413) (0.3527)
Δ Log Number of -0.4942 -0.5001 -0.5072
Mainstream Movies (0.3121) (0.3122) (0.2433)
Log Real APB 0.2852 0.1819 0.1801 0.3128** 0.1737 0.1723
 (0.5635) (0.1803) (0.1832) (0.0165) (0.1728) (0.1748)
Sample size 60 60 60 60 60 60 60 60 60 60 60 60
R² 0.0000 0.9021 0.9267 0.9416 0.9083 0.9094 0.9363 0.9021 0.9033 0.9246 0.9283 0.9293
Adjusted R² 0.0000 0.9004 0.9241 0.9396 0.9050 0.9062 0.9329 0.8968 0.8982 0.9191 0.9231 0.9241
LR 9990.7*** 22707.4*** 33101.9*** 11758.8*** 12102.4*** 100.9*** 10851.6*** 11166.9*** 21848.1*** 24754.9*** 25493.0***
 (0.0000) (0.0000) (0.0000) (0.0000) (0.0000) (0.0000) (0.0000) (0.0000) (0.0000) (0.0000) (0.0000)
Notes: p-values are given in parentheses. (***), (**) and (*) indicate statistical significance at = 0.01, 0.05 0.10.

 For all specifications, our estimates (Table 2) indicate higher likelihood ratios –except
 Specification VII in Table 1– which may validate the negative binomial regression against
 Poisson regression. Looking at Table 2, we encountered similar results, i.e. Specification IV for
 excluding Log Real APB and Specification X for including Log Real APB but stronger
 significance level of Trend² in negative binomial model. For Specification IV, both Table 1 and
 Table 2 give almost the same coefficients; the disparity is just 0.0003 difference between
 constants’ coefficients and both gives similar significances in all other coefficients. For
 Specification VII, in negative binomial model, the majority of significant results disappear. For

 9
Specification X, it becomes more statistically significant than the Poisson model. Though,
 Table 2 provides higher values for positive coefficients and smaller values for negative
 coefficients which mean higher effects of variables on number of independent movies, they
 display same pattern for significance levels but Trend² is more statistically significant than
 Poisson model at 0.05 rather than 0.10.

 Clarifications through an Alternative Classification of Movies

 As an alternative to our TMDB data, Levy (1999) provides an extensive list of independent
 movies (indies) between 1977-1998. Within the total of 452 independent movies in the list, we
 selected 425 movies which are compatible and can be found in our data set; we treated other
 movies, which were not listed as independent movies by Levy over the range of our primary
 data set, as mainstream movies. Thus, we obtained 7,558 mainstream movies between 1977 and
 1998. On the other hand, in our primary TMDB data set, we have 528 independent and 7,455
 mainstream movies to be estimated for the same time period. Furthermore, we have only 130
 movies that were classified as independent movies by both Levy and TMDB users. For the sake
 of valid estimates, we rather used monthly distribution for movies by their release date owing
 to the restricted time period.
 Looking at the distributions of independent movies by both classifications, there is an
 increasing trend for the total number of movies for both. According to Figure 6, the general
 view is that mainstream movies track an increasing trend for both classifications and there is an
 obvious concentration for the independent movies in the late 1990s.
 For the differences, while Levy’s classification is indicating an accelerating independent
 movie production until the 3rd quarter of 1995, TMDB user classification pictures more stable
 independent movie production by 1994. Even though these two classifications draw a similar
 picture in terms of rise of independent movie releases in the 1990s, we observed a higher
 dispersion over the 1990s in the TMDB classification, while the independent film releases were
 relatively more accumulated in the mid-1990s according to Levy’s classification.

Figure 6. Evolution of Movie Releases, 1977-1998
 TMDB Classification Levy’s Classification
70 70
 Mainstream Mainstream
60 Independent 60 Independent

50 50

40 40

30 30

20 20

10 10

0 0
 78 80 82 84 86 88 90 92 94 96 98 78 80 82 84 86 88 90 92 94 96 98

 In order to distinguish these two classifications, Table 3 represents the fundamental
 estimates by count regression models for both classifications. We regressed the number of
 independent movies on firstly number of mainstream movies, and secondly number of
 mainstream movies and average production budget together. For the method, because L-I, L-
 II, L-III, and T-I classifications signalize the rejection of Poisson restrictions and overdispersion
 in the data, we employed QML estimator with fixed variance parameters. For T-II and T-III,
 we applied Poisson model with ensuring conditional mean and variance equality.

 10
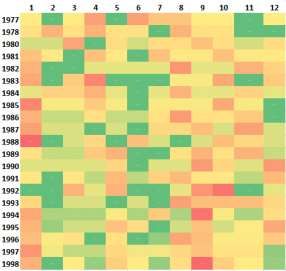
Table 3. Estimates for Independent Movies, 1977-1998
 Dependent variable: Count of independent movies
 Levy Classification TMDB Classification
 L-I L-II L-III T-I T-II T-III
 Constant -1.8342*** -2.8286*** -19.5647*** 16.3345* 6.0445 -5.4048
 (0.0000) (0.0000) (0.0062) (0.0982) (0.4711) (0.6950)
 Trend 0.0166*** 0.0189*** 0.0222*** -0.0371* -0.0155 -0.0027
 (0.0009) (0.0001) (0.0000) (0.0637) (0.3601) (0.8959)
 Trend² -1.35E-05 -3.10E-05** -4.92E-05*** 2.13E-05** 9.01E-06 2.33E-06
 (0.4034) (0.0388) (0.0023) (0.0343) (0.2919) (0.8270)
 Number of 0.0363*** 0.0381*** 0.0358*** 0.0362***
 Mainstream Movies (0.0000) (0.0000) (0.0000) (0.0000)
 Log Real APB 0.9713** 0.3127
 (0.0190) (0.2939)
 Sample size 264 264 264 264 264 264
 R² 0.3288 0.4783 0.5158 0.2115 0.4297 0.4343
 Adjusted R² 0.3236 0.4723 0.5083 0.2054 0.4231 0.4256
 LR 209.8*** 1408.0*** 2143.6*** 1890.9*** 154.9*** 156.0***
 (0.0000) (0.0000) (0.0000) (0.0000) (0.0000) (0.0000)
 Notes: p-values are given in parentheses. (***), (**) and (*) indicate statistical significance at =
 0.01, 0.05 0.10, respectively. (2) L-I, L-II, L-III and T-I were estimated by QML; T-II and T-III
 by Poisson method.

 In Table 3, based on L-III specification, Trend shows the general increase in the
independent movie releases over years; secondly, Trend² is interpreted as the decline in the
number of independent movies after 1997. Both the mainstream movie releases and average
production budget impact the independent movie production positively, the effects of the latter
being more intense (0.9713 against 0.0381). On the other hand, TMDB classification presents
non-significant results for right hand side variables except for the number of mainstream
movies, indicating weak estimates against Levy’s classification as seen in likelihood ratios. We
believe that the reason for these differences lies above the professionalism on the field as
Emanuel Levy is a professor of cinema studies, while TMDB classification is identified by
various internet users.

 Figure 7. Release of Independent Movies by Months between 1977-1998
 TMDB Classification Levy’s Classification

 Notes: (1) Months are in columns. (2) Density increases from green to red and light to dark.

 11
Furthermore, we looked at the monthly distribution of movie releases for TMDB user-
based and Levy’s classifications (Figure 7). In Figure 5, we have already showed the differences
in monthly releases of mainstream and independent movies and found out more irregular
distribution of movie releases for independent movies across months; then we looked for these
two independent movie classifications (Figure 7) if there was any contradiction in monthly
movie releases. What we found is that Levy’s classification provided relatively more
homogenous distribution of movie releases across all 12 months, meaning that the independent
movies were not released on Januaries and Septembers as TMDB user classification indicates
although there was still a shade of concentration in these two months for independent movies.

5. Discussion

Starting from the preliminaries, we generated a series of observations that present main and
significant knowledge about movies in our data set. Then we looked for genre distributions of
the movies (Figure 2 and Figure 3) and found that drama and comedy were the most popular
genres to screen a movie. We believe that some genres may create its own budget constraints,
i.e. producing an action movie should have higher costs than a drama or comedy. From this
point of view, we observed huge numbers of movies made in drama and comedy genres for
both type of movies (Figure 3) and action genre was not as preferred in independent movies as
in the mainstream. Moreover, it can be also interpreted that a general similarity in genres of
both mainstream and independent movies may be explained by the correlation (Table 2) that
increasing number of mainstream movies positively affect the number of independent movies.
 For the runtime of movies (Figure 4), mainstream movies had on average longer
durations than independent movies and while mainstream movies are sometimes longer up to
130 minutes, these also drop to 30 minutes with more extreme values than independent ones.
However, independent movies generally were shot in more steady runtimes yet they sometimes
behaved to lengthen the runtime rather than shorten it. This is in line with Ainslie et al. (2003)
who state that “‘art’ movies tend to have longer runtimes than blockbusters”.
 Next, we aimed to figure out (Figure 5) whether movie release months follow a stable
pattern. What we observed is interesting as especially mainstream movies have a tendency to
release mostly in Januaries and Septembers. According to Chen et al. (2013), summer months,
the New Year holiday and Memorial Day holidays have significant effect on movie demand.
By contrasting, we may say high movie releases on Januaries might be the result of the New
Year holiday effect; yet, our findings contradict with especially summer month effect due to
relatively low level of movie releases. Furthermore, there is dump month phenomenon that
Berg and Raddick (2017) explain as the months that least preferred to release a movie. It is
believed that movies that released in dump months are generally of low-quality, get relatively
bad reviews and less box office successes. Even though dump months may differ from one
author to another, generally January is traditionally the most important dump month (Berg and
Raddick, 2017). In a way, our findings contradict with this phenomenon. For the independent
movies by the 2000s, even though some months display dominance over the others, it drew a
relatively uniform picture than mainstream movies. Yet, since the 2000s, it became similar to
mainstream movie releases. Though our findings did not exactly reflect what Berra (2008)
states, i.e. independent producers were repressed to release their movies similar to Hollywood’s
schedule as being “cinema of the ‘routine’”. In this way, similitude of monthly movie releases
after the 2000s for both types of movies can be reasoned to behavior of independent
moviemakers.
 In our estimates, we attended to reveal the economic reasons of increasing number of
independent movies over years. Firstly, we employed Poisson count models comprised of
number of independent movies as our dependent variable explained by the number of

 12
mainstream movies and the percentage change in average production budgets. Our estimates
provide significant results (Table 1) that both independent variables have a positive effect on
the number of independent movies. Yet, owing to issues of conditional mean and variance
equality did not hold and some overdispersion in our data set, we instead employed negative
binomial count model as a remedy, the results of which confirm those of the Poisson
specification. Hence, by applying an alternative method on estimation, LR statistics provide
higher significance level for our estimates. We grounded our discussion on Specification X (in
both Tables 1 and 2) that number of independent movies regressed on number of mainstream
movies and percentage change in average production budget, with also Constant, Trend, and
Trend². In this specification, two negative coefficients appeared: Constant and Trend². We
basically ignored the effect of constant due to having other significant coefficients, and Trend²
is significant indicator for the data. To be precise, even original data set contains movies by
July 2017, because the number of movies radically decrease after 2006, we eliminated the
movie releases after 2007. The purpose of keeping the movies released in 2007 was to
investigate if there is any effect of emerging financial crisis on movie markets. Within our
investigation, we found that total number of movies worldwide has increased even in crisis
years.
 Other coefficients of Specification X (Table 2) show that Trend is able to track
increasing number of movies over years. The number of mainstream movies and Log Real APB
both have a positive impact on number of independent movies, despite at different degrees.
Levy (1999) discusses that there was an institutionalism of independent cinema in 1990s that
both mainstream and independent productions have organizational structure. In his words,
“indies now form an industry that runs not so much against Hollywood as parallel to
Hollywood. American culture has two legitimate film industries, mainstream and independent”
(Levy, 1999: 501). Hence, a reason appears with the consumer side of the story: Both sectors
have own characteristic consumers for entertainment or intellectual purpose; nevertheless, there
are also consumers that consume both according to Levy. Furthermore, King (2004) underlines
that the acquisition of two important independent movie distributors by Disney and Time-
Warner: Miramax and New Line. It may also point to increased competition –not entirely about
monetary terms– between the film industries.
 Secondly, higher coefficient of Log Real APB may lead us to an interesting story. In our
regression analysis (Table 2), the highest positive effect was originated from the production
budget indicator. We think that there might be two reason behind it: Firstly, increasing cost of
producing a movie (it includes various elements from increasing cost of post-production to
insurance of all labor) might increase the number of releases, and secondly, the budget should
intentionally be increased for higher box office revenue returns or to produce better movies. In
a way, Log Real APB measures the ability to produce movies. We believe the second reason is
more sensible because there is no increasing trend of production budgets for all years as our
monetary indicator shows that the 1960s has the highest production budgets than the other years
in our data. To support the argument, we also observed that for the late 20th century, independent
movies were allocated higher budgets than the early years. According to Tzioumakis (2006),
The United Artists, which was established to prevent actors to be dependent on the commercial
studios, had significant amount financial support on independent filmmakers so that they do
not need to seek additional financial resources. As an example of relieving the financial
concerns of independent filmmakers after the post-studio era, the author narrates that
“independent production was in full swing with almost 70 per cent of the ex-studios’ output
being independently produced films, forcing industry officials like United Artists’ vice
president, Max E. Youngstein, to talk about ‘an independent revolution’ that had over thrown
‘the one-man studio czar system’” (Tzioumakis, 2006: 120). Hence, we see that independent
productions started to be considerably financed and our estimates can be harmonized with this

 13
situation. Increased production budget has a significant effect on the number of independent
movies.
 The workings of the Log Real APB, we anticipate, is likely to reflect the dynamics of a
“decreasing cost industry” from a microeconomic perspective. In that, as more budget is
allocated to any single movie, more resources (physical and human capital) would be available
for the whole sector. Such an availability is supposed to pull down the production costs in the
long term.
 Because the independent movies in our main data were classified by TMDB users alone,
we subsequently tested if there would be differences in case an alternative classification (here
Levy’s) was employed. Due to the shorter time coverage of Levy’s classification, we analyzed
monthly distribution of independent movies between 1977-1998. Starting to contrast (Figure
7), in Levy’s classification, there are fewer independent movies released in Januaries and
Septembers than what TMDB user classification shows. Yet, while Berra (2008) also states that
even the independent film releases are mirroring the Hollywood’s schedule, these movies are
also released throughout the year. Therewith, we clarify the minor densities in Januaries and
Septembers and relatively more homogenous movie releases between other months in the
Levy’s classification by attributing the argument of Berra.
 When the count models (Tables 1 and 2) are replicated with Levy’s classification (Table
3) and at a monthly frequency, our initial outlook of estimates is preserved. Nevertheless, a
monthly replication of the estimates using TMDB data restricted to Levy’s time period seems
not robust. The only correlation lies upon the number of mainstream and independent movies
that (T-II and T-III specifications) it should be the same situation in every specification we
would make because we observe a general hand in hand increase in both type of movies through
years (Figure 1). Moreover, we got nearly the same coefficients for number of mainstream
movies variable in the Levy’s classification (L-II and L-III), which refer to the similar degree
of the effect as within the TMDB classification (T-II and T-III). By looking at the regression
specifications (L-III and T-III), we conclude that the Levy’s classification better justifies the
sources of number of independent movies over years.

6. Concluding Remarks

The purpose in this paper is to investigate the economic identifiers of independent movies. Our
preliminary observations allow us to reveal the progress of independent movies in terms of their
primary features and provide us some patterns to distinguish mainstream and independent
movies. Our preliminaries show that some general features of films were similar in both
mainstream and independent movies, e.g. main spoken language and genres; yet, some features
were different, e.g. runtimes and release months. While most of our observations conformed
with the literature, release month of movies contradicted with the dump month literature that
movies releases become more frequent in summer months. Essentially, our regression analyses
provide valid estimates for the literature of cinema that we found both increasing number of the
mainstream movies and increasing production budget has positive and explanatory effect on
the number of the independent movies. Lastly, we analyzed the different classifications of
independent films and found out that Levy (1999) classification provided more appealing
estimates for the period running from 1977 to 1998.

References
Ainslie A, Dreze X and Zufryden F (2003) Modelling movie choice. Available at:
 https://pdfs.semanticscholar.org/5eac/e46b8eed541c80e68d6acb7469200e5098c7.pdf
 (accessed at 10 July 2019).

 14
Balio T (1985) A novelty spawns small businesses, 1894-1908. In: Balio T (eds) The American
 Film Industry. Wisconsin: The University of Wisconsin Press, pp.3-27.
Banik R (2017) The movies dataset: metadata on over 45,000 movies. 26 million ratings from
 over 270,000 users. Available at: https://www.kaggle.com/rounakbanik/the-movies-dataset
 (accessed at 18 June 2019).
Basuroy S, Desai KK and Talukdar D (2006) An empirical investigation of signaling in the
 motion picture industry. Journal of Marketing Research 43(2): 287-295.
Becker GS and Murphy KM (1988) A theory of rational addiction. Journal of Political
 Economy 96(4): 675-700.
Berg J and Raddick MJ (2017) First you get the money, then you get the reviews, then you get
 the internet comments: a quantitative examination of the relationship between critics,
 viewers, and box office success. Quarterly Review of Film and Video 34(2): 101-129.
Berra J (2008) Declarations of Independence: American Cinema and the Partiality of
 Independent Production. Bristol: Intellect Books.
Blanco VF and Pino JFB (1997) Cinema demand in Spain: a cointegration analysis. Journal of
 Cultural Economics 21(1): 57-75.
Bordwell D (1997) On the History of Film Style. Massachusetts: Harvard University Press.
Cameron A and Trivedi P (1990) Regression-based tests for overdispersion in the Poisson
 model. Journal of Econometrics 46(3): 347-364.
Chen AW (2018) A statistical analysis of gross revenue in movie industry. International
 Journal of Business Management and Economic Research (IJBMER) 9(3): 1276-1280.
Chen X, Chen Y and Weinberg CB (2013) Learning about movies: the impact of movie release
 types on the nationwide box office. Journal of Cultural Economics 37(3): 359-386.
Chuu SLH, Chang JC and Zaichkowsky JL (2009) Exploring art film audiences: a marketing
 analysis. Journal of Promotion Management 15(1-2): 212-228.
Cook DA (2016) A History of Narrative Film. New York: W.W. Norton & Company.
Grainge P (2007) Brand Hollywood: Selling entertainment in a global media age. New York:
 Routledge.
Grimshaw A and Ravetz A (2009) Observational Cinema: Anthropology, Film, and the Social
 Exploration of Social Life. Indiana: Indiana University Press.
Hausman J, Hall BH and Griliches Z (1984) Econometric models for count data with an
 application to the patents-R&D relationship. Econometrica 52(4): 909-938.
Holmlund C (2005) From the margins to the mainstream. In: Holmlund C and Wyatt J (eds)
 Contemporary American Independent Film: From the Margins to the Mainstream. London
 and New York: Routledge, pp.1-17.
Insdorf A (2005) Ordinary people, European-style: or how to spot an independent feature. In:
 Holmlund C and Wyatt J (eds) Contemporary American Independent Film: From the
 Margins to the Mainstream. London and New York: Routledge, pp.23-29.
Jayakard KP and Waterman D (2000) The economics of American theatrical movie exports: an
 empirical analysis. The Journal of Media Economics 13(3): 153-169.
King G (2005) American Independent Cinema. New York: I.B. Tauris & Co Ltd.
Lee S (2002) An economic analysis of the movie industry in Japan. The Journal of Media
 Economics 15(2): 125-139.
Levy E (1999) Cinema of Outsiders: The Rise of American Independent Film. New York and
 London: New York University Press.

 15
Margry K (1992) ‘Theresienstadt’ (1944-1945): the Nazi propaganda film depicting the
 concentration camp as paradise. Historical Journal of Film, Radio and Television 12(2):
 145-162.
Mekas J (2005) Independence for independents. In: Holmlund C and Wyatt J (eds)
 Contemporary American Independent Film: From the Margins to the Mainstream. London
 and New York: Routledge, pp.30-34.
Monaco J (1981) How to Read a Film: The Art, Technology, Language, History, and Theory of
 Film and Media. New York: Oxford University Press.
Pokorny M and Sedgwick J (2010) Profitability trends in Hollywood, 1929 to 1999: somebody
 must know something. Economic History Review 63(1): 56-84.
Scott AJ (2004) Hollywood and the world: the geography of motion-picture distribution and
 marketing. Review of International Political Economy 11(1): 33-61.
Sisto A and Zanola R (2010) Cinema attendance in Europe. Applied Economics Letters 17(5):
 515-517.
Staiger J (1990) Announcing wares, winning patrons, voicing ideals: thinking about the history
 and theory of film advertising. Cinema Journal 29(3): 3-31.
Stead P (1989) The people and the pictures. The British working class and film in the 1930s.
 In: Pronay N and Spring DW (eds) Propaganda, Politics and Film, 1918-45. London: The
 Macmillan Press LTD, pp.77-97.
Tzioumakis Y (2006) American Independent Cinema. Edinburgh: Edinburgh University Press.
Vogel HL (2007) Entertainment Industry Economics: A Guide for Financial Analysis.
 Cambridge: Cambridge University Press.
Walls WD and McKenzie J (2012) The changing role of Hollywood in the global movie market.
 Journal of Media Economics 25(4): 198-219.

 16
You can also read