New data from terp excavations on sea-level index points and salt marsh sedimentation rates in the eastern part of the Dutch Wadden Sea
←
→
Page content transcription
If your browser does not render page correctly, please read the page content below
Netherlands Journal of Geosciences — Geologie en Mijnbouw |97 – 1–2 | 31–43 | 2018                                                      doi:10.1017/njg.2018.2

                      New data from terp excavations on sea-level index points and
                      salt marsh sedimentation rates in the eastern part of the Dutch
                      Wadden Sea

                      Annet Nieuwhof1,∗ & Peter C. Vos2

            1   Groningen Institute of Archaeology, University of Groningen, Poststraat 6, 9712 ER Groningen, the Netherlands
            2   Deltares, Department of Applied Geology and Geophysics, PO Box 85467, 3508 AL Utrecht, the Netherlands
            ∗   Corresponding author: Email: a.nieuwhof@rug.nl

            Manuscript received: 2 May 2017, accepted: 16 February 2018

                      Abstract

            This paper presents new geological data from two terp excavations at Englum and Ezinge, in the Dutch province of Groningen, and compares them
            to similar data from the western part of Friesland, in particular from the terp of Wijnaldum-Tjitsma. This terp is situated at a salt marsh ridge of
            the same height and thickness as Englum and Ezinge, although habitation started 650 years later at Wijnaldum. The measured levels of the tidal-
            flat/salt-marsh boundary underneath these terps make it possible to reconstruct palaeo-Mean High Water (MHW) levels. These sea-level index points
            show that palaeo-MHW in the Groningen part of the Wadden Sea was at the upper limit of the range of palaeo-MHW that has been reconstructed
            for the Dutch Wadden Sea on the basis of data from its western part. The deviating levels indicate that there are differences between regions of
            the Wadden Sea; this has earlier been established for the German section of the Wadden Sea. In the eastern part of the Dutch Wadden Sea, MHW
            nowadays is considerably higher than in the western part of the Wadden Sea; the data suggest that this may have been the case already in the 1st
            millennium BC. Salt marsh levels under dated terp layers make it possible to establish the rate of sedimentation of the developing salt marsh, at
            23–91 cm per century for the pioneer zone and low marsh. This rate of development slowed to 4–5 cm per century for the middle marsh and 3–4 cm
            per century for the high salt marsh.

            Keywords: archaeology, Dutch Wadden Sea, palaeo-MHW levels, salt marsh formation, sedimentation

                      Introduction                                                                 has been thoroughly investigated as part of large archaeolog-
                                                                                                   ical excavation programmes (Vos, 1999; Nicolay, 2010; Vos &
            Geological research has been part of nearly all archaeological                         de Lange, 2010; Nicolay & De Langen, 2015), the province of
            excavations in the northern Netherlands during recent decades;                         Groningen has received less archaeological attention, and there-
            this has been the case since the 1991–1993 excavations of the                          fore also less geological research. This paper will present and
            terp Wijnaldum-Tjitsma in the province of Friesland. Geology not                       discuss the data on the start and development of salt marsh
            only is indispensable for understanding the developing palaeo-                         formation from two excavations in the northwestern part of the
            landscape over time and the relationship between human in-                             province of Groningen, the terps of Englum and Ezinge, and com-
            habitants and the surrounding landscape. Geology also benefits                         pare them to similar data from the excavation in the terp of
            from archaeology because it offers the opportunity to acquire                          Wijnaldum-Tjitsma in northwestern Friesland (Fig. 1). The new
            detailed data and dates on palaeo-levels and on the development                        data enable a calculation of palaeo-sea levels and sea-level in-
            of the salt marsh and the coastal region in general. Archaeol-                         dex points and of the rate of salt marsh formation along the
            ogy has thus offered considerable information for reconstruction                       coast of the present province of Groningen. The comparison be-
            of the coastal evolution of this area (Vos & Gerrets, 2005; Vos,                       tween Ezinge, Englum and Wijnaldum reveals similarities and
            2015). However, not all the coastal regions of the Netherlands                         differences between these locations that must be related to (1)
            have received equal attention. While the province of Friesland                         similar processes of salt marsh formation, and (2) differences in

            C Netherlands Journal of Geosciences Foundation 2018. This is an Open Access article, distributed under the terms of the Cre-
            ative Commons Attribution licence (http://creativecommons.org/licenses/by/4.0/), which permits unrestricted re-use, distribution, and
            reproduction in any medium, provided the original work is properly cited.                                                                                       31
Downloaded from https://www.cambridge.org/core. IP address: 46.4.80.155, on 31 Dec 2020 at 22:47:27, subject to the Cambridge Core terms of use, available at https://www.cambridge.org/core/terms
. https://doi.org/10.1017/njg.2018.2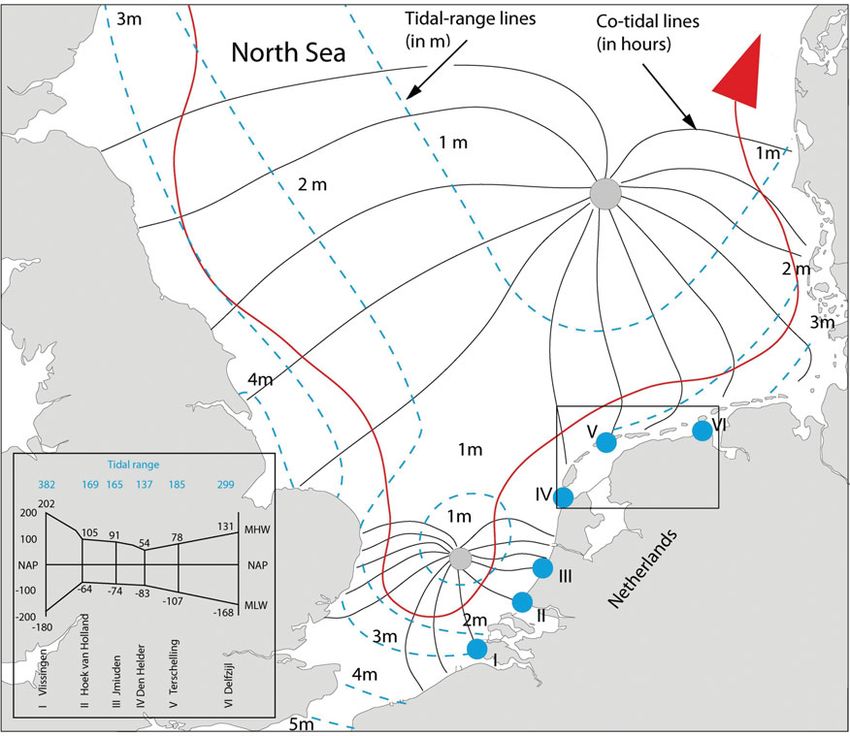
Netherlands Journal of Geosciences — Geologie en Mijnbouw
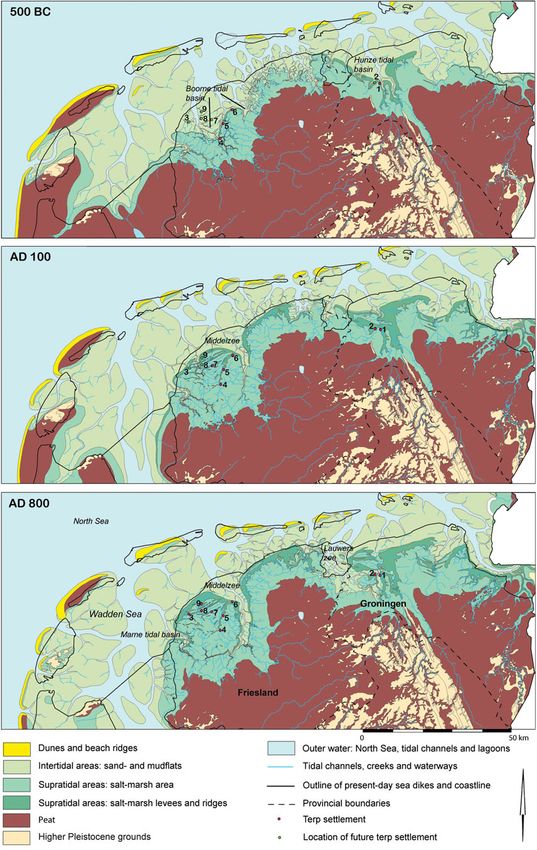
Fig. 1. Palaeogeographical maps, 500 BC, AD 100 and AD 800, with place names and waterways mentioned in the text and in Figure 5. 1: Ezinge; 2: Englum;
3: Wijnaldum; 4: Winsum; 5: Dronrijp; 6: Beetgum; 7: Peins; 8: Dongjum; 9: Tzummarum. Maps: P.C. Vos and S. de Vries, Deltares.
32
Downloaded from https://www.cambridge.org/core. IP address: 46.4.80.155, on 31 Dec 2020 at 22:47:27, subject to the Cambridge Core terms of use, available at https://www.cambridge.org/core/terms
. https://doi.org/10.1017/njg.2018.2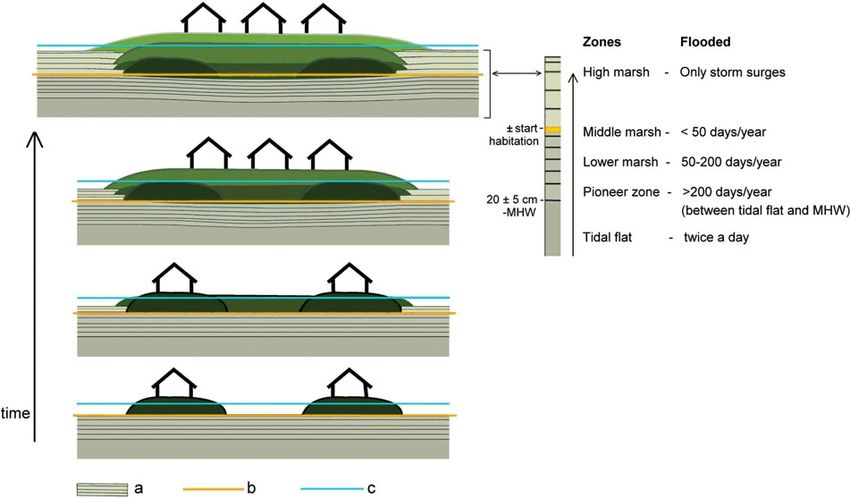
Netherlands Journal of Geosciences — Geologie en Mijnbouw

            Fig. 2. Schematic cross-section through different phases of a developing terp, usually starting on a salt marsh ridge at the level of a low middle marsh.
            Flooding and sedimentation continue during habitation, at a diminishing rate. As the terp increases in height, the subsoil under the terp subsides. Different
            shades of green: anthropogenic terp layers; a: salt marsh deposits; b: horizontal plane; c: level of Extreme High Water. Not to scale. Drawing A. Nieuwhof.

            the palaeo-geography of different tidal basins and of the Wad-                         pansion of the salt marsh since the frequency of inundations is
            den Sea and its barrier islands as a whole. Similar differences                        inversely proportional to the elevation of the surface and the
            have been established for the German section of the Wadden                             distance to the sea.
            Sea by Bungenstock & Weerts (2010, 2012). We aim to establish                             Habitation of the salt marsh region started around 650 BC
            sea-level index points for the Dutch Wadden Sea to increase our                        (Taayke, 2016). Some of the early inhabitants may have lived
            understanding of the relative sea-level rise (RSLR) during the                         directly on high marshes, but that soon changed. Geological
            late Holocene.                                                                         and diatom research indicates that habitation usually started
               The terp area of the northern Netherlands is a former salt                          on a salt marsh ridge or levee that had reached the level of only
            marsh region situated along the southern coast of the Dutch                            a middle marsh (Vos 1999, 2015; Vos & Gerrets, 2005). The great
            Wadden Sea, which was open to the sea until endikement started                         majority of settlements began as raised settlements: people built
            in the 11th or 12th century AD (Vos & Knol, 2015). The Wadden                          their houses on artificial dwelling mounds made of salt marsh
            Sea came into existence around 5000 BC, when the rate of the                           sods, later also of animal dung. These dwelling mounds are de-
            post-glacial sea-level rise decreased up to a point that the net                       fined as terps. The terps started as small house platforms with
            heightening by sedimentation surpassed the RSLR (Beets & Van                           a height of 50–100 cm relative to the surrounding salt marsh.
            der Spek, 2000). The tidal basins were gradually filled in with                        The extent of these artificial elevations was only slightly larger
            tidal deposits, and extensive tidal mudflats and salt marshes                          than the farmhouses constructed on top of them, and presum-
            came into being. Meanwhile, the North Sea coastline moved in-                          ably they must have been sufficiently high to keep dry during
            land; as a result, tidal activity in the basins increased (Vos &                       storm surges. Over time, many of these platforms developed into
            Van Kesteren, 2000). Between 2000 and 1000 BC, deposits be-                            mounds metres high and hundreds of metres in diameter, often
            came sandier because of the increased tidal energy. Salt marsh                         much higher than necessary from the point of view of safety
            ridges or levees, several hundreds of metres wide, formed along                        (Bazelmans et al., 2012; Nieuwhof & Schepers, 2016).
            the seaward margins of the marshes in the tidal basins. The salt                          Inundations and sedimentation continued during habita-
            marsh area not only expanded, the marshes also increased in                            tion. The middle marsh gradually developed into a high marsh
            height; low salt marshes, inundated 50–200 days a year, turned                         (Nieuwhof, 2006). The salt marsh area also kept increasing in
            into middle marshes, inundated up to 50 days a year, and finally                       surface area, at a considerable rate; for instance, between 500 BC
            into high marshes which were inundated only during high storm                          and AD 100 the salt marsh in the Hunze tidal basin in the north-
            surges (Fig. 2). The rate of sedimentation decreased during ex-                        western part of the province of Groningen expanded around 5 km

                                                                                                                                                                            33
Downloaded from https://www.cambridge.org/core. IP address: 46.4.80.155, on 31 Dec 2020 at 22:47:27, subject to the Cambridge Core terms of use, available at https://www.cambridge.org/core/terms
. https://doi.org/10.1017/njg.2018.2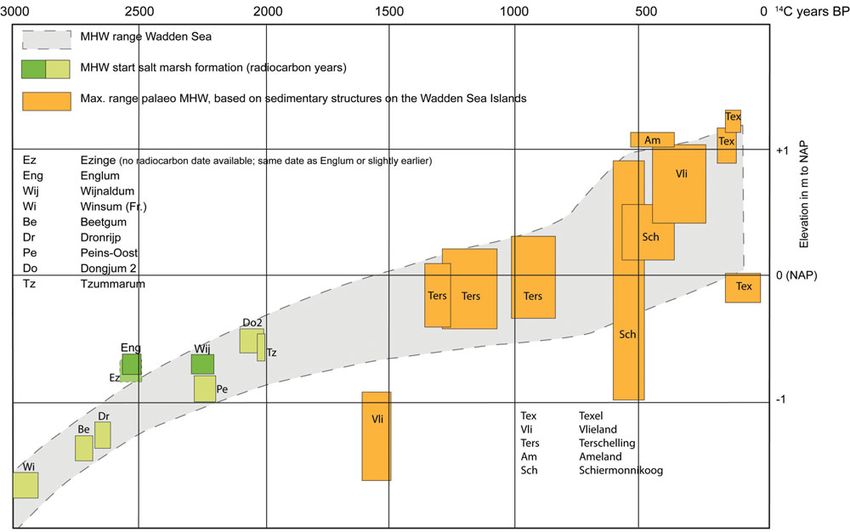
Netherlands Journal of Geosciences — Geologie en Mijnbouw

            to the north (an average of over 8 m a−1 ) (Fig. 1). In the western                    sometimes described, often as sand, as an all-inclusive soil type.
            part of the province of Friesland, a similar increase was estab-                       Some deep cores taken during the excavation reveal that peat,
            lished (Vos & Gerrets, 2005: 73). Newly formed salt marsh ridges                       overlying the Pleistocene subsoil, is found between 9.30 and
            were inhabited by people from older settlements, a process that                        9.80 m −NAP (including correction of −10 cm; see below). Ar-
            continued into the early Middle Ages.                                                  chaeobotanical pioneer W. Beijerinck found leaf fragments of
                Because of the ongoing sedimentation before endikement,                            sedges (Carex) and grasses, a papilionaceous flower, pollen of
            the present surface surrounding terps is often considerably                            grasses, birch (Betula), probably sorrel (Rumex), probably alder
            higher than the original surface under the terps. Under the                            (Alnus), oak (Quercus), and reed (Phragmites), and 32 mostly
            deepest house platforms and datable anthropogenic layers,                              marine diatom species in a sample from this peat layer (Van Gif-
            palaeo-surfaces are sometimes preserved. These make it possible                        fen, 1928: 45–48; find no. 1925/VIII/145). This basal peat layer
            to establish and date the elevation of these palaeo-surfaces in                        was covered by calciferous, undoubtedly tidal deposits that were
            different periods.                                                                     not specified any further. Excavation pictures show that lami-
                                                                                                   nated salt marsh sediments occur wherever sections reach into
                                                                                                   the subsoil (Fig. 3). A radiocarbon date, 2300 ± 65 BP, is avail-
                      Three excavations                                                            able for the first phase of habitation at Ezinge. It is from a post
                                                                                                   from the earliest excavated house, sampled during a small, ad-
            Ezinge was excavated in the 1920s and 1930s, but analysis and                          ditional excavation campaign in 1964 (Van Giffen, 1973). The
            full publication of the excavation results only started in 2011.                       calibrated date of 542–193 cal BC (GrN-4368, 94.0% probabil-
            The discovery in the excavation documentation of a set of notes                        ity; all radiocarbon dates are calibrated with Oxcal 4.2.4) is not
            that enable a reconstruction of the local landscape and that can                       precise enough to be of use, but pottery dates in combination
            be compared to the results of modern research was the incen-                           with the stratigraphy date the beginning of habitation at Ezinge
            tive for writing this article. Both Ezinge and Englum are now                          around 500 BC (Nieuwhof, 2014b).
            situated on the western bank of the present river Reitdiep, but                            The terp of Englum is situated 2 km west of Ezinge. A small
            at the time of colonisation around 500 BC they were located                            excavation in a levelled part of the terp was carried out in 2000
            on a salt marsh ridge on the southwestern bank of the Hunze                            by the Groningen Institute of Archaeology of the University of
            tidal basin (Fig. 1). Ezinge and Englum are compared to Wijnal-                        Groningen. Geological observations were published as part of the
            dum in the western part of Friesland, which was at the time of                         excavation report (Nieuwhof & Vos, 2008). The assumed start
            colonisation in the 2nd century AD located on the northwest-                           of habitation at 450 BC is based on stratigraphy in combina-
            ern coast of a funnel-shaped tidal basin, the west branch of the                       tion with pottery dates (Nieuwhof, 2008). The oldest radiocar-
            Boorne system (Fig. 1). This tidal basin was already silted up to                      bon date is of a dung sample from a house platform that still
            almost the present extent by then (Vos & Gerrets, 2005; Vos &                          covered older anthropogenic features (GrN-25934: 2320 ± 20 BP;
            Knol, 2015).                                                                           406–374 cal BC, 2σ ). Englum and Ezinge are thus comparable,
                Ezinge was excavated between 1923 and 1934 by A.E. van                             not only because they are located near each other on the same
            Giffen, director of the Biological Archaeological Institute of the                     salt marsh ridge, but also in age.
            University of Groningen. Around 1.5 ha of a total of c. 16 ha,                             The terp of Wijnaldum-Tjitsma, excavated between 1991 and
            less than 10% of this large terp, was archaeologically excavated,                      1993, is located in the northwestern part of Friesland. This terp
            while a major part was destroyed for the commercial extraction                         is of a considerably younger date than Ezinge and Englum; habi-
            of fertile earth to be shipped inland to improve poor sandy and                        tation started here in the middle of the 2nd century AD, as
            peaty soils. Despite the relatively limited size of the investi-                       is clear from the stratigraphy, pottery dates and a radiocarbon
            gated area, the archaeological excavation resulted in a substan-                       date of an animal bone (GrN-21393: 1870 ± 30 BP, that is 73–226
            tial dataset, including photographs, finds and hundreds of field                       cal AD, 2σ ). This radiocarbon date belongs to the first phase of
            drawings of the 22 levels that had been excavated in this terp.                        habitation (Gerrets & De Koning, 1999; Lanting & Van der Plicht,
            Van Giffen published the results only in some short, preliminary                       2012).
            articles (Van Giffen, 1926, 1928, 1931, 1936). Full publication                            At Wijnaldum, palaeo-Extreme High Water levels were es-
            began in 2011, with the analysis of the finds (Nieuwhof, 2014a).                       timated on the basis of the heights of hearths on platforms
            This is still underway, now aimed at the habitation history of                         belonging to consecutive habitation phases (Vos, 1999; Vos &
            Ezinge.                                                                                Gerrets, 2005). The heights of platforms and hearths in Ezinge
                Van Giffen had an interest in sea-level change (Van Giffen,                        and Englum cannot be established with the same precision and
            1910, 1933) and made notes on the height of palaeo-surfaces in                         therefore do not allow for similar calculations. There are reli-
            NAP (Dutch Ordnance Datum) on excavation drawings. Charac-                             able heights and dates for the boundary between the tidal flat
            teristics of the subsoil such as lamination were described only                        and the overlying salt marsh deposit from all three excavations.
            from 1932, and then only on a small number of drawings. Earl-                          These allow for a calculation of the level of MHW at the start of
            ier, oxidised or reduced (‘yellow’ or ‘blue’) natural layers are                       salt marsh formation.

                34
Downloaded from https://www.cambridge.org/core. IP address: 46.4.80.155, on 31 Dec 2020 at 22:47:27, subject to the Cambridge Core terms of use, available at https://www.cambridge.org/core/terms
. https://doi.org/10.1017/njg.2018.2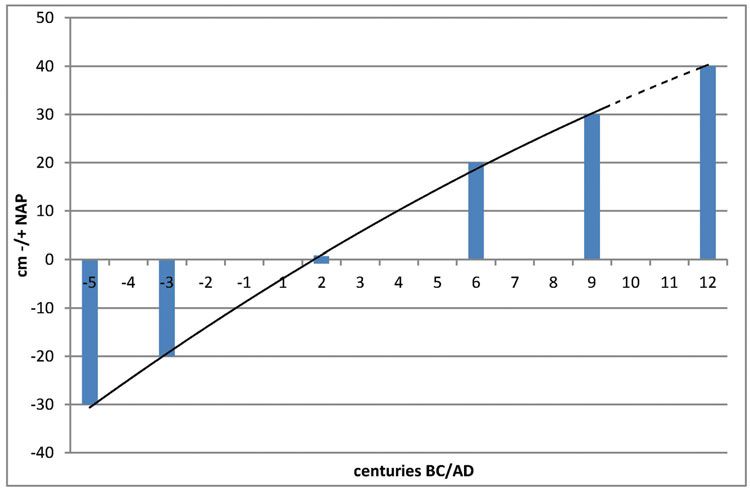
Netherlands Journal of Geosciences — Geologie en Mijnbouw

            Fig. 3. Excavation pictures from Ezinge (1933). Left: house remains from the late pre-Roman Iron Age. Under a level of c. 10 cm −NAP (indicated on the
            column of soil in white letters), alternating sandy and clayey salt marsh layers. They both form salt marsh deposits. The thick dark band in this layered
            sediment belongs to a shallow part of a creek that was still open during the first phase of habitation. Right: The same layers some metres away. The picture
            shows salt marsh layers, covered by the partly anthropogenic fill of the creek; this fill was covered by (partly trampled) salt marsh layers in the late pre-Roman
            Iron Age, before terp layers were applied here. Photos © University of Groningen, Groningen Intstitute of Archaeology.

                      Palaeo-sea-level data                                                        inated deposits were covered by a rather homogeneous layer of
                                                                                                   slightly sandy clay. The top of this layer, at 0.20 m −NAP, was
                  Excavation data                                                                  probably the original surface, homogenised by trampling dur-
                                                                                                   ing the first years of habitation. It is therefore included in the
            The excavation data are summarised in Table 1. The top of the                          salt marsh deposits. The salt marsh deposit on top of the tidal
            salt marsh deposits under the earliest house platforms at the                          flat thus has a thickness of 82 cm. At Wijnaldum, the top of the
            central and highest part of the Ezinge terp was 0.20 m −NAP,                           salt marsh under the earliest platforms was found at 0.15 cm
            as is noted on several field drawings. The height of the tidal-                        −NAP. The top of the tidal-flat deposits under the terp was at
            flat/salt-marsh boundary was noted on one of the excavation                            1.00 m −NAP, and at 0.95 cm −NAP in the margin of the terp;
            drawings from 1933, of the lower part of a profile near the cen-                       salt marsh deposits thus have a thickness of 85 cm.
            tre of the terp, where it was around 4 m high (see Supplementary                           Radiocarbon dates of shells in live position in the top of
            material available online at https://doi.org/10.1017/njg.2018.                         the tidal flat under the salt marsh deposits are available from
            2). The elevation of the top of the tidal deposit under the ear-                       Englum and Wijnaldum. From Englum, two bivalves of Ceras-
            liest salt marsh deposit varies between 0.95 and 1.10 m −NAP                           toderma edule were dated, resulting in consistent outcomes of
            over a distance of 23 m. The NAP heights measured in Ezinge,                           2520 ± 50 BP and 2530 ± 50 BP (GrN-16794 and 16795). The con-
            however, cannot be taken for granted but should be corrected                           sistency allows averaging to 2525 ± 35, that is 800–540 cal BC
            with −10 cm (see below). The top of the tidal flat under the salt                      (2σ ). At Wijnaldum, shells of Scrobicularia plana in life position
            marsh deposit thus ranges between 1.05 and 1.20 m −NAP. That                           were dated 2250 ± 45 BP, 400–200 cal BC (GrN-19581; 2σ ). Here,
            implies that the thickness of the salt marsh deposits here was                         additional dates come from shells in a storm surge layer at 85 cm
            75–90 cm, since the measured 0.20 m −NAP of the surface un-                            −NAP. It was concluded that salt marsh formation started here
            der the oldest anthropogenic features should also be corrected                         between 200 and 175 BC (Vos, 1999: 48).
            with −10 cm. The measurements are corroborated by a boring in
            1977 at the southwestern margin of the terp (www.dinoloket.nl,                               Subsidence and NAP heights
            no. B07A0453), which shows that the boundary between sandy
            clays (probably salt marsh deposits) and underlying fine sand is                       The excavation data derive from research focused on various
            found here at 1.00 m −NAP.                                                             areas and periods; their comparability, especially of measured
                In Englum, the top of the tidal flat sloped down from 0.94 m                       NAP heights, therefore needs to be discussed. Moreover, when
            −NAP in the margin of the terp to 1.02 m −NAP in the centre                            calculating palaeo-levels, subsidence of the subsoil needs to be
            of the terp, where it was 4.2 m high. The top of the laminated                         taken into account, even more so under heavy terp layers. Com-
            salt marsh deposits under the earliest excavated features in the                       paction of the terp layers does not play a role here, since only
            centre of the terp was measured at 0.34 m −NAP, but the lam-                           natural layers underneath the terp are dealt with here.

                                                                                                                                                                            35
Downloaded from https://www.cambridge.org/core. IP address: 46.4.80.155, on 31 Dec 2020 at 22:47:27, subject to the Cambridge Core terms of use, available at https://www.cambridge.org/core/terms
. https://doi.org/10.1017/njg.2018.2
Netherlands Journal of Geosciences — Geologie en Mijnbouw
Table 1. Salt marsh formation and palaeo-Mean High Water levels, and the rate of sedimentation, at Ezinge and Englum (both northwest Groningen) and at
Wijnaldum (northwest Friesland). All radiocarbon dates are calibrated with Oxcal 4.2.4.
Ezinge Engluma Wijnaldumb
Thickness of artificial terp layers 5.70 m 4.20 m 2.60 m
Start salt marsh formation
Elevation (m below NAP)
Top tidal flat under the terp 1.05–1.20c 1.02 1.00
Top tidal flat at the margin (taken 1.00 0.94 0.95
as point of departure, thereby
excluding differences in terp
raising)
Top tidal flat, incl. +2–8 cm for 0.92–0.98 0.86–0.92 0.87–0.93
compaction
Palaeo-MHWd 0.67–0.83 0.61–0.77 0.62–0.78
Contemporaneous MHW range 0.85–1.35 0.85–1.35 0.50–1.05
Frisian Islandse
Dates
Radiocarbon date shells in life − 2× Cerastoderma edule (106 cm Scrobicularia plana (110 cm
position in top tidal flatf −NAP) 2520 ± 50 and −NAP) 2250 ± 45 BP
2530 ± 50 BP (average:
2525 ± 35)
Additional dates Shells in storm surge layer (85
cm −NAP): 175 BCg
Start habitation
Elevation (m below NAP)
Top salt marsh, as measured 0.30c 0.20 0.15
Top salt marsh, incl. +5–15 cm for 0.15–0.25 0.5–0.15 0–0.10
compaction
Dates
Archaeological date 500 BC c. 450 BC AD 150–175
Earliest radiocarbon date: Earliest radiocarbon date (not Earliest radiocarbon date:
2300 ± 65 BP; 542–193 cal from earliest feature): 1870 ± 30 BP
BC (94.0% probability) 2320 ± 20 BP; 406–374 cal BC
(2σ )
Rate of salt marsh formation until the start of habitation
Thickness of salt marsh deposits 75–90 cm 82 cm 85 cm
Starting date salt marsh formation Comparable to Englum 800–540 cal BC (2σ ) 200–175 cal BC (2σ )
in calendar years
Time to form Comparable to Englum 90–350 years 325–350 years
Rate of sedimentation Comparable to Englum 2.3–9.1 mm a−1 2.6 mm a−1
a Nieuwhof & Vos (2008).
b Vos (1999); Vos & Gerrets (2005).
c Measurements for Ezinge are corrected minus 5 cm for the height difference between NWP 1 and 2, and minus 5 cm extra for compaction due to
subsidence in the period between this excavation and the excavations in Englum and Wijnaldum.
d In the pioneer zone, MHW is 20 ± 5 cm above the lowest level of the salt marsh deposits.
e See Fig. 5.
f 13 C values are marine. Not corrected for 13 C fractioning; by not correcting for fractionation, the marine reservoir effect is automatically taken into
account because it has numerically the same value. Strictly speaking, these dates are not BP, since BP implies correction for fractioning (pers. comm.
J. van der Plicht, Centre for Isotope Research, University of Groningen).
g This date was taken as point of departure by Vos (1999), but is replaced here by the slightly earlier date of Scrobicularia plana in the top of the
tidal flat deposit, to make the dates of Englum and Wijnaldum comparable.
36
Downloaded from https://www.cambridge.org/core. IP address: 46.4.80.155, on 31 Dec 2020 at 22:47:27, subject to the Cambridge Core terms of use, available at https://www.cambridge.org/core/terms
. https://doi.org/10.1017/njg.2018.2Netherlands Journal of Geosciences — Geologie en Mijnbouw
The northern Netherlands have been dealing with a RSLR during the 20th century, relative to NAP (the actual RSLR is
since the last Ice Age. During recent millennia, this can be probably higher). Since 1996, when salt extraction started in the
attributed mostly to glacio-isostatic and tectonic subsidence, northwestern part of Friesland near Wijnaldum, the histories of
which over this entire area has caused a RSLR of 5–10 cm per NAP benchmarks show considerable adjustments, amounting to
century over the last 2000 years (Vos & Van Kesteren, 2000), ac- 13 cm between 1997 and 2013 near Wijnaldum. The excavation
celerating to 15–20 cm per century since 1850 (De Mulder et al., at Wijnaldum, however, ended before the beginning of salt ex-
2003: 213). Autocompaction of tidal deposits and of the un- traction. NAP benchmarks near Englum and Ezinge do not seem
derlying peat beds is an additional cause of subsidence in the to be strongly affected by the large-scale gas extraction in the
coastal area of the northern Netherlands. As was mentioned northeastern part of the province of Groningen, which started
above, the basal peat bed at Ezinge is found between 9.30 and in 1963. Between 1957 and 1997, the benchmark of Englum
9.80 m −NAP. At Englum, basal peat is found at around 10 m subsided at an average rate of 0.8 cm per decade; in and near
−NAP (www.dinoloket.nl, no. B07A0100). Both at Ezinge and Ezinge, subsidence amounted to 0.9 cm per decade between 1942
Englum, the basal peat is covered by tidal sediments without and 1997.
peat layers. At Wijnaldum, Holocene sandy tidal channel de- The NAP benchmarks used during these three excavations are
posits are found directly on the Pleistocene subsoil, at a depth known from the excavation archives. The NAP reference heights
of 12–15 m −NAP. The upper metres consist of very fine tidal applied in Wijnaldum and Englum are from 1982 and 1991
flat sands, which hardly settle (Baardman in Vos, 1999). Here, respectively, in a period without conspicuous changes, which
only the upper c. 1 m of this deposit is taken into account. It makes them easily comparable. Both benchmarks are within a
is assumed that the underlying tidal deposits were consolidated short distance of the excavated areas. In Ezinge, the nearest
when salt marsh formation began. benchmark was 3.8 km to the east, in the village of Garnwerd.
The salt marsh was naturally drained during low tides before Its published height (Rijkswaterstaat, 1925) was from the first
terps were built. Compaction due to drainage was included in the NWP of 1875–1887; after the second NWP between 1926 and
calculations of compaction of the salt marsh deposit for Wijnal- 1940 it was lowered considerably. Similar adjustments were nec-
dum (Baardman in Vos, 1999). Underneath a terp, a freshwater essary in the entire northern part of the Netherlands then, and
lens will form over time, more or less as it will below dunes can partly be ascribed to actual subsidence compared to NAP
(Bakker, 1981). Despite impenetrable clay and dung layers in since the first NWP (Waalewijn 1979: 113ff.). The correctness of
a terp, water can seep into the subsoil via ditches and ponds. the measurements of the first NWP, however, is to be doubted,
Wells on terps are dug into these lenses. The highest level of a especially in the northern Netherlands (Waalewijn 1979: 126),
freshwater lens is higher than the surface surrounding a terp. so these numbers cannot be used to calculate subsidence back
The natural subsoil underneath is therefore relatively well pro- into the 19th century.
tected against dehydration, even if the polder datum is kept at Considering the changes in the reference heights of NAP
a low level. It may be assumed that compaction due to dehydra- benchmarks, contemporaneous excavations are clearly preferred
tion stopped once the natural surface became covered by terp for comparisons over excavations that are far apart in time. If
layers. Ezinge had been excavated in the same period as Englum and
Subsidence and settling of buildings and roads are included Wijnaldum, its measured NAP heights would have been around
in the regular adjustments of the heights of NAP bench- 10 cm lower: −5 cm correction for NWP 2, and another −5 cm to
marks. These heights are not related to the actual sea level allow for compaction between 1930 and 1990. A correction of
but to the fundamental benchmark in Amsterdam that was −10 cm is therefore applied to all NAP heights measured during
established in 1683, via a network of underground bench- the excavation in Ezinge.
marks that are founded in relatively stable sand layers. The Subsidence of the top of the salt marsh and the top of
underground network also needs regular adjustment, the so- the tidal-flat deposits under the terp has been calculated for
called Nauwkeurigheidswaterpassingen (NWP, ‘precision level- Wijnaldum-Tjitsma. Subsidence of the top of the tidal-flat de-
lings’). Two of these NWPs, the second (1926–1940) and the fifth posits there due to the weight of the overlying salt marsh de-
(2005), have resulted in considerable adjustments (Waalewijn, posit was established at 2–8 cm (Baardman in Vos, 1999). The
1979; Brand et al., 2004). The second NWP is especially relevant top of the salt marsh under this terp subsided, due to auto-
when comparing Ezinge to the later excavations of Wijnaldum compaction and dehydration, between 5 and 15 cm (Baardman
and Englum. in Vos, 1999). Since the composition of the subsoil, consisting
NAP heights used in Wijnaldum and Englum belong to the of clastic sediments up to a depth of 6 m or more, is the same
second NWP, while NAP heights of Ezinge are from the first NWP. in Ezinge and Englum, these same numbers can be adopted for
The table in the Supplementary material (available online at these terps as well. The amount of salt marsh subsidence here
https://doi.org/10.1017/njg.2018.2) shows the histories of the will be closer to 15 cm than to 5 cm, considering the heights of
NAP benchmarks that are relevant here. These histories indicate the terps of Englum and Ezinge (4.2 m and 5.7 m) compared to
subsidence in the northern Netherlands of 0.5–1 cm per century the terp of Wijnaldum-Tjitsma (2.6 m).
37
Downloaded from https://www.cambridge.org/core. IP address: 46.4.80.155, on 31 Dec 2020 at 22:47:27, subject to the Cambridge Core terms of use, available at https://www.cambridge.org/core/terms
. https://doi.org/10.1017/njg.2018.2Netherlands Journal of Geosciences — Geologie en Mijnbouw
Results and discussion part (Vos & Gerrets, 2005: 71). The salt marsh ridge of Wijnal-
dum only formed when the tidal basin was nearly filled in and
Reconstructing palaeo-MHW the energy of wind and waves was directed differently. In the
Hunze tidal basin, the entire southern coast of the basin seems
The height of the boundary between the top of the tidal flat to have been subjected to a relatively high tidal energy and
deposits and the base of the laminated salt marsh deposits is sediment supply by which several broad salt marsh ridges were
closely related to the contemporaneous MHW level and can thus created over time. This difference between the Boorne and the
generate reliable sea-level index points for the Dutch Wadden Hunze tidal basins may be caused by their different positions in
Sea (Vos & Gerrets, 2005; Vis et al., 2015). The boundary between the Wadden Sea.
the top of the tidal-flat deposits and the deepest crinkly lam- Rather than the mean sea level, it is the level of MHW that
ination characteristic of salt marsh deposits, which represents is related to salt marsh formation. MHW is not only determined
the start of salt marsh formation, is 20 ± 5 cm below palaeo- by the mean sea level, but also by many other drivers such as
MHW level (Roep & Van Regteren Altena, 1988: 226). That it the morphology of the tidal system and the size and location of
represents the start of salt marsh formation is supported by the the tidal inlets between the Wadden Sea Islands, factors which
occurrence of unbroken diatoms of the species Scoliopleura tu- have changed over time. There are considerable local fluctua-
mida, which belongs to the zone just below or around palaeo- tions, within tidal basins and in the Wadden Sea at large. The
MHW level, in the lower part of the salt marsh deposits at Wijnal- present situation is shown in Figure 4. MHW in the eastern part
dum (Vos, 1999: 49). In Table 1, 20 ± 5 cm below palaeo-MHW is of the Wadden Sea, the Groningen region, is considerably higher
applied to the top tidal flat / base salt marsh boundary that has nowadays than it is in the western part of the Wadden Sea, ran-
been established at Ezinge, Englum and Wijnaldum, to calculate ging from 0.54 +NAP near Den Helder in the extreme west to
palaeo-MHW levels. 1.31 +NAP near Delfzijl, at the northeast coast of the province
Comparison of Ezinge and Englum with Wijnaldum (Table 1) of Groningen (also Kiden et al., 2008). The tidal range (between
shows strong similarities in NAP levels of the top of the salt MHW and Mean Low Water, MLW) today ranges from 137 cm near
marsh and the top of tidal-flat deposits under the salt marsh, Den Helder to 299 cm in Delfzijl. These differences are related
and also in the corresponding palaeo-MHW levels, despite the to the geography of the North Sea coast and the location of the
period of 650 years between them. This similarity is remarkable amphidromic points in the North Sea. MHW in the western part
because around 500 BC, when the first settlers arrived in Ezinge, of the Wadden Sea was even lower before the Afsluitdijk (En-
the mean sea level in the northern Netherlands was considerably closure Dike) closed off the Zuiderzee in 1932 (Misdorp et al.,
lower than it was 650 years later, when Wijnaldum became in- 1989). The higher tidal range and MHW indicate that the tidal
habited in the course of the 2nd century AD. The difference energy in the eastern part of the Wadden Sea must be consider-
amounts to 33–65 cm, giving a rate of sea level rise of 5–10 cm ably higher than in the western part.
per century over these years (Vos & Van Kesteren, 2000). The The palaeo-MHW levels established for Englum and Ezinge can
surface of the salt marsh at Ezinge compared to the mean sea be compared to the range of MHW in the Wadden Sea that has
level at the time of colonisation must have been considerably been reconstructed by De Groot & De Gans (1996) on the basis
higher than it was at Wijnaldum (also 33–65 cm). What caused of research on the Frisian Islands. This range was adapted and
these similarities? extended to earlier periods, first by Vos & Gerrets (2005) and
The start and rate of salt marsh formation are influenced by then by Vos & Waldus (2012), on the basis of additional data
several interconnected factors: the relative sea-level rise, the from terp excavations in the western part of Friesland, including
supply of sediment, the fetch of waves, the storm frequency, Wijnaldum (Fig. 5). These terps are from different periods and a
and the location in a tidal basin. To start salt marsh forma- variety of locations in the funnel-shaped Boorne tidal basin, at
tion on top of the tidal flats, sedimentation on the marsh the east and the west of the basin (Fig. 1). Figure 5 shows that,
must outreach the relative sea-level rise; a long fetch creates while the MHW-level ranges that can be established for these
higher and stronger waves and thus larger sediment transport. Frisian terps all fall within a rather narrow range, even those
In exposed parts of the salt marsh margins the deposited sed- from the eastern and sandier part of the Boorne tidal basin, En-
iment fraction is coarser than in relatively sheltered parts. glum and Ezinge exceed the upper limit of the reconstructed
The salt marsh morphology is strongly determined by these range. This reconstructed range of MHW in the Wadden Sea,
effects. which is based on data from the western part of the Wadden
Since both Wijnaldum and Englum/Ezinge were situated in Sea, does not seem to be applicable to the eastern part of the
the western part of a funnel-shaped basin, the influence of the Wadden Sea. The reason might be that the differences in MHW
geometry of the tidal basin can be ignored. However, it is clear and tidal range between the eastern and western parts of the
that the prevailing winds and sufficient sediment supply to- Wadden Sea already existed in the 1st millennium BC. Of course,
gether formed sandier salt marsh ridges and at an earlier stage this hypothesis is based on data from only two terp locations
in the eastern part of the Boorne tidal basin than in the western only 2 km apart. Many more data are required to establish a
38
Downloaded from https://www.cambridge.org/core. IP address: 46.4.80.155, on 31 Dec 2020 at 22:47:27, subject to the Cambridge Core terms of use, available at https://www.cambridge.org/core/terms
. https://doi.org/10.1017/njg.2018.2Netherlands Journal of Geosciences — Geologie en Mijnbouw
Fig. 4. Differences in tidal ranges and the levels of high and low tide are related to the distance from the amphidromic point in the North Sea and to the
morphology of the coastlines. The map shows the tidal wave of the North Sea and the tidal range difference as they are now along the present coastline.
Inset: Mean High Water, Mean Low Water and tidal range of six locations along the Dutch coast. Rectangular: the study area of this paper. From Vos (2015).
reliable MHW curve for the Hunze tidal basin or the eastern tors such as the stage of the salt marsh, developing from middle
part of the Dutch Wadden Sea as a whole. stage to high salt marsh; the amount and nature of the available
sediment; the location near or further from the shore; and the
The rate of salt marsh formation local tidal energy.
At Wijnaldum, the 85 cm of salt marsh underneath the terp,
The thickness of the laminated salt marsh deposits, combined the pioneer and lower salt marsh stages, took 325 years to form.
with established dates of the start of salt marsh formation and The average rate of sedimentation thus amounts to 2.6 mm a−1
of habitation make it possible to calculate the rate of salt marsh or 26 cm per century (Vos, 1999: 65–66). This sedimentation
formation in its early stages, from the pioneer zone up to the rate lies between the lower sedimentation rate of less than
middle marsh, when habitation began (Table 1). The data from 1.2 mm a−1 or 12 cm per century for salt marshes on the south
Ezinge make it possible to follow the rate of salt marsh forma- side of the Wadden Sea coastal barrier islands and the much
tion also later, from the beginning of habitation to the start of higher sedimentation rate of over 10 mm a−1 or 100 cm per cen-
endikement. The salt marsh developed from a middle marsh to tury for salt marshes in estuaries along the North Sea coast of
a high marsh during this period. Van Giffen (1933) used these the Netherlands, Great Britain and Germany (De Leeuw et al.,
data to calculate a relative sea-level rise of 3–4 cm per century, 1993; Olff et al., 1997).
since he assumed a one-to-one relationship between the eleva- The thickness of the salt marsh deposits in Englum and Ezinge
tion of the salt marsh over time and relative sea-level rise. How- is nearly the same. The date of the start of salt marsh formation
ever, more than to relative sea-level rise, the rate of salt marsh in Ezinge is unknown, but in Englum the start of salt marsh
formation after the beginning of habitation is related to fac- formation was dated, on the basis of radiocarbon dates of shells
39
Downloaded from https://www.cambridge.org/core. IP address: 46.4.80.155, on 31 Dec 2020 at 22:47:27, subject to the Cambridge Core terms of use, available at https://www.cambridge.org/core/terms
. https://doi.org/10.1017/njg.2018.2Netherlands Journal of Geosciences — Geologie en Mijnbouw
Fig. 5. The level of Mean High Water at the start of salt marsh formation in Ezinge, Englum and Wijnaldum, against the background of the range of MHW
in the Wadden Sea that was first estimated by De Groot & De Gans (1996) on the basis of data from Wadden Sea Islands and that was later adapted on
the basis of excavation data from Frisian terps by Vos & Waldus (2012). Englum and Ezinge are outliers, possibly because of a different tidal regime in the
Hunze tidal basin or in the eastern part of the Dutch Wadden Sea area as a whole.
in life position, between 800 and 540 cal BC. Pottery research from the elevation data under terp layers was surprisingly con-
indicates that Englum was inhabited from around 450 BC. If salt stant, as Figure 6 shows. However, subsidence of old surfaces
marsh formation began in 800 BC, the average rate of salt marsh due to compaction should be taken into account. Between 500
formation was 23 cm a−1 ; if it started in 540 BC, the average BC and AD 600, around 5 cm of sediment was deposited every
rate was 91 cm per century. The latter is improbable if it is 100 years if the actual measurements are taken as a lead. Be-
compared to the average rate of 26 cm per century that was tween the 6th and 12th centuries AD, the rate of sedimenta-
calculated for Wijnaldum, but not impossible. If MHW was higher tion slightly decreased to 3–4 cm per century. Allowing for com-
and the tidal range was larger in the eastern part of the Wadden paction under the terp, starting at 15–25 cm −NAP, the curve
Sea, that may have caused a higher rate of sedimentation in of Figure 6 is slightly less steep, and the rate of sedimentation
this area, closer to the average sedimentation rate of marshes in is lower, respectively around 4 and 3 cm per century.
estuaries. These numbers are very low if they are compared to the rate
At Ezinge, undisturbed surfaces under archaeologically dated of salt marsh formation of the pioneer and low salt marsh under
layers were preserved not only under the earliest platforms, the oldest terp layers as calculated for Englum, of 23–91 cm per
but also at several other locations. The archaeological dates of century. As the salt marsh developed and became higher, the
the overlying terp layers date these surfaces. Their elevation in number of inundations and the rate of sedimentation strongly
combination with these dates give an indication of the devel- decreased. Moreover, the geography changed in this same pe-
oping salt marsh over time, from middle marsh at the begin- riod. At the beginning of habitation, Ezinge and Englum were
ning of habitation around 500 BC up to high marsh at the time coastal settlements (Fig. 1). Owing to the expanding salt marsh,
of endikement, around AD 1200 (Fig. 6). The elevation around they had become inland settlements at AD 100, though still situ-
AD 1200 is estimated at 0.40 m +NAP here. The present sur- ated in a salt marsh as botanical research has shown for Englum
face elevation around the former terp varies between 0.35 and (Nieuwhof & Woldring, 2008). By AD 800, several new water-
0.95 m +NAP, but since 1200, inundations due to breaches in the courses had come into existence near Ezinge and Englum, in-
Reitdiep dike and agricultural activity have changed the original cluding the river Reitdiep directly north of these terps, owing
surface height. The rate of sedimentation that can be inferred to a new tidal basin, the Lauwerszee. Tidal influences must have
40
Downloaded from https://www.cambridge.org/core. IP address: 46.4.80.155, on 31 Dec 2020 at 22:47:27, subject to the Cambridge Core terms of use, available at https://www.cambridge.org/core/terms
. https://doi.org/10.1017/njg.2018.2Netherlands Journal of Geosciences — Geologie en Mijnbouw
Fig. 6. The elevation of the salt marsh surface as measured under platforms and terp layers, from the 5th century BC to the 12th century AD in Ezinge. NAP
heights are corrected with −10 cm (see text). Data are available for the 5th and 3rd centuries BC and the 2nd, 6th and 9th centuries AD. The elevation in
the 12th century is an estimate, based on the height of the present surface right outside the terp. The trend line suggests a constant rate of sedimentation
for a large part of this period, though slightly diminishing from the 6th century AD. Due to compaction, the actual surface levels were slightly higher and
the trend line correspondingly less steep.
regained importance in this period, but apparently caused less Wadden Sea. Today, MHW is considerably higher and the tidal
sedimentation than in earlier periods. range is much larger in the eastern part of the Wadden Sea than
in the western part. The data suggest that this may already have
been the case in the 1st millennium BC.
Conclusion The elevation of the boundary between the top of the tidal
flat and the base of the salt marsh under these terps provides
The terp excavations of Englum (excavated in 2000) and Ezinge sea-level index points: the level of MHW at the time of the start
(excavated 1923–1934 but analysed only recently) have pro- of salt marsh formation can be inferred from this boundary. If
duced new data on the start of salt marsh formation and the plotted in the reconstructed range of MHW levels in the Wadden
elevation of the salt marsh at the beginning of habitation in the Sea of the past 3000 years, the palaeo-MHW levels calculated
1st millennium BC in the western part of the province of Gronin- for Ezinge and Englum are found at and over the upper limit of
gen. Although these are few data, they are consistent and offer this range. This confirms earlier research in the German part of
the opportunity to compare this little-studied area with a geo- the Wadden Sea by Bungenstock and Weerts (2010, 2012): it is
logically better-known region, that of the western part of the not possible to establish one, general MHW sea-level curve for
province of Friesland. the entire Wadden Sea region. Regional differences need to be
The comparison of Ezinge/Englum with the terp of considered.
Wijnaldum-Tjitsma in the western part of the province of Fries- Regional circumstances also play an important role in the
land shows remarkable similarities as well as a major difference. rate of salt marsh formation, since it is driven by interdepen-
The similarities are in the levels of the tidal flat at the start dent factors such as the supply of sediment; the location near
of salt marsh formation (0.94–1.00 m −NAP), the thickness of or further from the shore; and the local tidal and wave energy.
the salt marsh deposits (75–90 cm), and the elevation of the In Wijnaldum, the rate of sedimentation before the beginning
salt marsh at the beginning of habitation (0.15–0.30 m −NAP). of habitation, at the stage of the pioneer and lower salt marsh,
The similarity is striking in the light of the different dates: at was established at 26 cm per century. In Englum and Ezinge,
Ezinge habitation began 500 BC and in Englum 450 BC, but at it was between 23 and 91 cm per century. After habitation be-
Wijnaldum around AD 150. gan, inundations and sedimentation continued. The excavations
It is possible that the differences in the start of salt marsh in Ezinge provide data on the basis of which the rate of sedi-
formation and of habitation between these regions are related mentation during habitation, when the salt marsh developed
to differences in the tidal amplitude in different parts of the from middle to high marsh, can be followed over the centuries.
41
Downloaded from https://www.cambridge.org/core. IP address: 46.4.80.155, on 31 Dec 2020 at 22:47:27, subject to the Cambridge Core terms of use, available at https://www.cambridge.org/core/terms
. https://doi.org/10.1017/njg.2018.2Netherlands Journal of Geosciences — Geologie en Mijnbouw
Sedimentation was considerably slower than during the forma- Beets, D.J., Fischer, M.M. & de Gans, W. (eds): Coastal studies on the Holocene
tion of the pioneer and low salt marsh under the terp. Still, it of the Netherlands. Rijks Geologische Dienst (Haarlem): 229–250.
continued steadily, despite changes in the regional geography. de Leeuw, J., de Munck, W., Olff, H. & Bakker, J.P., 1993. Does zonation reflect
Between 500 BC and AD 600, the salt marsh gained 4–5 cm in the succession of salt-marsh vegetation? A comparison of an estuarine and a
height each century, developing from a low middle marsh to a coastal bar island marsh in The Netherlands. Acta Botanica Neerlandica 42:
high marsh; after AD 600 the rate of sedimentation slightly de- 435–445.
creased to 3–4 cm per century. de Mulder, E.F.J., Geluk, M.C., Ritsema, I.L., Westerhoff, W.E. & Wong, T.E.,
2003. De ondergrond van Nederland. Wolters-Noordhoff (Groningen/Houten):
Acknowledgements 379 pp.
Gerrets, D.A. & de Koning, J., 1999. Settlement development on the Wijnaldum-
The analysis of the excavation results of Ezinge began in 2011, Tjistma terp. In: Besteman, J.C., Bos, J.M., Gerrets, D.A., Heidinga, H.A. & de
owing to a grant from the Netherlands Organisation of Scientific Koning, J. (eds.): The excavations at Wijnaldum. Reports on Frisia in Roman
Research (NWO). The project continues as part of the project and Medieval times. Volume I. Balkema (Rotterdam/Brookfield): 73–124.
Terpen- en Wierdenland. Een verhaal in ontwikkeling (‘The terp Kiden, P., Makaske, B. & van de Plassche, O., 2008. Waarom verschillen de
region. A developing story’), a project largely funded by the zeespiegelreconstructies voor Nederland? Grondboor en Hamer 62: 54–61.
14
Dutch Waddenfonds. We want to thank Rijkswaterstaat for pro- Lanting, J.N. & van der Plicht, J., 2012. De C-chronologie van de Neder-
viding the histories of NAP benchmarks, and Prof. J. van der landse pre- en protohistorie VI: Romeinse tijd en Merovingische periode, deel
Plicht (Centre for Isotope Research, University of Groningen) B: aanvullingen, toelichtingen en 14C-dateringen. Palaeohistoria 53/54: 283–
for data on 13 C fractioning and marine reservoir effects in shell 391.
samples. Misdorp, R., Steyaert, F., De Ronde, J. & Hallie, F., 1989. Monitoring in the
We are very grateful to the reviewers for their valuable com- western part of the Dutch Wadden Sea – sea level and morphology. Helgoland
ments, and to Dr Gary Nobles for his English text correction. Marine Research 43: 333–345.
Nicolay, J.A.W. (ed.), 2010. Terpbewoning in oostelijk Friesland. Twee op-
gravingen in het voormalige kweldergebied van Oostergo (= Groningen Ar-
Supplementary material chaeological Series 10). Barkhuis/Groningen University Library (Groningen):
321 pp.
To view supplementary material for this article, please visit
Nicolay, J.A.W. & de Langen, G. (eds), 2015. Graven aan de voet van de Achlumer
https://doi.org/10.1017/njg.2018.2
dorpsterp. Archeologische sporen rondom een terpnederzetting (= Jaarversla-
gen van de Vereniging voor Terpenonderzoek 97). Vereniging voor Terpenon-
References derzoek (Groningen): 221 pp.
Nieuwhof, A., 2006. Changing landscape and grazing: macroremains from the terp
Bakker, T.W.M., 1981. Nederlandse kustduinen – Geohydrologie. Pudoc (Wagenin- Peins-east, province of Friesland, the Netherlands. Vegetation History and Ar-
gen): 189 pp. chaeobotany 15: 125–136.
Bazelmans, J., Meier, D., Nieuwhof, A., Spek, T. & Vos, P., 2012. Understanding Nieuwhof, A., 2008. Aardewerk. In: Nieuwhof, A. (ed.), De Leege Wier van Englum.
the cultural historical value of the Wadden Sea region. The co-evolution of Archeologisch onderzoek in het Reitdiepgebied. Vereniging voor Terpenonder-
environment and society in the Wadden Sea area in the Holocene up until early zoek (Groningen): 47–75.
modern times (11,700 BC–1800 AD): an outline. Ocean & Coastal Management Nieuwhof, A. (ed.), 2014a. En dan in hun geheel. De vondsten uit de opgravingen
68: 114–126. in de wierde Ezinge. Vereniging voor Terpenonderzoek (Groningen): 255 pp.
Beets, D.J. & van der Spek, A.J.F., 2000. The Holocene evolution of the barrier and Nieuwhof, A., 2014b. De geschiedenis van Ezinge in scherven. Handgevormd
the back-barrier basins of Belgium and the Netherlands as a function of late aardewerk van 500 v.C. tot 1500 n.C. In: Nieuwhof, A. (ed.): En dan in hun
Weichselian morphology, relative sea-level rise and sediment supply. Geologie geheel. De vondsten uit de opgravingen in de wierde Ezinge. Vereniging voor
en Mijnbouw / Netherlands Journal of Geosciences 79: 3–6. Terpenonderzoek (Groningen): 30–128.
Brand, G.B.M., van Brussel, G., ten Damme, J.H. & Gerritsen, J., 2004. Her- Nieuwhof, A. & Schepers, M., 2016. Living on the edge: synanthropic salt marshes
berekening van het primaire net van het NAP. Verbetering precisie en betrouw- in the coastal area of the Northern Netherlands from around 600 BC. Archae-
baarheid ten behoeve van de nieuwe NAP publicatie (= AGI/GAP-04/004): 42 ological Review from Cambridge 31: 48–74.
pp. Nieuwhof, A. & Vos, P.C., 2008. Landschap en bewoningsgeschiedenis. In:
Bungenstock, F. & Weerts, H.J.T., 2010. The high-resolution Holocene sea-level Nieuwhof, A. (ed.): De Leege Wier van Englum. Archeologisch onderzoek in
curve for Northwest Germany: global signs, local effects or data-artefacts? In- het Reitdiepgebied. Vereniging voor Terpenonderzoek (Groningen): 19–30.
ternational Journal of Earth Sciences 99: 1687–1706. Nieuwhof, A. & Woldring, H., 2008. Botanische resten. In: Nieuwhof, A. (ed.),
Bungenstock, F. & Weerts, H.J.T. 2012. Holocene relative sea-level curves for the De Leege Wier van Englum. Archeologisch onderzoek in het Reitdiepgebied.
German North coast. International Journal of Earth Sciences 101: 1083–1090. Vereniging voor Terpenonderzoek (Groningen): 160–176.
de Groot, T.A.M. & de Gans, W., 1996. Facies variations and sea-level response in Olff, H., de Leeuw, J., Bakker, J.P., Platerink, R.J. & van Wijnen, J., 1997.
the lower Rhine–Meuse area during the last 15000 years (the Netherlands). In: Vegetation succession and herbivory in a salt marsh: changes induced by sea
42
Downloaded from https://www.cambridge.org/core. IP address: 46.4.80.155, on 31 Dec 2020 at 22:47:27, subject to the Cambridge Core terms of use, available at https://www.cambridge.org/core/terms
. https://doi.org/10.1017/njg.2018.2Netherlands Journal of Geosciences — Geologie en Mijnbouw
level rise and silt deposition along an elevational gradient. Journal of Ecology Horton, B.P. (eds): Handbook of sea-level research. Wiley & Sons (Chichester):
85: 799–814. 514–535.
Rijkswaterstaat, 1925: Register I Groningen. Hoogte van verkenmerken volgens Vos, P.C., 1999. The Subatlantic evolution of the coastal area around the
N.A.P. gevonden bij de nauwkeurigheidswaterpassingen. Technische Boekhan- Wijnaldum-Tjitsma terp. With a contribution by B.A.M. Baardman. In: Beste-
del Waltman (Delft): 50 pp. man, J.C., Bos, J.M., Gerrets, D.A., Heidinga, H.A. & De Koning, J. (eds): The
Roep, T.B. & van Regteren Altena, J.F., 1988. Paleotidal levels in tidal sediments excavations at Wijnaldum. Reports on Frisia in Roman and medieval times 1.
(3800–3635 BP); compaction, sea-level rise and human occupation (3275–2620 Balkema (Rotterdam/Brookfield): 33–72.
BP) at Bovenkarspel, NW Netherlands. In: de Boer, P.L., van Gelder, A. & Nio, Vos, P.C., 2015. Origin of the Dutch landscape. Long-term landscape evolution
S.D. (eds): Tide influenced sedimentary environments and facies. D. Reidel of the Netherlands during the Holocene, described in visualized in national,
Publishing Company (Dordrecht): 215–231. regional and local palaeogeographical map series. Barkhuis (Groningen):
Taayke, E. 2016. Het Noord-Nederlandse kustgebied in de vroege ijzertijd. In: 359 pp.
Nieuwhof, A. (ed.): Van Wierhuizen tot Achlum. Honderd jaar archeologisch Vos, P.C. & de Lange, G., 2010. Geolandschappelijk onderzoek: de vorming van
onderzoek in terpen en wierden, Vereniging voor Terpenonderzoek (Gronin- het landschap voor en tijdens de terpbewoning en het ontstaan van de Lauw-
gen): 69–82. erszee. In: Nicolay, J.A.W. (ed.): Terpbewoning in oostelijk Friesland. Twee
van Giffen, A.E., 1910. Het dalingsvraagstuk der Alluviale Noordzeekusten, in terpopgravingen in het voormalige kweldergebied van Oostergo. Barkhuis &
verband met bestudeering der terpen. Tijdschrift voor geschiedenis, land- en Groningen University Library (Groningen): 63–94.
volkenkunde 25: 258–294. Vos, P.C. & Gerrets, D.A., 2005. Archaeology, a major tool in the reconstruction
van Giffen, A.E., 1926. Resumé van de in de laatste vereenigingsjaren verrichte of the coastal evolution of Westergo (northern Netherlands). Quaternary In-
werkzaamheden ten behoeve van de terpenvereeniging. Jaarverslagen van de ternational 133–134: 61–75.
Vereniging voor Terpenonderzoek 9–10:. 9–35. Vos, P.C. & Knol, E., 2015. Holocene landscape reconstruction of the Wadden
van Giffen, A.E., 1928. Mededeeling omtrent de systematische onderzoekingen, Sea area between Marsdiep and Weser. Explanation of the coastal evolu-
verricht in de jaren 1926 en 1927, ten behoeve van de terpenvereeniging, in tion and visualisation of the landscape development of the northern Nether-
Friesland en Groningen. Jaarverslagen van de Vereniging voor Terpenonder- lands and Niedersachsen in five palaeogeographical maps from 500 BC to
zoek 11–12: 30–44. present. Netherlands Journal of Geosciences / Geologie en Mijnbouw 94:
van Giffen, A.E., 1931. Mededeeling omtrent het systematisch onderzoek, ver- 157–183.
richt in de jaren 1928, 1929 en 1930. Jaarverslagen van de Vereniging voor Vos, P.C. & van Kesteren, W.P., 2000. The long-term evolution of inter-
Terpenonderzoek 13–15: 16–46. tidal mudflats in the Northern Netherlands during the Holocene: natu-
van Giffen, A.E., 1933. De terp te Ezinge. De Ingenieur 48: 313–315. ral and anthropogenic processes. Continental Shelf Research 20: 1687–
van Giffen, A.E., 1936. Der Warf in Ezinge, Provinz Groningen, Holland, und seine 1710.
westgermanische Häuser. Germania 20: 40–47. Vos, P.C. & Waldus, W.B., 2012. Landschap en bewoning: over terpen,
van Giffen, A.E., 1973. Nogmaals Ezinge. In: van Es, W.A., Archeologie en Historie; kwelderwallen en de bedijkingsgeschiedenis. In: Waldus, W.B. (ed.): Mid-
opgedragen aan Prof. Dr. H. Brunsting bij zijn 70ste verjaardag. Fibula/Van deleeuwse bewoningssporen bij Beetgumermolen (= ADC-rapport 3213). ADC-
Dishoeck (Bussum): 49–86. ArcheoProjecten (Amersfoort): 62–65.
Vis, G.-J., Cohen, K.M., Westerhoff, W.E., ten Veen, J.H., Hijma, M.P., van der Waalewijn, A. 1979. De tweede nauwkeurigheidswaterpassing van Nederland
Spek, A.J.F. & Vos, P.C., 2015. Paleogeography. In: Shennan, I., Long, A.J. & 1926–1940. Rijkscommissie voor Geodesie (Delft): 165 pp.
43
Downloaded from https://www.cambridge.org/core. IP address: 46.4.80.155, on 31 Dec 2020 at 22:47:27, subject to the Cambridge Core terms of use, available at https://www.cambridge.org/core/terms
. https://doi.org/10.1017/njg.2018.2You can also read