Leonardo, Raritan Bay and
Sandy Hook Bay, New Jersey Coastal Storm
Risk Management Feasibility Study

Appendix C Engineering

March 2015
←
→
Page content transcription
If your browser does not render page correctly, please read the page content below
Leonardo, Raritan Bay and Sandy Hook Bay, New Jersey Coastal Storm Risk Management Feasibility Study Appendix C Engineering March 2015
Leonardo, NJ Feasibility Study

Engineering and Design Appendix

March 2015

Table of Contents

C-1. Introduction ................................................................................................... 5
   C-1.1 Description of the Study Area ................................................................. 5
   C-1.2 Characteristics and Problem Identification of Study Area ....................... 5
   C-1.3 Existing Features .................................................................................... 7
   C-1.4 Prior Federal Studies .............................................................................. 9
C-2. Existing Conditions ..................................................................................... 10
   C-2.1 Currents ................................................................................................ 10
   C-2.2 Water Surface Elevations..................................................................... 10
      C-2.2.1 FEMA Stage Frequency and Wave-Frequency for Future Conditions
      (2067) including Sea Level Change (SLC) ................................................... 12
   C-2.3 Storms .................................................................................................. 16
   C-2.4 Regional Geology ................................................................................. 17
   C-2.5 Coastal Structure Evaluation ................................................................ 19
   C-2.6 Existing Beach Parameters .................................................................. 19
   C-2.7 Historic Shoreline Change Analysis ...................................................... 20
   C-2.8 Selection of Long-Term Erosion Rates ................................................. 21
C-3. Without-Project Existing and Future Conditions ......................................... 21
   C-3.1 Without-Project Existing and Future Conditions for the Dune/Beach
   Reach .............................................................................................................. 22
   C-3.2 Without-Project Existing and Future Conditions for the Bulkhead Reach
   ........................................................................................................................ 24
   C-3.3 Price Level for Without-Project Existing and Future Conditions............ 24
C-4. Development of Alternatives ....................................................................... 25

                                                             2
C-4.1 Structural alternatives ........................................................................... 25
   C-4.2 Nonstructural alternatives ..................................................................... 26
C-5. Tentatively Selected Plan ........................................................................... 28
   C-5.1 Evaluation of Structures........................................................................ 29
      C-5.1.1 Inventory of Structures ................................................................... 29
      C-5.1.2 Sorting of Structures....................................................................... 29
      C-5.1.3 Criteria for inclusion to plan N1 and N5 .......................................... 30
      C-5.1.4 Excel Formulas created from Flow Charts...................................... 30
      C-5.1.5 Revisions to Structure List.............................................................. 31
      C-5.1.5.1 Structures Removed from Alternative N1 .................................... 31
      C-5.1.5.2 Structures Removed from Alternative N5 .................................... 31
C-6. Proposed Structural Treatments ................................................................. 39

List of Figures
Figure 1: Location Map ........................................................................................ 5
Figure 2: Wave Height and Period Frequencies ................................................ 11
Figure 3: Graph of Three Rates of Sea Level Change ....................................... 15
Figure 4: Alternative N1 ..................................................................................... 33
Figure 5: Alternative N5 ...................................................................................... 34
Figure 6: Residential Flowchart........................................................................... 35
Figure 7: Residential Flowchart (continued)........................................................ 36
Figure 8: Non-Residential Flowchart ................................................................... 37
Figure 9: Non-Residential Flowchart (continued) ................................................ 38
Figure 10: Type A Proposed Structural Treatment.............................................. 39
Figure 11: Type B Proposed Structural Treatment.............................................. 40
Figure 12: Type C Proposed Structural Treatment ............................................. 41
Figure 13: FEMA Sub Zones Map....................................................................... 42

List of Tables
Table 1: Dredging Volumes ................................................................................. 8
Table 2: Tidal Datums ........................................................................................ 12
Table 3: Stage-Frequency ................................................................................. 13

                                                        3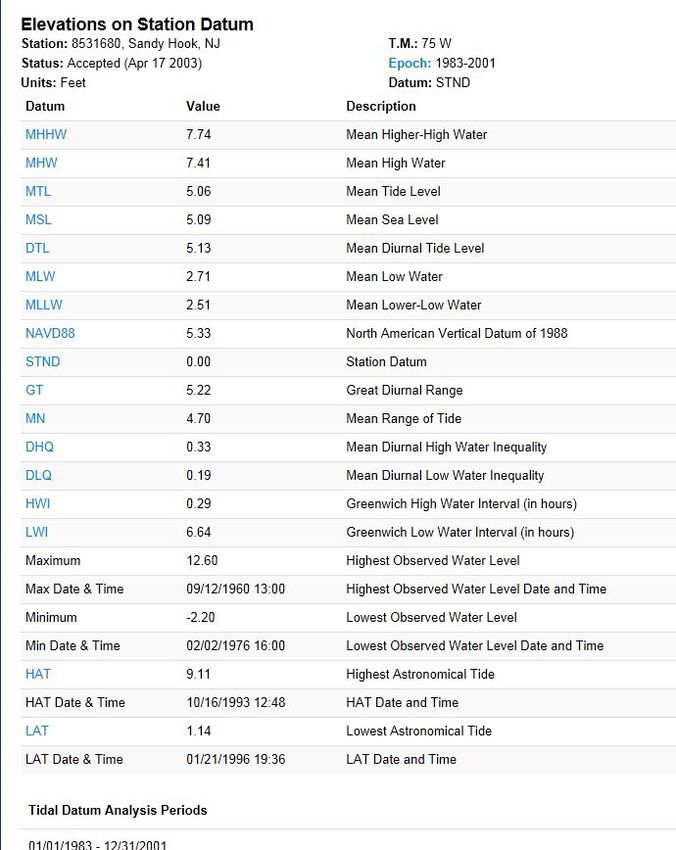
Table 4: Future Stage-Frequencies ................................................................... 14
Table 5: Tabular Rates of Sea Level Change .................................................... 15
Table 6: Existing Coastal Structures .................................................................. 20
Table 7: Existing Beach Parameters .................................................................. 21
Table 8: Advantages and Disadvantages of Structural Plans ............................ 26
Table 9: Advantages and Disadvantages of Nonstructural Plans ...................... 27
Table 10: Summary of Alternatives Costs .......................................................... 28
Table 11: Structure Inventory Codes ................................................................. 30
Table 12: Structure List and Results for TSP ...................................................... 32

                                                    4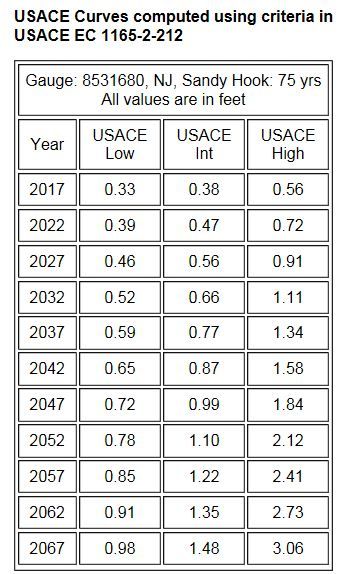
C-1. Introduction

C-1.1 Description of the Study Area
Leonardo is located in the northeastern portion of the Township of Middletown in
Monmouth County, New Jersey. It approximates 0.5 square miles, and is
bounded by Sandy Hook Bay to the north, Wagner Creek to the east, the pier at
US Naval Weapons Station Earle to the west, and New Jersey State Route 36 to
the south. The Leonardo State Marina divides the shoreline of Leonardo. Figure 1
shows the location map.

Figure 1: Location Map

C-1.2 Characteristics and Problem Identification of
Study Area
Leonardo’s topography is dominated by a small knoll with a maximum elevation
of about +39 ft North American Vertical Datum of 1988 ( NAVD 88). The
shoreline areas are of low elevation and subject to storm induced flooding and in

                                        5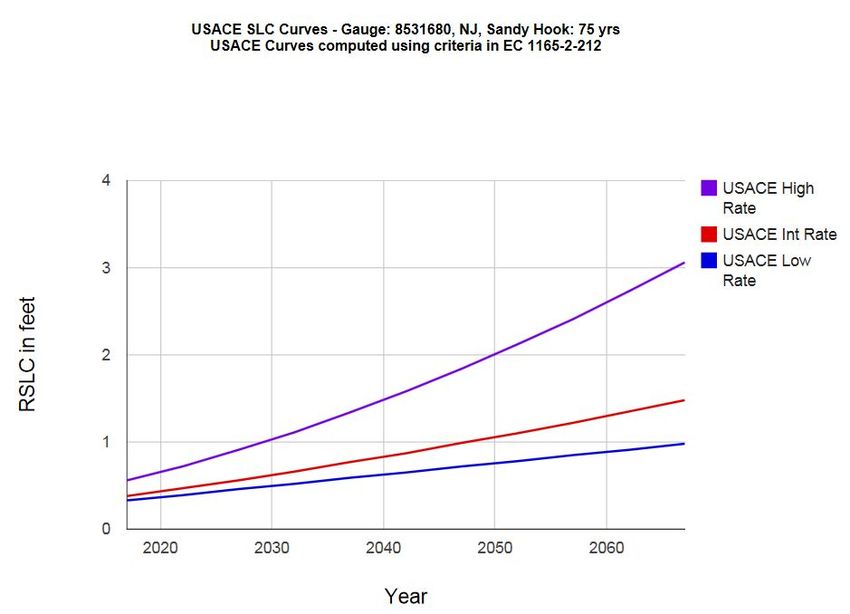
some locations, erosion and/or wave damage. Water levels at Leonardo reached
+11.7 ft NAVD88 during Hurricane Sandy. In the aftermath of Hurricane Sandy,
approximately 250 FEMA claims were filed in Leonardo. Shoreline features, from
west to east, are described in further detail below.

The pier at US Naval Weapons Station Earle (traps as a groin)

This formation of a sand bar under the pier may be creating a littoral barrier.

Marsh Reach

A marsh characterizes the western shoreline between the pier at US Naval
Weapons Station Earle to the west and the Leonardo State Marina jetties to the
east. A low narrow beach with no significant dune fronts a wide low-lying marsh
(extending approximately 2,000 ft inland). Residential areas landward of the
marsh are subject to tidal and storm-induced flooding. At the mouth of the
wetland creek in this marsh, a small ebb shoal is growing.

Leonardo State Marina

The Leonardo State Marina is located at the center of Leonardo, and is stabilized
by two timber jetties. The shoreline is offset across the harbor entrance, with the
west side having a well-developed fillet. In the last half century, the shoreline
adjacent to the harbor jetties has not changed significantly. Bulkhead
repair/replacement is performed periodically by the New Jersey Department of
Environmental Protection (NJDEP). Low-lying areas surrounding the marina are
subject to frequent tidal and storm-induced flooding.

Beach and Dune Reach

The center section of Leonardo (east of the marina) consists of a beach and dune
system, extending approximately 1,500 ft. to the east to the intersection of Beach
and Leonard Aves., and contains five timber groins. The dune itself is vegetated
and broken by several pedestrian-induced low elevation areas. The groins are
highly effective, stabilizing the shoreline. The shoreline has maintained its size in
the last half century. Each groin has a distinct down drift offset. A comparison of
the 1961 and 1974 aerial photographs shows one offset grew substantially. Net
littoral drift is to the east based upon fillets to the west side of the groins and
offsets to the east. During significant storms in 1992, 2011, and 2012 the
intersection of Beach and Leonard Ave. was undermined and washed out by
waves.

                                         6
Bulkhead Reach
The eastern portion of shoreline between Leonard Ave and Wagner Creek is
armored with seawalls and timber bulkheads in poor to fair condition. The
shoreline in this location is eroded to the structure line. Minimal dry sand fronts
most of these structures. Portions of this reach with no bulkheads, poor condition
bulkheads, or low elevation bulkheads are subject to storm-induced flooding. A
groin and a bulkhead that acts as a groin trap sand and are effective. A distinct
offset is apparent at these structures, but the shoreline has not changed in the
last half century. During the significant storm event in 1992, Hurricane Irene in
2011 and Hurricane Sandy in 2012 many of the bulkheads themselves
experienced wave damage and were repaired or replaced by local owners.
However, no damage to buildings was experienced.
Wagner Creek
Leonardo has experienced storm surge induced flooding , along the banks of
Wagner Creek. A terminal groin adjacent and west of Wagner Creek effectively
traps sand. Ten existing storm water outfalls discharge directly into Wagner
Creek. Wagner Creek additionally accepts drainage from upland areas to the
south of Leonardo.
C-1.3 Existing Features
Existing features include Federal Navigation and State Marina projects.
Leonardo Channel
This channel is 8 ft deep and 150 ft wide, and extends from the Leonardo State
Marina jetties approximately 2,500 ft into Sandy Hook Bay. Initial channel
dredging removed 71,592 cubic yards (cy) in 1958, and maintenance operations
occurred in 1967, 1991 and 2014; 56,717 cy, 60,412 cy and 35,000 cy,
respectively, as shown on Table 1. The average dredging rate from the period
between initial dredging and 2014 is approximately 2,700 cy/yr. There are no
plans for future dredging.
US Naval Weapons Station Earle Pier Channel
The Navy dredged Piers 2, 3, and 4 in 1997 and 2002 whereby 513,794 cy and
262,518 cy, respectively, was removed and placed at the Mud Dump Site. 56,170
cy of material was dredged in 2003, and was placed in an upland facility. The
material contained less than 10% sand. The Navy replaced Pier 3, reducing its
7length and deepening the adjacent grade from –36.1 ft. NAVD88 to –46.1 ft.
NAVD88 in 2008. The 2008 dredging quantity was 318,000 cy which went to the
Mud Dump Site. The average dredging rate between 1997 and 2008 is shown in
Table 1.
State Marina Dredging
Several State Marina dredging operations occurred during the period between
1982 and the present: 17,800 cy in 1982; 16,000 cy in 1986; 200 cy in 1993, and
2,500 cy in 2003. The resulting maintenance-dredging rate from 1982-2003 is
approximately 1,700 cy/yr. These values are shown in Table 1. Dredging was
tentatively planned for 2014, but did not occur.
Table 1: Dredging Volumes
Leonardo Federal Channel Dredging Operations
Year Type Volume
1957 Initial 71,592 cy
1967 Maintenance 56,717 cy
1991 Maintenance 60,412 cy
2014 Maintenance 35,000 cy
Sum Maintenance 152,129 cy
Avg. Rate 1957-2014 2,700 cy/yr
Earle Naval Pier Dredging Operations
Year Location Volume
1997 Peirs 2, 3, and 4 513,794 cy
2002 Peirs 2, 3, and 4 262,518 cy
2003 Unknown (C-1.4 Prior Federal Studies
Preliminary Examination of Navy Breakwater (1946)
Concluded that breakwaters and dredging desired by the U.S. Navy are not
justified from a commercial navigation standpoint and that the work can best be
accomplished with military funds.
Survey Report (1960)
A shore protection project at Leonardo was found to be uneconomic after detailed
investigation, although the preliminary analysis indicated the possibility for
improvement.
Reconnaissance Report (1996)
The Reconnaissance Report recommended Leonardo for further study noting
institutional constraints such as gate impacts to navigation interests, and
numerous private shorefront ownerships.
Pre-Feasibility Report (1998)
The following economically justified proposed plan of improvement for Leonardo
included construction of a coastal storm risk management dune and beach fill
section, bounded by a terminal groin at Wagner Creek to the east and by the
Marina jetty to the west. A floodwall and stone revetment was proposed at the
eastern end of the fill to tie into higher ground and to prevent storm surge from
entering the study area from Wagner Creek. A closure (sector type) gate was
proposed at the Marina entrance to provide protection against storm surge
entering into the study area through the Marina, along with adding a bulkhead for
a 350 ft section fronting existing bulkhead to raise elevation to +13.9 ft NAVD88
on the eastern jetty/bulkhead tip to provide required improvement height. A
second floodwall was proposed on the western side of the Marina (extending
south from the closure gate along the edge of Concord Ave, approximately 1,200
ft in length) tying into high ground to protect against storm surge from entering
the western part of the study area west of the Marina. A third floodwall was
proposed along a short segment (approx. 200 lf) of Burlington Ave to prevent
storm surge from entering the western study area behind the wetlands area.
Elevation or flood proofing was proposed for the residential structures prone to
residual flooding damage (outside of the proposed line of coastal storm risk
management).
9C-2. Existing Conditions
C-2.1 Currents
Tidal currents along the shore of the study area are generally weak except at the
entrances to Raritan and Shrewsbury Rivers where the average velocity at
strength of the current is 1.8 and 2.6 knots, respectively. A large part of the tidal
circulation in the bay occurs in relatively deep-water along an east-west axis
approximately 2 miles offshore from the study area.
C-2.2 Water Surface Elevations
Stage-frequency curves for existing conditions were acquired from FEMA for the
project location. The stage-frequency curves for the entire region were developed
through surge and wave modeling of a suite of synthetic design storms using the
ADCIRC (ADvanced CIRCulation)+SWAN (Simulating WAves Nearshore)
models. More information on how FEMA develops stage-frequency can be found
at http://www.r3coastal.com/home/storm-surge-study. The stage frequency data
were taken directly from FEMA without manipulation, although an adjustment was
made to get the stage data into the NAVD88 datum. The FEMA stage-frequency
curves are referenced to the Mean Sea Level (MSL) datum, so a shift to the
NAVD88 datum was necessary for this particular project. The datum conversion
from the MSL datum to the NAVD88 datum was calculated to be 0.24 feet. This
conversion factor was used since the Sandy Hook gauge is located relatively
close to the project site. Table 2 contains the datum information for the Sandy
Hook Gauge. The NAVD88 datum is located approximately 1.1 feet above the
National Geodetic Vertical Datum of 1929 (NGVD29) datum. Therefore, the
conversion for all elevations shown in this report is as follows:
NAVD88 = NGVD29 - 1.1 feet.
The raw ADCIRC+SWAN output, which includes peak surge elevation and
associated significant wave heights and mean wave periods, was processed to
estimate statistical wave parameters. Figure 2 displays the results of a regression
analysis which determines the 20, 10, 6.7, 5, 4, 2, 1.3, 1, 0.4, 0.2, and 0.1%
annual chance exceedance wave parameters. The peak surge elevation each of
the synthetic storms is plotted against the associated significant wave height and
peak wave period. From this trend, we can estimate the wave heights for different
surge elevations. Plugging the 20, 10, 6.7, 5, 4, 2, 1.3, 1, 0.4, 0.2, and 0.1%
chance surge elevations gives the associated waves for each frequency. The
results of this regression analysis give the required wave-frequency information.
Table 3 contains the resulting stage and wave frequency curves for Node
395391, located offshore of the project site (N 40.42437, W 74.05972), and also
for the average onshore stage frequency with wave effects included.
10Figure 2: Wave Height and Period Frequencies
11Table 2: Tidal Datums
C-2.2.1 FEMA Stage Frequency and Wave-Frequency for Future
Conditions (2067) including Sea Level Change (SLC)
Stage and frequency data for future conditions were not available from FEMA.
To determine future condition hydraulic boundary conditions, Sea Level Change
rates were determined using the methodology outlined in two USACE
publications, “Procedures to Evaluate Sea Level Change: Impacts, Responses,
and Adaptation” (ETL 1100-2-1), and “Incorporating Sea Level Change in Civil
Works Programs” (ER 1110-2-8162).
12A website tool (www.corpsclimate.us/ccaceslcurves.cfm) was used to estimate
the SLC rates at the Sandy Hook gauge, which is located near the project site.
Section C-5 includes a discussion of the effects on the project if sea level change
is greater than the historic levels that were used in the design.
Table 3: Stage-Frequency
2014 Average
FEMA 2014 Onshore Mean
Annual Chance of Offshore Node Still Water
Exceedance (%) 395391 Mean Still Elevation in ft. Significant Peak Wave
Water Elevation in NAVD88 including Wave Height, Period, Tp,
ft. NAVD88 wave effects Hs, in ft. in seconds
20% 6.6 7.9 2.8 3.8
10% 7.9 8.3 3.1 3.9
6.7% 8.6 8.9 3.3 4.0
5% 9.1 9.3 3.4 4.0
4% 9.5 9.7 3.5 4.1
2% 10.6 10.8 3.7 4.2
1.3% 11.3 11.5 3.9 4.3
1% 11.9 12.0 4.0 4.3
0.4% 13.6 13.8 4.6 4.5
0.2% 15.0 15.3 4.8 4.7
0.1% 16.4 16.8 5.1 4.8
The three curves displayed in Figure 3 give rates for the low, intermediate and
high estimates of SLC. Table 5 contains the tabular SLC data for the Sandy
Hook gauge. Assuming the project begins in 2017 and ends in 2067, the
incremental SLC value is +0.7 ft for the low estimate, +1.1 ft for the intermediate
estimate, and +2.5 ft for the high estimate. To determine future condition stage-
frequency data, the incremental SLC rates are added directly to the base
condition curve. For example, if the 20% chance 2017 stage is +6.6 ft NAVD88,
the future 2067 low-SLC 1% chance flood stage would become +7.3 ft NAVD88,
which is a 0.7 ft increase. Significant wave heights and peak wave periods for
future conditions were developed by plugging in the future condition surge values
into the same trend lines developed for 2017 conditions. The higher future
condition surge elevations produce large waves. Table 4 contains the stage-
frequency and wave-frequency data for the offshore node 395391 and for the
average onshore frequency for the 2067 condition, for low, intermediate, and high
SLC rate.
The methodology described above gives information for Node 395391 (offshore
of the project site). The stage-frequency and wave-frequency curves were
developed for all structure locations using the same methodology described
previously.
13Table 4: Future Stage-Frequencies
2014
FEMA 2014 Average
Offshore Onshore Peak
Annual Significant
Sea Level Node 395391 1Mean Still Wave
Chance of Wave
Year Change Mean Still Water Period,
Exceedance Height, Hs,
Scenario Water Elevation in Tp, in
(%) in ft.
Elevation in ft. NAVD88 seconds
ft. NAVD88 including
wave effects
2067 Low/Historic 20% 7.3 8.5 2.9 3.9
2067 Low/Historic 10% 8.6 9.0 3.2 4.0
2067 Low/Historic 6.7% 9.3 9.6 3.4 4.1
2067 Low/Historic 5% 9.7 10.0 3.5 4.1
2067 Low/Historic 4% 10.1 10.3 3.6 4.2
2067 Low/Historic 2% 11.3 11.5 3.9 4.3
2067 Low/Historic 1.3% 12.0 12.1 4.1 4.3
2067 Low/Historic 1% 12.5 12.7 4.2 4.4
2067 Low/Historic 0.4% 14.2 14.5 4.6 4.6
2067 Low/Historic 0.2% 15.7 16.0 5.0 4.7
2067 Low/Historic 0.1% 17.0 17.4 5.3 4.9
2067 Intermediate 20% 7.7 8.0 3.0 3.9
2067 Intermediate 10% 9.0 9.4 3.4 4.0
2067 Intermediate 6.7% 9.7 10.0 3.5 4.1
2067 Intermediate 5% 10.2 10.4 3.6 4.1
2067 Intermediate 4% 10.6 10.7 3.7 4.2
2067 Intermediate 2% 11.7 11.9 4.0 4.3
2067 Intermediate 1.3% 12.4 12.6 4.2 4.3
2067 Intermediate 1% 13.0 13.1 4.3 4.4
2067 Intermediate 0.4% 14.7 14.9 4.7 4.6
2067 Intermediate 0.2% 16.1 16.4 5.1 4.8
2067 Intermediate 0.1% 17.5 17.8 5.4 4.9
2067 High 20% 9.1 10.5 3.4 4.1
2067 High 10% 10.4 10.8 3.7 4.2
2067 High 6.7% 11.1 11.4 3.9 4.3
2067 High 5% 11.6 11.8 4 4.3
2067 High 4% 12.0 12.1 4.1 4.3
2067 High 2% 13.1 13.3 4.4 4.5
2067 High 1.3% 13.8 14.0 4.5 4.5
2067 High 1% 14.4 14.5 4.7 4.6
2067 High 0.4% 16.1 16.3 5.1 4.8
2067 High 0.2% 17.5 17.8 5.4 4.9
2067 High 0.1% 18.9 19.2 5.8 5.1
14Figure 3: Graph of Three Rates of Sea Level Change
Table 5: Tabular Rates of Sea Level Change
15C-2.3 Storms
Some of the more significant storms affecting the study area are described
below.
25 Nov 1950 (Hurricane)
Boats and piers in Leonardo were severely damaged by tide and wave action.
Highest water level recorded at Sandy Hook gage was 7.5 ft. above MSL
(of1950).
6-7 Nov 1953 (nor’easter)
4,000 ft. of bulkhead located between Leonardo and Atlantic Highlands was
destroyed. Approximately 15 residences were inundated between 2 and 4 ft.
above the 1st floor, and were structurally damaged by undercutting.
12 Sept 1960 (Hurricane Donna)
The jetties at the marina were damaged, and homes along the shore suffered
minor damage due to flooding. Highest water level recorded at Sandy Hook gage
was 8.6 ft above MSL (of 1960).
6-8 March 1962 (nor’easter)
Minor damage was reported at Leonardo. Considerable amounts of debris were
deposited around residences and marina. Highest water level recorded at Sandy
Hook gage was 7.6 ft above MSL (of 1962).
12 March 1984 (nor’easter)
In Leonardo, erosion of the beaches and dune escarpment accompanied street
and property flooding near Wagner Creek. Retaining walls were undermined by
high water removing sand. Extensive erosion occurred east of the harbor to the
harbor light. Highest water level recorded at Sandy Hook gage was +6.0 ft
NAVD88.
1611-13 Dec 1992 (nor’easter)
During the December 1992 nor’easter, low-lying homes adjacent to the marina
suffered significant flood damage. The beach experienced severe erosion
damage. The road was undermined and washed out due to erosion damage.
Bulkheads and seawalls/revetments were severely damaged or destroyed.
Highest water level recorded at Sandy Hook gage was +7.6 ft NAVD88.
12-14 March 1993 (Blizzard)
The Blizzard of March 11-12, 1993 was called the "Storm of the Century". It
caused above average flooding for coastal and riverine areas in Monmouth
County.
12 March 2010 (nor’easter)
A nor’easter impacted NJ on March 12, 2010. Winds gusted up to 70 mph. The
recorded peak stage at Keansburg was +7.01 ft NAVD88. Leonardo experienced
flooding, and destruction of the town's 9/11/memorial.
26-28 Aug 2011 (Hurricane Irene)
Hurricane Irene struck Little Egg Harbor in NJ on Aug 28. 200,000 homes and
building were damaged, and damages in the state reached $1 billion. Flooding
was widespread in Central Jersey. Leonardo experienced fallen trees, flooding,
erosion damage to beaches and roads.
29-30 October, 2012 (Hurricane Sandy)
Within Middletown Township (Leonardo is an unincorporated community within
Middletown: 322 structures experiences superficial damage (lost tiles, shingles,
more severe damage to lighter structures); 98 had minor damage (missing roof
segments; destroyed or displaced lighter structures); 8 had major damage
(missing roofs, partial collapse of structure walls); and 3 structures were
completely destroyed or washed away. The highest water level recorded at the
Sandy Hook gage was +11.7 ft NAVD88.
C-2.4 Regional Geology
The study area lies within the Coastal Plain Province, which forms the eastern
margin of the State of New Jersey. Its surface has a gentle slope to the
17southeast, generally not exceeding 5 or 6 ft to the mile. The surface of the plain
extends eastward with the same gentle slope beneath the Atlantic Ocean for
about 100 miles to the end of the continental shelf, where the depth is
approximately 100 fathoms. At this point, the ocean bottom drops abruptly to
greater depths. The moderate elevation of the Coastal Plain, which rises to 400
ft in some areas, but is generally lower than 200 ft, has prevented the streams
from cutting valleys of any considerable depth. Throughout the greater portion of
the plain, the relief is insignificant and the streams flow in open valleys that lie at
only slightly lower levels than the broad, flat divides.
The study area, which is contained in Monmouth County, lies in the area that is
above the sea level. This sub aerial portion is generally a dissected plain that
rises gradually from sea level at the coast to nearly 400 ft in central New Jersey.
It then declines to a broad shallow depression less than 100 ft above sea level
extending to the Delaware River at Trenton. Some conspicuous features of the
sub aerial portion of the plain are the marshes, which border the stream courses
and the submerged or drowned valleys, which were formed by erosion when the
land was at a higher elevation than at present. During the geologic history, the
sea level fluctuated to a large extent. The rise and fall of the water resulted in
wide migration of the shoreline across the Coastal Plain. The sub aerial region
was especially influenced by these fluctuations during the Cretaceous Period.
The Cretaceous Period resulted in many successive sedimentary formations,
each of which was subject to erosion, deposition, submersion, and emergence.
Realizing that weathering and its associated agents determined all of New
Jersey’s geomorphology; this geological period had great influence on the study
area. The resulting Cretaceous formations are composed of unconsolidated
sand, clay, and greensand marl (glauconitic), which dip 25 ft to 60 ft per mile to
the southeast and having a thickness in places of 500 ft to 1,000 ft. The
sediments rest on a sloping formation of deep-seated hard rocks. The present
surface features were most recently determined during the glacial Pleistocene
Period and by subsequent erosion.
The subsurface geology of the Coastal Plain has been determined by study and
correlation of well logs and by interpretation of seismic profiles. The Coastal
Plain consists of Cretaceous to Recent sediments lapping on the basement
material, which is composed of crystalline rock with locally infolded or infaulted
Triassic sediments. The basement surface slopes at about 75 ft per mile,
reaching a depth of more than 6,000 ft near the coast. The soils overlying the
bedrock are of considerable thickness exceeding several hundred ft., and are of
the Upper Cretaceous and Tertiary Period. The oldest and therefore the deepest
formation, which rests unconformably on the bedrock is the Raritan (Magothy)
formation. It consists of dark lignitic sand and clay containing some glauconite at
the top overlying light colored sands and clays.
The Mechanville and Woodbury clay formations overlay the Raritan formation
18discomformably. Both formations are black, glauconitic, micaceous clay, the
former being slightly more plastic and firmer than the latter. To the southeast of
Waycake Creek (the western boundary of the Keansburg project area), the upper
formation, the Englishtown sand, outcrops at the surface along Creek Road, and
extends southeastward to Highlands under the recent swamp deposits at Pews
Creek (the eastern boundary of the Keansburg project area). It reaches its
maximum thickness at the Highlands where some of the beds have been
cemented by iron oxide. This material overlays the Woodbury clay formation and
it represents a period of emergence. The Englishtown sand consists of a white
and yellow quartz sand, slightly micaceous.
With the final uplift of the land and withdrawal of the Cretaceous sea, streams
established themselves across the emerging sea bottom. This ushered in the
Cenozoic Era. Periods of submergence and emergence were the dominating
geological force, but with the exception of a very shallow deposit of sand referred
to as the Cape May formation, no other soil material from this era is found in the
project area. The Cape May formation is an interglacial formation deposited by
streams and overland deposition at the close of the last glacial period. The sea
again invaded the area and created valleys, which have been filling with recent
swamp material and sediment.
Considering the age of the Cretaceous materials, estimated by geologists to be
120 to 150 million years old and all the intervals of submergence and deposition,
and emergence and erosion, one would expect these soils to be very firm on the
basis that they have been subjected to relatively high prestresses. However, the
clay materials were found to be nominally consolidated and very soft.
C-2.5 Coastal Structure Evaluation
A structure condition survey was conducted in Leonardo in 1957 and is contained
in the 1960 Survey Report. A survey of the condition of coastal structures was
conducted in 2001, and the results were compared to the 1957 conditions in
Table 6.
C-2.6 Existing Beach Parameters
Beach profiles collected September 1999 along Leonardo were assessed for
common parameters. One beach profile, collected in the study area between
May and July 1957, was also assessed for comparison. Existing beach
characteristics are shown in Table 7. Dune elevations in the study area vary
between +8.9 ft NAVD88 and +13.9 ft NAVD88, with an average of approximately
+10.9 feet NAVD88. The average berm elevation is approximately +3.9 ft
NAVD88. The berm width varies from 100 ft (near marina) to 0 ft (near Wagner
19Creek). The narrowest berm widths occur in reaches fronted by structures
(bulkheads or revetments). Average onshore slope is approximately 1v:10h. A
typical offshore slope (determined from 1957 long range profile data) is
approximately 1v:228h. The average slope break (between the onshore and
offshore slopes) occurs at approximately MLW (-2.7 ft NAVD88). The average
structure elevation of the bulkheads and revetments present in the eastern
portion of the shoreline is approximately +8.9 ft NAVD88.
Table 6: Existing Coastal Structures
Coastal Structure Evaluation
Structure Location Easting Structure Crest Elevation Top Condition Condition
Type NAD27 NAD83 Material Inner End Outer End Width Length Built Owner 1957 2001
(ft.) (ft.) (ft. NAVD) (ft. NAVD) (ft.) (ft.) (year)
Pier 2,166,650 612,477 Timber/Concrete N/A N/A 50-100 11,300 1943-45 U.S. Govt. Good N/A
Jetty 2,168,550 614,377 Timber 2 2.5 1 260 pre 1940 State Good Good (rebuilt in 1990's)
Jetty 2,168,700 614,527 Timber 4 2.4 1 50 pre 1940 State Good Good (rebuilt in 1990's)
Groin Field (4 groins)
from 2,169,100 614,927 Timber 1.3 0.8 1 55 1942-43 State Good Fair
to 2,169,900 615,727 Timber 2.4 2.2 1 145 and Local
Groin 2,171,200 617,026 Timber 3.6 1.7 1 110 N/A Private Good Poor (Non-functional)
Bulkhead
from 2,171,400 617,225 Timber 9 N/A 1 400 N/A Private Good N/A
to 2,171,800 617,625 12.1 N/A
Bulkhead
from 2,172,050 617,868 Timber N/A N/A 1 225 N/A N/A N/A N/A
to 2,172,100 617,918
C-2.7 Historic Shoreline Change Analysis
The following data was utilized in determining average erosion rates:
1836 MHW (Mean High Water) survey made by U.S. Coast and Geodetic Survey,
and digitized from the 1960 Raritan Bay and Sandy Hook Bay Survey Report
Plate 7.
1957 survey denoting MHW by use of location of MHW on profile lines,
supplemented by use of aerial photography collected during the same year,
digitized from the 1960 Raritan Bay and Sandy Hook Bay Survey Report Plate 7.
1988 MHW taken from Township of Middletown Tax Maps, digitized from the
Raritan Bay and Sandy Hook Bay Reconnaissance Report Figure 11a.
1999 MHW (elevation +1.9 feet NAVD) taken from the 1999 aerial 1”=100’
photogrammetric mapping of Leonardo, NJ, digital maps. This data was adjusted
with profile data.
20Table 7: Existing Beach Parameters
dune dune berm berm berm average
dune crest dune foreshore berm crest foreshore toe offshore
crest el width base el slope crest el width slope el slope
PL date type ft. NAVD ft ft. NAVD 1V:xH ft. NAVD ft 1V:xH ft. NAVD 1V:xH
280 1999 Marsh n/a n/a n/a n/a 7.2 20 9.3 -3.5
270 1999 Marsh n/a n/a n/a n/a 5.9 20 8.7 -3.2
avg n/a n/a n/a n/a 6.55 20 9 -3.35 500
260 1999 Dune 9.2 3 5.4 8.7 5.7 89 13.9 -2.4
250 1999 Dune 11.9 3 4.5 6.9 4.5 39 9.4 -3.2
240 1999 Dune 13.1 3 5.4 3.6 6.9 20 9.9 -3.7
avg 11.4 3.0 5.1 6.4 5.7 49.3 11.1 -3.1 450
24 1957 dune 9.8 0 n/a 11.5 n/a n/a n/a -2.1 550
230 1999 Bulkhead Flank 6.9 35 3.9 7 4.2 * 30 12.2 -2.7
220 1999 Bulkhead n/a n/a n/a n/a 4 ** 0 11 -3.2
210 1999 Bulkhead n/a n/a n/a n/a 5.1 ** 0 15.8 -3.2
200 1999 Bulkhead n/a n/a n/a n/a 5.2 ** 0 13.2 -3.4
190 1999 Bulkhead Flank 6.2 10 4.5 8.2 4.5 * 26 10.8 -4.1
avg 4.8 0.0 13.3 -3.3 450
Notes: n/a - not applicable
* - berm fronting dune
** - berm fronting bulkhead
C-2.8 Selection of Long-Term Erosion Rates
The period between 1957 and 1999 was selected as the typical period to
represent long-term shoreline erosion rates in ft/yr, and the similar period of 1954-
1999 was selected to represent the long-term volumetric changes in cy/yr. These
periods have the most “typical” shoreline and volumetric change trends, and the
minimum uncertainty of all the data sets. The marsh reach has 0.5 ft/yr of
accretion, the dune reach has 3.5 ft/yr of erosion, and the bulkhead reach has 2.7
ft/yr of erosion. The bulkhead erosion rate is assumed to increase approximately
15% (to 3.1 ft/yr of erosion) in the future due to sediment starvation increasing the
wave induced scour at the toe of the bulkheads.
C-3. Without-Project Existing and Future
Conditions
Damages fall into two categories for this study: inundation damages which occur
in all the reaches, and wave-related damages which are more localized and site-
specific. Inundation damages are discussed in the Economic Appendix. Wave-
related damages are discussed herein. The Marsh Reach is sufficiently set back
such that it is not subject to direct wave action and wave-related damages. The
Dune/Beach Reach is backed by Beach Ave, utility poles and buried utility lines.
The structures themselves, located behind Beach Ave are sufficiently set back
21from the road such that they are not subject to wave-related damages. However,
the road itself and utilities are subject to storm- induced erosion and undermining.
The Bulkhead Reach is subject to structure failure from direct wave breaking on
the structures, storm wave-induced scour of the grade fronting the bulkhead, and
wave-induced scour of the grade on the landward side of the bulkhead.
However, the structures are sufficiently setback from the bulkhead line and are at
an elevation high enough to not be impacted by wave damage themselves. Only
the local repair cost of the bulkhead repair was assumed to be significant.
Further details on the wave-related damage calculations for the Dune/Beach and
Bulkhead Reaches follow. Structural alternatives were evaluated using these
values.
C-3.1 Without-Project Existing and Future Conditions
for the Dune/Beach Reach
The EDUNE Dune Erosion Model developed by Dr. David Kriebel in 1989 was
used to predict the post-storm profile condition of the Dune/Beach Reach typical
profile for the 50, 10, 4, 2, 1, and 0.2% chance exceedance storm events. Other
inputs included stage, root mean square breaking wave height, average sand
grain size, and average storm duration. Results includes maximum dune erosion
distance measured at the MHW elevation (which includes a variability factor of
1.5 to account for variations in model results and profile conditions) in feet,
maximum dune elevation reduction in feet, post-storm dune elevation, and
maximum erosion volume in cubic ft per linear foot of beach.
The MHW location on the 1999 topographic mapping (1”=200’) was adjusted to
account for long term erosion between 1999 and 2007 using the without-project
erosion rate of 3.5 ft/yr (at 8 years for a total of 28 ft landward adjustment). The
maximum dune erosion distance was superimposed on this 2007 MHW location
to determine where the erosion intercepted the roadway. The road was assumed
to be undermined and needing replacement when the erosion limit exceeded 5 ft
landward of the landward edge of pavement.
Without project impacts to roadways due to a combination of storm-induced and
long-term erosion was evaluated for the existing conditions (year T=0), and at
T=10, 20, 30, 40, and 50 years into the future (from the base year of 2007,
assuming long-term erosion rate of 3.5 ft/yr acting upon the 1999 shoreline),
utilizing the following assumptions.
A. It was assumed that local authorities would replace roadway surfaces when
erosion undermined road 5 ft. or more. At the time of road replacement, the local
authorities were assumed to place sand fill 10 ft wide, fronting the roadway,
overlain by riprap in order to provide an approximate 6.7 to 10% chance
exceedance level of coastal storm risk management to the new road surface.
The sand fill would extend from elevation 9.4 ft NAVD88 to the toe at –3.3 ft
22NAVD88 (4.63 cy/ft). The riprap is 1 ft thick, with a 0.5-foot thick bedding layer
underneath and extends from the edge of pavement at elevation +9.4 ft NAVD88
to elevation +2.9 ft NAVD88 (12.4 sy/ft).
B. It was assumed that the initial road repair/sandfill/riprap would be constructed
for storm intrusion (causing greater than 5 feet of undermining of road surface)
occurring in the existing (year T=0) condition.
C. Road repair (Apr 02 PL) was assumed to cost $35/sy. Sand fill (Apr 02
PL) was assumed to be obtained from an upland source at a cost $13/cy. Riprap
placement (Apr 02 PL) was assumed to cost $40/sy. Mobilization and
demobilization costs (Apr 02 PL) of $20,000 per operation were assumed.
D. In future conditions, storm occurrence on the previously remedially protected
areas would require repair of the protection at the following percentages: 33% for
a 4% chance exceedance event, 45% for a 2% chance event, 65% for a 1%
chance event, and 95% for a 0.2% chance event for previously placed riprap; and
65% for a 1% chance event, and 95% for a 0.2% chance event for previously
placed road repair and sand fill.
E. Any storm intrusion (5-foot undermining of road) in future years into areas
NOT previously protected (i.e., areas adjacent to repaired areas) would require a
full placement section (replace roadways surface fronting with 10-foot wide sand
fill overlain by riprap).
F. Three utility poles are located seaward of the road, in the present dunes.
These poles were assumed to fail when 3 feet or greater of vertical erosion
occurs. Utilizing the post- eroded profiles from EDUNE, it was found that 3 feet
of vertical erosion occurred at the location of the poles for a 2, 1, and 0.2%
chance exceedance events in years T=0 and T=10, for 10, 4, 2, 1, and 0.2%
chance events for years T=20 and T=30, and for 50, 10, 4, 2, 1, and 0.2%
chance events for years T=40 and T=50. The poles were assumed to be
relocated at the time of repair to a more protected location. Repair costs of
$5,000/pole were assumed.
G. Gas and sewer lines are located under the roadway, approximately along the
centerline (10 feet from seaward edge of pavement). When storm-induced and
long-term erosion undermine the roadway by a minimum of 10 feet, the gas and
sewer lines were assumed to need repair. A combined repair cost (Apr 02 PL) of
$100/ft of lines was assumed.
H. Storm-sewer lines are also located in the bulkhead reach to the east. Several
outfalls carry water to bay. During the 1992 nor’easter, these outfalls and the
adjacent street terminuses supporting them were severely damaged. Local
authorities authorized repair to a slightly higher level of coastal storm risk
management. The cost of the repairs performed in 1993 was approximately
23$213,000. For this study, it was assumed that these repairs have a life
expectancy of approximately 20 years. Therefore, it was assumed that at the
end of every 20 years, approx. $100,000 (Apr 02 PL) would be spent to repair
damage from a 2% chance event, approx. $125,000 (Apr 02 PL) would be spent
to repair damage from a 1 percent flood, and approx. $150,000 (Apr 02 PL)
would be spent to repair damage from a 0.2 percent flood. These repairs were
assumed to occur in years T=10 (which is approx. 20 years after local repair in
1993), year T=30, and year T=50.
Pertaining to uncertainty, the range of storm-induced erosion for a given return
period storm is minimal as it pertains to variations in annualized cost. Therefore,
the mean values utilized are representative of erosion damages to the road
system behind the dune.
The end result of this analysis was an estimation of average annual damages of
$181,000 (escalated to an Oct 2008 Price Level), for purpose of calculating and
comparing the benefit-to-cost ratios (BCR) for each of the proposed alternatives.
C-3.2 Without-Project Existing and Future Conditions
for the Bulkhead Reach
Bulkhead failure was predicted from scour. The average horizontal erosion rate of
3 ft/yr corresponds to average vertical erosion at the toe of the walls of approx.
0.5 ft/yr. Assuming 10 ft embedment depth of the walls, 10 years of long-term
erosion coupled with a 6.7% chance event (having a corresponding wave height
at the toe of the wall of 5.5 ft. causing an equivalent scour depth) would cause
failure of the wall. The estimated cost of wall replacement (Apr 02 PL) is
approximately $600/linear foot, for 1,800 lf of wall, or $1,080,000 (Apr 02 PL) to
be spent every 10 years. This corresponds to an average annual wall
replacement cost of $78,000 (50 yr period, 7-1/8% interest Apr 02 PL). When
escalated to Oct 08 PL, with 4-3/8% interest, the average annual bulkhead repair
cost is $120,000. Wave overtopping was estimated using equations from Smith
et al 1994. The results show that a 4% annual chance exceedance event creates
sufficient overtopping to scour out the material providing support behind the
structure. This was assumed to correspond to $43,000 of damages (Apr 02 PL)
annually (or $1,080,000 x 0.04). The total annual damages (Apr 02 PL) for the
bulkhead reach are, therefore, $121,000. The total annual damages escalated to
Oct 08 PL for the bulkhead reach are $178,000.
C-3.3 Price Level for Without-Project Existing and
Future Conditions
Through a sensitivity analysis, it was determined that the update to without-project
24existing and future conditions would not affect the results of the plan formulation.
Consequently, costs and benefits are presented in 2008 Price Level to reflect
when these numbers were derived.
C-4. Development of Alternatives
A total of eleven plans were considered. Of these, six were structural alternatives
and five were nonstructural alternatives. Descriptions and layouts of the
alternatives can be found in the main report. The initial development of the
eleven alternatives utilized USACE stage-frequency data from 1998 (which
consisted of the 1% annual chance of exceedance still water elevation of +10.7
ft. NAVD added to 50% of the 1.4 ft of wave setup, or +11.4 ft NAVD) . In 2014,
FEMA provided draft stage-frequency curves, which have been adopted as the
stage-frequency data for Leonardo as of 2014. The initial comparison between
the eleven alternatives was completed prior to 2014. The assumption is made:
because all eleven alternatives were developed and compared using the same
data (1998 stage data), the results of the comparison would come out the same if
the 2014 data was used for all eleven.
C-4.1 Structural alternatives
Alternative S1 – Seawall with gate across marina
Alternative S2 – Beach Fill with gate across marina
Alternative S3 – Combination Beach Fill and Seawall with gate across marina
Alternative S4 – Combination Beach Fill and Seawall with gate across marina,
protection provided only west of Brevent Avenue
Alternative S5 – Limited structural plan with no gate across marina
Alternative S6 – Road Raising
The alternatives were compared to the planning objectives to determine which
features should be considered for more detailed analysis. Table 8 shows the
major advantages and disadvantages of each of the structural alternatives.
Table 10 shows the resulting total costs for all the alternatives. Locals have
expressed lack of support for all the presented structural alternatives. Therefore,
structural alternatives were dropped from further consideration.
25Table 8: Advantages and Disadvantages of Structural Plans
Major Advantages and Disadvantages of the Structural Alternatives
Alternative
Alt. No. Description Major Advantages Major Disadvantages
Access routes remain open during flood Increased maintenance of gate across
events marina
S1 Seawall
Does not require beach renourishment Potential for impact on bay views
in future
Access routes remain open during flood Increased maintenance of gate across
events marina
S2 Beach fill
Provides new beach with additional Potential for impact on bay views
recreation opportunities
Access routes remain open during flood Increased maintenance of gate across
Beach fill & events marina
S3
Seawall Provides new beach with additional Potential for impact on bay views
recreation opportunities
Access routes remain open during flood Leaves areas east of Brevent Ave.
Beach fill &
events exposed
Seawall with
Provides new beach with additional Increased maintenance of gate across
S4 protection
recreation opportunities marina
west of
Potential for impact on bay views
Brevent Ave
Provides only limited flood protection
Limited Increased beach area may provide Leaves areas west of marina and east of
S5 structural plan recreation opportunities Brevent Ave. exposed
with no gate Potential for impact on bay views
No significant environmental impacts Limited potential for storm damage
Limited Road
S6 identified protection
Raising Plan
No view impacts
C-4.2 Nonstructural alternatives
Alternative N1 –Nonstructural (structures in the 1998 20 percent floodplain (+6.9
ft NAVD88) to the level of a 1 percent flood (+10.7 ft NAVD) plus 0.7 ft of sea
level rise plus 0.7 ft of wave setup plus the FEMA recommended freeboard
amounts (total +13.1 ft NAVD))
Alternative N2 – Nonstructural (structures in the 1998 4 percent floodplain (+9.4 ft
NAVD88) to the level of a 1 percent flood (+10.7 ft NAVD) plus 0.7 ft of sea level
rise plus 0.7 ft of wave setup plus the FEMA recommended freeboard amounts
(total +13.1 ft NAVD))
Alternative N3 – Nonstructural (structures in the 1998 1 percent floodplain (+11.4
ft NAVD88) to the level of a 1 percent flood (+10.7 ft NAVD) plus 0.7 ft of sea
level rise plus 0.7 ft of wave setup plus the FEMA recommended freeboard
amounts (total +13.1 ft NAVD))
Alternative N4 – Nonstructural (structures in the 1998 20 percent floodplain (+6.9
ft NAVD88) to the level of a 10 percent flood (+7.7 ft NAVD) plus 0.7 ft of sea
level rise plus 0.5 ft of wave setup plus the FEMA recommended freeboard
amounts (total +9.9 ft NAVD))
Alternative N5 – Nonstructural (structures with a main floor at or below +9.4 ft
26NAVD88 and with a ground elevation below +7.9 ft NAVD88 to the level of a 1
percent flood (+10.7 ft NAVD) plus 0.7 ft of sea level rise plus 0.7 ft of wave
setup plus the FEMA recommended freeboard amounts (total +13.1 ft NAVD)).
The main floor criteria attempts to target structures with the most frequent and
severe damages with water surfaces exceeding the main floors, and not simply
basement or crawlspace flooding.)
Table 9: Advantages and Disadvantages of Nonstructural Plans
The alternatives were compared to the planning objectives to determine which
features should be considered for more detailed analysis. Table 9 shows the
major advantages and disadvantages of each of the nonstructural alternatives.
Table 10 shows the resulting total costs for the alternatives. The results of the
preliminary economic analysis indicate a marginal economic justification for
Alternatives N1 and N5. However, economic justification may be improved once
costs are refined during subsequent analysis. Furthermore, refinement of the
scope of the nonstructural plan in terms of the number of structures included in a
plan may also result in a favorable BCR.
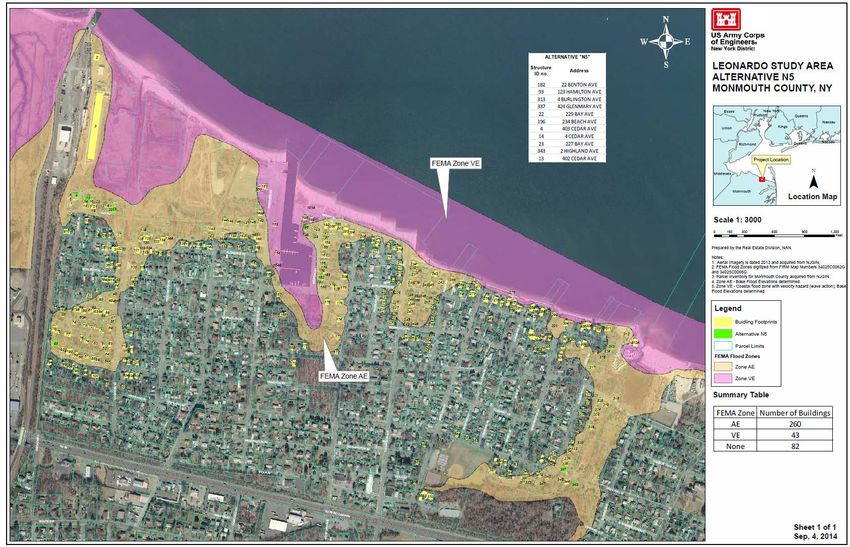
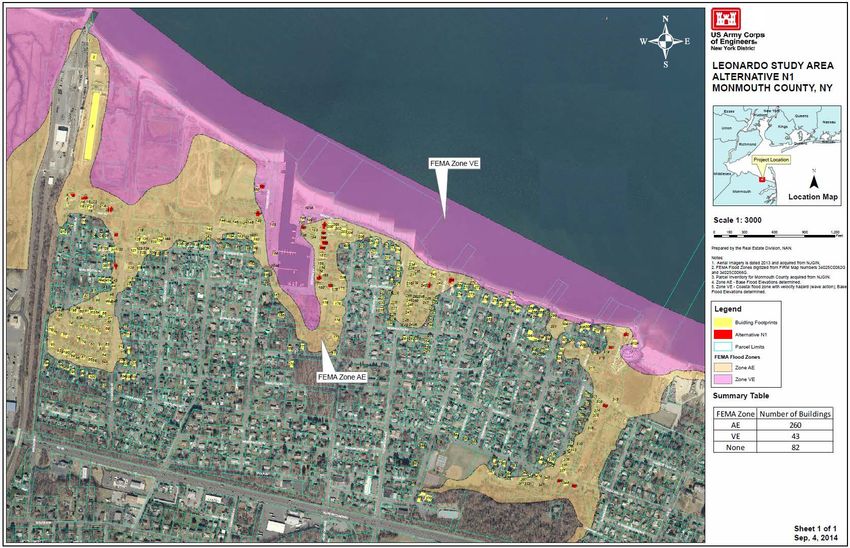
27Limited nonstructural alternatives, such as N1 and N5, are recommended for
more detailed development. Figure 4 and Figure 5 show the structures in the
project area for Alternatives N1 and N5, respectively.
Table 10: Summary of Alternatives Costs
Total Cost Annual Cost
Alternative Description (Oct. 08 PL) (Oct. 08 PL)
S1 Seawall Plan $30,097,000 $1,695,000
S2 Beach Fill Plan $31,508,000 $2,009,000
S3 Combination Beach $31,191,000 $1,795,000
Fill & Seawall plan
S4 Combination Plan $23,554,000 $1,389,000
West of Brevent
Avenue
S5 Limited Structural $14,334,000 $817,000
Plan
S6 Limited Road Raising $499,000 $28,000
Plan
N1 20% Floodplain Non- $2,379,000 $118,000
structural (NS)1*
N2 4% Floodplain NS1* $11,026,000 $547,000
N3 1% Floodplain NS1* $16,202,000 $803,000
N4 20% Floodplain NS2* $1,570,000 $78,000
N5 Main Floor ≤ +9.4 ft $2,772,000 $137,000
NAVD88 NS1*
*(1) Coastal storm risk management to the level of a 1 percent flood
*(2) Coastal storm risk management to the level of a 10 percent flood
C-5. Tentatively Selected Plan
Design and costs of nonstructural alternatives N1 and N5 were further refined
during the feasibility phase of design, based on the 2014 FEMA stage-frequency
data. Alternative N1 selected all structures having a ground elevation lower than
+6.9 ft NAVD88 and brings their main floors to the 1 percent flood water surface
elevation plus 0.7 ft of historic sea level change plus estimated wave crest effects
plus one foot of freeboard for structures in the AE zone or 3 feet of freeboard for
structures in the VE zone. Alternative N5 selected all structures with main floors
at or lower than +9.4 ft NAVD88 and ground elevations lower than +7.9 ft
NAVD88 and brings their main floors to the 1 percent flood water surface
elevation plus 0.7 ft of historic sea level change plus estimated wave crest effects
plus one foot of freeboard for structures in the AE zone or 3 feet of freeboard for
structures in the VE zone. The physical impacts on the elevated structures,
should greater than historic sea level change occur, would be more frequent
main floor flooding and miscellaneous flooding damages.
28The preliminary windshield structure inventory resulted in 61 structures being
identified as potential candidates for nonstructural measures. A more detailed
structure inventory of these 61 structures collected the following information:
• ground elevation
• main floor elevation
• area of building footprint
• building type
• building style
• number of stories
• foundation type
• foundation condition
• siding material
• condition
C-5.1 Evaluation of Structures
Structures in the project area were analyzed for eligibility for a flood protection
measure. The nonstructural alternatives, N1 and N5, were evaluated with the
use of an algorithm developed for another nonstructural coastal storm risk
management project in the New York District. The evaluation process is
documented here in detail, including the recommendations for nonstructural
treatment for the eligible structures.
C-5.1.1 Inventory of Structures
The inventory included the following information; the structure ID number,
Residential or Commercial, Usage Code, Number of Stories, Wood or Masonry
Exterior, Foundation Type, Basement, First Floor Area, Total Size, Ground
Elevation, and Main Floor Elevation.
The structures were inspected to confirm the information obtained through
previous structure surveys. The GIS locations were used for identification of the
structures in reference to the coastal floodplain limits. This information was
utilized to determine reference points for determining the various hurricane flood
frequencies that would be used to evaluate each structure.
C-5.1.2 Sorting of Structures
The first step for preparing the structure list for the evaluation was to sort the
structures in the following order: Residential or Commercial, Foundation Type,
and Usage Code. For commercial structures, another sorting level was the type
of exterior, wood or masonry. The Usage Codes are shown in Table 11.
29C-5.1.3 Criteria for inclusion to plan N1 and N5
The descriptions of Alternatives N1 and N5 provide the criteria for including
structures in each alternative, which are as follows:
N1: All structures within the 20% floodplain, as determined by the ground
elevation.
N5: All structures with a main floor elevation at or below +9.4 ft NAVD88
and with a ground elevation below +7.9 ft NAVD88.
Accordingly, the inventory of structures was copied into separate spreadsheets
for the computations and evaluation of each alternative. The structures that did
not qualify for each alternative were simple removed from the tables. Thirty-
seven (37) structures remained to be considered for Alternative N1, and 25
structures remained for Alternative N5.
Table 11: Structure Inventory Codes
STRUCTURE INVENTORY CODES
RESIDENTIAL COMMERCIAL INDUSTRIAL UTILITY MUNICIPAL
TYPE = RES TYPE = COM TYPE = IND TYPE = UTL TYPE = MUN
USAGE CODES USAGE CODES USAGE CODES USAGE CODES USAGE CODES
1. Colonial 21. Art Gallery 71. Food and 101. Sewage Treatment 201. Fire House
2. Cape Cod 22. Auto Sales Associated Product 102. Pump Station 202. Storage Garage
3. Ranch 23. Auto Service 72. Extraction 103. Gas Substation 203. Municipal Building
4. Split Level 24. Bank 73. Textiles and 104. Water Treatment 204. Municipal Complex
5. BiLevel 25. Bar Apparel 105. Wells 205. Police Station
6. Raised Ranch 26. Bath House 74. Lumber & Wood 106. Electric Substation 206. Schools
7. Bungalow 27. Church 75. Furniture and 107. Miscellaneous 207. Rescue Squad
8. Custom 28. Clothing Store Fixtures 208. Library
9. Mobile Home 29. Department Store 76. Paper Products 209. Post Office
10. 2-Family 30. Diner 77. Printing and 210. General Storage
11. Duplex 31. Drug Store Publishing
12. Multi-Family 32. Dry Cleaning 78. Chemicals
13. Garden Apt. 33. Food Store 79. Fuel Storage
14. High-Rise 34. Funeral Home 80. Glass, Clay CONSTRUCTION BUILD QUALITY
15. Town House 35. Hair Salon and Concrete M Masonry L Low
36. Hardware 81. Metal Working W Wood (non-masonry) M Medium
37. Home Furnishings 82. Electrical H High
38. Hospital 83. Transportation
39. Indoor Sports Equipment BASEMENTS CONDITION
40. Jewellers 84. Warehouse 0 No Basement/Slab On-Grade (at time of survey)
41. Liquors 85. Building 1 Full Subgrade Basement N New
42. Marina Contractor 2 Partial Subgrade Basement E Excellent
43. Medical Office 86. Light Industry 3 Crawl Space/Raised Foundation/Piers G Good
44. Office 87. Medium Industry 4 Piles A Average
45. Office Warehouse 88. Heavy Industry F Fair
46. Outdoor Sports P Poor
47. Restaurant D Delapidated
48. Rooming House
49. Small Retail
50. Theaters
51. Vacant* * Can be used for all types except residential
52. Farm
C-5.1.4 Excel Formulas created from Flow Charts
The next step in the structure evaluation was to create formulas in Microsoft
Excel to perform the algorithm that was outlined in flow charts used for similar
30nonstructural projects. Figure 6 And Figure 7 contain the flow charts for
residential structures and Figure 8 and Figure 9 contain the flow charts for non-
residential structures. The formulas were based on the decision points in the flow
charts and physical characteristics of each structure. The end result from the
Excel formulas provides the recommended nonstructural treatment for each
structure for each alternative. Cost estimates were then developed from the
required treatments.
C-5.1.5 Revisions to Structure List
In some cases, structures were removed from consideration for either or both
alternative due to previous flood protection treatment, or if the structure has been
removed or is too poor of a condition to receive a floodproofing treatment. The
structures that were removed for each alternative are listed below, with the
reason for removal.
C-5.1.5.1 Structures Removed from Alternative N1
163, 184, 243, 256, 344: Condition too poor to raise structure, or no
structure exists.
164, 187, 312A: Algorithm result not practical or cost effective.
181, 186, 193, 194, 241, 258, 312: Structure already raised, or planned to
be raised.
C-5.1.5.2 Structures Removed from Alternative N5
143, 163, 243, 256, 344: Condition too poor to raise structure, or no
structure exists.
164, 312A: Algorithm result not practical or cost effective.
181, 193: Structure already raised, or planned to be raised.
The final results for this nonstructural evaluation are presented in Table 12, which
is a list of structures that are included in the project, along with the height of the
raise required to meet the necessary protection level. A total of twenty-five (25)
structures are eligible for either Alternative N1 or N5 (or both).
31You can also read