Quality Parameter Levels of Strawberry Fruit in Response to Different Sound Waves at 1000 Hz with Different dB Values (95, 100, 105 dB) - MDPI
←
→
Page content transcription
If your browser does not render page correctly, please read the page content below
agronomy
Article
Quality Parameter Levels of Strawberry Fruit in
Response to Different Sound Waves at 1000 Hz with
Different dB Values (95, 100, 105 dB)
Halil Ozkurt 1, * and Ozlem Altuntas 2        ID

 1   Karaisali Vocational School, Cukurova University, Adana 01770, Turkey
 2   Department of Horticulture, Inonu University, Malatya 44280, Turkey; ozlem.altuntas@inonu.edu.tr
 *   Correspondence: ozkhalil@cu.edu.tr; Tel.: +90-0322-551-2057

 Received: 8 May 2018; Accepted: 17 July 2018; Published: 23 July 2018

 Abstract: All living organisms perceive mechanical signals, regardless of their taxonomic
 classifications or life habits. Because of their immobility, plants are influenced by a variety
 of environmental stresses, such as mechanical stress, during their growth and development.
 Plants develop physiological behaviors to adapt to their environment for long-term development
 and evolution. Sound-induced stress—an abiotic stress factor—is an example of mechanical stress
 and is caused by sound waves generated by different sources. This stress has a negative effect
 on the development and growth of plants. The strawberry plants evaluated in this study were
 exposed to three different sound intensity levels (95, 100, 105 dB) at a constant frequency of 1000 Hz.
 In strawberry plants, stress induced by sound waves is thought to trigger increased production
 of secondary metabolites as a defense mechanism. To determine the effect of sound applications,
 the fresh and dry weights of the roots and shoots were measured in strawberry plants, and the
 pH, total soluble solids (Brix), titratable acidity, vitamin C, total sugar, total acid, and total phenols
 were analyzed in the fruits. Results show that the sound stress, which was produced at a constant
 frequency (1000 Hz) and different sound levels (95, 100, 105 dB), affects the growth parameters of the
 plant and several quality parameters of the fruit.

 Keywords: abiotic stress; fruit quality parameters; ascorbic acid; biomass; sound waves;
 frequency; dB

1. Introduction
      Worldwide, strawberry (Fragaria × ananassa) is commonly consumed either in its fresh form or
after it is processed. Strawberry reaches its full size and ripens within 30 days; it is a non-climacteric
fruit. This growth period is dependent on light, temperature, soil composition, and some cultivation
conditions [1]. In addition to being a fruit that is consumed for its taste, strawberry contains
carbohydrates, vitamin C, and some antioxidant compounds (e.g., phenolics and flavonoids) [2].
Secondary plant metabolites are compounds with no fundamental roles in the life processes of plants,
but they are important for the plant’s ability to interact with its environment for adaptation and
defense [3].
      The ability to sense and respond to physical stimuli is of key importance to all living things.
Light, temperature, and chemical signals are among the environmental stimuli detected by living
organisms. Some of these stimuli are related to physical–mechanical stimuli (i.e., differences in
mechanical forces or pressures detected by a living cell). Due to the force of gravity straining
self-loading and inner growth, and mechanical loads of snow, ice, fruit, wind, rainfall, touch, sound,
and hydration (turgor pressure) may be perceived by a cell. All living organisms perceive mechanical

Agronomy 2018, 8, 127; doi:10.3390/agronomy8070127                          www.mdpi.com/journal/agronomy
Agronomy 2018, 8, 127 2 of 13
signals,
Agronomy regardless
2018, 8, x FOR ofPEER
theirREVIEW
taxonomic classifications or life habits (sessile vs. motile). Because of 2their of 12
immobility, plants are influenced by environmental stress, such as mechanical stress, during their
growth and development
immobility, [4–7]. Plants
plants are influenced develop physiological
by environmental behaviors
stress, such to adapt to
as mechanical the environment
stress, during their
for long-term
growth development[4–7].
and development and evolution.
Plants developIn previous studies,behaviors
physiological it was reported
to adaptthattoplants are capable
the environment
of
for long-term development and evolution. In previous studies, it was reported that plants areetcapable
responding to wind, touch, electric fields, magnetic fields, and ultraviolet rays [8,9]. Sato al. [10]
reported that, under
of responding to wind,mechanical stress,fields,
touch, electric chloroplasts
magneticin plant
fields,cells
andwere re-localized
ultraviolet by anSato
rays [8,9]. active motor
et al. [10]
system.
reportedErner and Jaffe
that, under [11] reported
mechanical stress,that the contents
chloroplasts of ethylene
in plant cells were(Cre-localized
H
2 4 ) and abscisic
by an acid
active (ABA)
motor
were
system.increased
Erner and in Jaffe
plants.[11]They also that
reported reported that theofgibberellin
the contents ethylene (C (GA) and abscisic
2H4) and indoleacetic acid (IAA)
acid (ABA) were
contents
increasedwere decreased
in plants. Theyunder mechanical
also reported thatstress. Secondary(GA)
the gibberellin plantand
metabolites are compounds
indoleacetic with no
acid (IAA) contents
fundamental
were decreased rolesunder
in the mechanical
life processesstress.
of plants; however,plant
Secondary they metabolites
are vital elements in plants’ interaction
are compounds with no
with the environment
fundamental roles in theforlife
adaptation
processesand defense
of plants; mechanisms.
however, they are vital elements in plants’ interaction
with Sound waves andfor
the environment sonication
adaptation actand
as defense
forms ofmechanisms.
abiotic stress on plants [12]. It is well known that
plants absorb and resonate some sound frequencies
Sound waves and sonication act as forms of abiotic fromstress
the external
on plantsrealm
[12].[13–15].
It is wellSound
known waves
that
had significant
plants absorb and dualresonate
effects on the root
some sound development
frequenciesoffromActinidia chinensisrealm
the external plantlets (p < 0.05).
[13–15]. Sound The root
waves
activity, total length,
had significant and the
dual effects onnumber
the rootof roots were increased
development of Actinidia bychinensis
the stimulation
plantletsfrom soundThe
(p < 0.05). waves;
root
however, the length,
activity, total cell membrane permeability
and the number of roots decreased Increasing
were increased by theATP content in
stimulation fromcells means
sound that
waves;
anabolism
however, the is strengthened.
cell membrane At permeability
1 kHz and 100decreased
dB, the soluble protein
Increasing ATPcontent
contentandinSOD cellsactivity
meanswere that
reported to increase. On the other hand, when sound wave stimulation exceeded
anabolism is strengthened. At 1 kHz and 100 dB, the soluble protein content and SOD activity were 1 kHz and 100 dB,
these indices
reported were reduced
to increase. On the[16–18].
other hand, when sound wave stimulation exceeded 1 kHz and 100 dB,
these indices were reduced [16–18].
2. Sound Waves and Sound Magnitude
2. Sound Waves
Sound and Soundvibration
is a mechanical Magnitudewave that travels in a medium that consists of certain materials.
According
Sound to is aphysicists,
mechanical‘sound’
vibrationis wave
the molecular diffusion
that travels of anthat
in a medium energy source
consists in airmaterials.
of certain medium.
Sound consists of vibrations in the air that are sensed by our brains after traveling
According to physicists, ‘sound’ is the molecular diffusion of an energy source in air medium. Sound as waves in a
medium
consists ofand stimulating
vibrations ourair
in the ears. Sound
that wavesby
are sensed take the
our form after
brains of sinus waves.asThe
traveling distance
waves in a between
medium
two peaks is the wavelength, and the number of wave peaks measured within 1
and stimulating our ears. Sound waves take the form of sinus waves. The distance between two peakss is the frequency
(Figure 1a,b). In other
is the wavelength, words,
and the the frequency
number of a wave
of wave peaks depends
measured on1the
within s is frequency of the
the frequency vibrations
(Figure 1a,b).
of
In the particles
other words, in thethe mediumof(e.g.,
frequency air) depends
a wave through on which the wave travels.
the frequency Frequency
of the vibrations of is computed
the particles
by measuring
in the mediumthe vibrations
(e.g., in time.
air) through whichThethe
number of vibrations
wave travels. in 1 sisiscomputed
Frequency expressedby in measuring
units of Hertz
the
(1 Hertz = 1 cycle/s).
vibrations in time. The number of vibrations in 1 s is expressed in units of Hertz (1 Hertz = 1 cycle/s).
(a) (b)
Figure 1. (a)
Figure 1. (a) Low-frequency
Low-frequency sinus wave; (b)
sinus wave; (b) high-frequency
high-frequency sinus
sinus wave.
wave.
The term ‘sound magnitude level’ refers to the logarithm of an energy-physical magnitude. A
The term ‘sound magnitude level’ refers to the logarithm of an energy-physical magnitude.
decibel measures the perceived sound level; it is the noise level unit. The basic sound magnitude
A decibel measures the perceived sound level; it is the noise level unit. The basic sound magnitude
parameter for the sound magnitude level is I0, which is the hearing limit at 1000 Hz:
parameter for the sound magnitude level is I0 , which is the hearing limit at 1000 Hz:
I
LI = 10·Log (dB)
I (1)
L I = I100 ·Log ·(dB) (1)
I0
2
The magnitude
The magnitude of
of sound
sound isis in
in proportion
proportion to
tothe
thesquare
squareof
ofthe
thesound pressure(I(I~~ pp2 ),), and
soundpressure and the
the
level of
level of the
the sound
sound pressure
pressure is
is found
found with
with the
the equation:
equation:
2
p p2 p p
Lp = 10·log
L p = 102· log = 20· log(dB)·(dB)
= 20·log (2) (2)
p0 2
p0 p 0 p0
Here, the basic sound pressure p0 at 1000 Hz is accepted as 2 × 10⁻⁵ Pa at the hearing limit. Sound
measurement devices directly show the sound pressure level in decibel units using these equations.
The sound power level, on the other hand, is the measurement of the sound power diffusing in any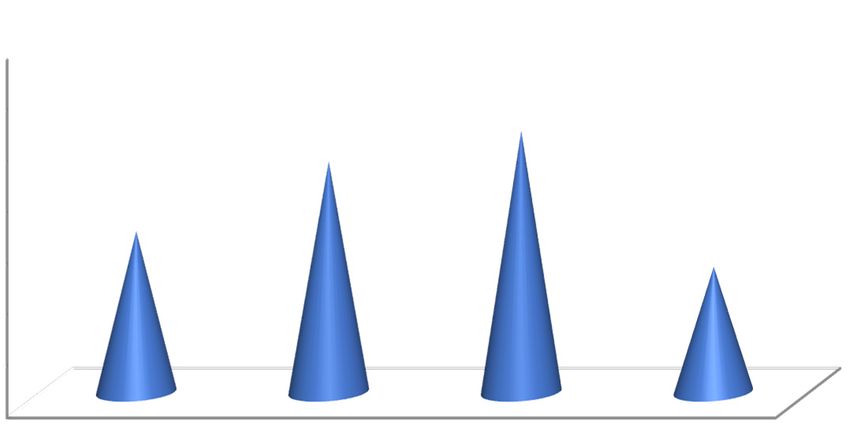
Agronomy 2018, 8, 127                                                                              3 of 13

     Here, the basic sound pressure p0 at 1000 Hz is accepted as 2 × 10⁻⁵ Pa at the hearing limit.
Sound measurement devices directly show the sound pressure level in decibel units using these
equations. The sound power level, on the other hand, is the measurement of the sound power diffusing
in any direction from the source and is expressed in a logarithmic manner, as in the case of sound
magnitude level.
     Using a reference power of 1 picowatt/m2 , i.e., 10−12 W/m2 , the SPL (sound power level) is
calculated as:
                                                      WSource
                                     SPL = 10· log(            )                                  (3)
                                                    WReference
     WSource = The total power diffused by the source
     WReference = 10−12 W/m2 [19].
     Strawberry is a fruit that is consumed worldwide and is cultivated in open and greenhouse
systems. It was determined in previous studies conducted on a variety of fruits and vegetables
that stress conditions cause increased production of secondary metabolites as a defense mechanism.
However, since a plant’s development is negatively affected when it is exposed to abiotic and biotic
stresses, these stresses cause losses in yield. To date, no studies have investigated the effect of sound
waves on the quality parameters of the strawberry fruit. Under stress conditions, plants increase
production of compounds such as phenolic compounds and ascorbic acid to protect themselves.
Therefore, the concentrations of nutritional compounds (which accumulate because of sound stress)
are expected to increase under stress. In this study, we aimed to increase the quality parameters in the
strawberry via sound waves at 1000 Hz and three different frequencies (95, 100, and 105 dB) without
harming the plant. The effects of sound stress on the strawberry fruit’s total soluble solids, titratable
acidity, total sugars, total acids, pH total phenolic, and ascorbic acid were measured.

3. Materials and Methods
      In the present study, a sound amplifier that was capable of transmitting sounds at different
decibel values, along with a decibel indicator, was used. A signal generator that was capable of being
adjusted was used as a frequency oscillator for creating the 1000 Hz frequency. Three 2 × 2 m chambers
that were prepared specifically for the experiment and whose four sides could be opened were used.
Furthermore, a sound level meter (noise measurement device) was used as a sound measurement
device. Also, speakers that could produce 360◦ sound were used. The glass was 4 mm thick in the
chambers. Between the glass was a 10.5 mm space.
      Strawberry plants (Fragaria × ananassa Duch. cv Festival) in 4 L pots of turf + perlite (1:1) were
used as the plant material. Hoagland nutrient solution ((M): Ca(NO3 )2 ·4H2 O, 3.0 × 10⁻³ ; K2 SO4 ,
0.90 × 10⁻³ ; MgSO4 ·7H2 O, 1.0 × 10⁻³ ; KH2 PO4 , 0.2 × 10⁻³ ; H3 BO3 , 1.0 × 10⁻⁵ ; 10−4 M FeEDTA,
MnSO4 ·H2 O, 1.0 × 10⁻⁶ ; CuSO4 ·5H2 O, 1.0 × 10⁻⁷ ; (NH)6 Mo7 O24 ·4H2 O, 1.0 × 10⁻⁸ ; ZnSO4 ·7H2 O,
1 × 10⁻⁶ ) was used to water the plants [20]. The plants were placed in the sound chambers for the
purpose of measuring the effect of sound stress.
      A total of four special sound chambers were used to conduct the study. The chambers were placed
in a plastic greenhouse at Research Fields of Cukurova University, Karaisalı Vocational High School
(36◦ 590 N, 35◦ 180 E, 20 m above sea level), Adana, Turkey. A randomized complete block experimental
design was applied in the study (3 replicates, 10 plants in each replicate). Then, different sound waves
were directed at the pots. The speaker was 65 cm from each pot (Figure 2). Sound magnitudes of 95,
100, and 105 dB were directed at the pots in the sound chambers. For 30 days, the sound waves were
delivered once per day for 1 h in the morning, between 10:00 and 11:00 a.m. The plants were in closed
chambers when the sound waves were emitted.
      It has been stated by specialists that being exposed to sound exceeding 85 dB might be dangerous.
For this reason, dB values above 85 dB were selected. To compare results, control plants were placed in
a chamber in which no sound applications were made.
Agronomy 2018, 8, 127 4 of 13
The experiment was designed as a randomized complete block experimental design with
3 replicates, 10 plants in each replicate. A total of four chambers were used. The chambers could only
detect the sound within, as the chambers were built in such a way that no other sound could enter.
Agronomy 2018, 8, x FOR PEER REVIEW 4 of 12
IBM SPSS Statistics 20 software was used for data analysis. The mean values of the fruit parameters
for
for the
the three
threesound
soundfrequencies
frequencieswere
werecompared
compared using an an
using ANOVA
ANOVAtest.test.
TheThe
effects of sound
effects on the
of sound onfruit
the
parameters were considered significant at p ≤ 0.05.
fruit parameters were considered significant at p ≤ 0.05.
SIGNAL GENERATOR
AMPLIFIER POWER
Figure 2. Illustration of the trial design.
Figure 2. Illustration of the trial design.
3.1. Measurements and Analyses in Strawberry Plants and Fruits
3.1. Measurements and Analyses in Strawberry Plants and Fruits
The trial was started on 16 April 2014 and finalized on 16 May 2014. The fresh and dry weights
The trial was started on 16 April 2014 and finalized on 16 May 2014. The fresh and dry weights of
of the roots in strawberry plants and the fresh and dry weights of the green parts were measured
the roots in strawberry plants and the fresh and dry weights of the green parts were measured every
every 10 days for a total of three measurement points throughout the trial. The pH, total soluble solids
10 days for a total of three measurement points throughout the trial. The pH, total soluble solids (Brix),
(Brix), titratable acidity, vitamin C, total sugar, total acid, and total phenol contents of the fruits were
titratable acidity, vitamin C, total sugar, total acid, and total phenol contents of the fruits were analyzed.
analyzed. For the purpose of preparing ultrapure water (18.2 MΩ cm), the Millipore System
For the purpose of preparing ultrapure water (18.2 MΩ cm), the Millipore System (Millipore Corp.,
(Millipore Corp., Bedford, MA, USA) was used. The chromatography reagent standards and solvents
Bedford, MA, USA) was used. The chromatography reagent standards and solvents were obtained
were obtained from Sigma Chemical, Co. (St. Louis, MO, USA).
from Sigma Chemical, Co. (St. Louis, MO, USA).
3.2. Determination
3.2. Determination of
of Total
Total Soluble
Soluble Solids
Solids (TSS)
(TSS) and
and Titratable
TitratableAcidity
Acidity(TTA)
(TTA)
A hand-type
A hand-typerefractometer
refractometer(ATAGO(ATAGO ATC-1,
ATC-1, Tokyo,
Tokyo, Japan)
Japan) was to
was used used to determine
determine the totalthe total
soluble
soluble solids in the juice of each sample. For the purpose of determining the total titratable
solids in the juice of each sample. For the purpose of determining the total titratable acidity levels, acidity
levels,
the the acid–base
acid–base titrationtitration
methodmethod was applied.
was applied. The
The juice (1juice
mL) (1 mL)
and and distilled
distilled water (50water
mL)(50 mL)added
were were
added to a conical bottle to titrate with aqueous NaOH (0.1 N) to obtain pH 8.1.
to a conical bottle to titrate with aqueous NaOH (0.1 N) to obtain pH 8.1. Total acid content wasTotal acid content
was determined
determined in citric
in citric acid equivalents
acid equivalents and isand is reported
reported as theasmean
the mean
valuevalue of triplicate
of triplicate analyses.
analyses.
3.3. Extraction
3.3. Extraction of
of Sugars
Sugars and
and Acids
Acids (TS
(TS and
and TA)
TA)
One gram
One gram of of the
the sample
sample waswas weighed
weighed and and powdered
powdered withwith liquid
liquid nitrogen.
nitrogen. The The sample
sample was was
added to
added to 20
20 mLmLof ofaqueous
aqueousethanol
ethanol(80%,
(80%, v/v) andand
v/v) thethe
solution placed
solution in a in
placed screw-cap
a screw-capEppendorf
Eppendorftube
and then
tube and inthenan in
ultrasonic bath where
an ultrasonic it was it
bath where sonicated for 15 min
was sonicated at 80
for 15 min°C.atIt80
was◦ C.then filtered
It was thenthrough
filtered
filter paper
through filter(the extraction
paper was repeated
(the extraction three more
was repeated three times). The filtered
more times). extracts
The filtered werewere
extracts mixed and
mixed
evaporated in a boiling water bath until dry. Distilled water (2 mL) was
and evaporated in a boiling water bath until dry. Distilled water (2 mL) was used to dissolve the used to dissolve the
precipitation, and the resulting solution was filtered using Whatman nylon syringe
precipitation, and the resulting solution was filtered using Whatman nylon syringe filters (0.45 µm filters (0.45 µm
pore size,
pore size,1313mmmmdiameter)
diameter) before
before HPLC
HPLC analysis.
analysis. ForFor organic
organic acidacid extraction,
extraction, liquid liquid nitrogen
nitrogen was
was used
used to powder the homogenate (1 g of frozen sample), which was then weighed.
to powder the homogenate (1 g of frozen sample), which was then weighed. Then, it was mixed with Then, it was mixed
with
20 mL20aqueous
mL aqueous metaphosphoric
metaphosphoric acidat(3%)
acid (3%) roomattemperature
room temperature
for 30 minfor with
30 min with a The
a shaker. shaker. The
mixture
mixture
was thenwas thenand
filtered filtered and itswas
its volume volume was increased
increased to 25 mL to 25 mL
using theusing
same the same Itsolvent.
solvent. was then It was
usedthen
for
used for HPLC
HPLC analysis [21]. analysis [21].
3.4. HPLC of Organic Acid and Sugars
There is a built-in degasser, pump, and controller coupled to a photodiode array detector
(Shimadzu SPD 10A vp) in the high-performance liquid chromatographic apparatus (Shimadzu LC
10A vp, Kyoto, Japan). The device also has an automatic injector with a 20 µL injection volume and is
interfaced with a computer with Class VP Chromatography Manager Software (Shimadzu, Japan).
The separation process was performed with a 250 × 4.6 mm i.d., 5 µm, reverse-phase Ultrasphere
ODS analytical column (Beckman, Fullerton, CA, USA). The column was run at room temperatureAgronomy 2018, 8, 127 5 of 13
3.4. HPLC of Organic Acid and Sugars
There is a built-in degasser, pump, and controller coupled to a photodiode array detector
(Shimadzu SPD 10A vp) in the high-performance liquid chromatographic apparatus (Shimadzu LC
10A vp, Kyoto, Japan). The device also has an automatic injector with a 20 µL injection volume and
is interfaced with a computer with Class VP Chromatography Manager Software (Shimadzu, Japan).
The separation process was performed with a 250 × 4.6 mm i.d., 5 µm, reverse-phase Ultrasphere ODS
analytical column (Beckman, Fullerton, CA, USA). The column was run at room temperature with a
flow rate of 1 mL min−1 . The process was performed with a 0.1 a.u.f.s. sensitivity (wavelengths between
200 and 360 nm). The elution was isocratic with 0.5% aqueous metaphosphoric acid. The retention
times of the components were compared using an in-house PDA library to identify the components
that had authentic standards under analytical conditions and UV spectra. Between injections, there was
a 10 min equilibrium time. The Shimadzu LC-10 A vp device was used for separating the sugar on a
150 × 4.6 mm i.d., 5 µm, reverse-phase Nucleosil NH2 analytical column (Shimadzu, Tokyo, Japan) at
room temperature with a 1 mL min−1 flow rate [21].
3.5. Determination of Total Phenolic Content (TPC) and Ascorbic Acid (AA) in Strawberry Fruits
In order to determine the total phenolic content (TPC), the Folin–Ciocalteu method was employed.
After homogenization with a T18, IKA Homogenizer, Germany, 5 g of the frozen fruits with 25 mL
ethanol was centrifuged at 3500× g for 3 min. Filter paper was used to filter the supernatant.
Then, 2 mL of 10% Folin–Ciocalteu reagent was added to 0.4 mL of the extract. After this, it was left
idle for 2–3 min. Finally, 1.6 mL (7.5%) of Na2 CO3 solution was added to the mixture, which was
incubated for 1 h in the dark, after which is was measured at 765 nm in a spectrophotometer (UV-1201,
Shimadzu, Kyoto, Japan) against a blank solution (0.4 mL water + 2 mL Folin–Ciocalteu reagent +
1.6 mL Na2 CO3 ). Using the gallic acid standard, the total phenolic content was computed as 1 mg gallic
acid equivalent (GAE) 100 g−1 . The results are reported as mg/gallic acid equivalents per gram/dry
weight. The Merck RQflex reflectometer was employed to analyze the ascorbic acid content (AA) in
the samples by adopting the protocol for the juice of red fruit. The results are given as mg ascorbic
acid/100 g fresh sample [21].
4. Results and Discussion
4.1. Results of the Weight Measurements in Strawberry Plants in Fresh and Dry Roots and Shoots
Table 1 shows that the difference between the fresh and dry weight values of the roots was
statistically significant for all three measurement dates. As the sound level increased, the root growth
regressed. For the measurement that was made 10 days after the initial sound application, the lowest
root weight was determined to belong to plants subjected to 105 dB sound, followed by those exposed
to the 100 dB level. The highest fresh and dry root weight values were found to be in the control
plants. The fresh and dry root weights of plants at the 95 dB level were equal to those of the control
plants. For the root weight measurements that were made 20 days after the initial sound application,
it was determined that the lowest fresh and dry values were in the plants that received sound at the
105 dB level, and the highest values were measured in the control plants. With respect to fresh weight
measurements, the sound levels fall into different statistical groups; for dry weight measurements,
only the application at 105 dB is significantly different from the others. Similar results were obtained
for the measurements that were made 30 days after the initial sound application. For the fresh root
weight, the control plants and the plants at the 95 dB level had similar values and fall into the same
statistical group. The weight decreased at 100 dB, the control group plants are included in the group
with the plants at 95 dB; the treatment at 105 dB, having the lowest root weight values, is in its own
group as it was significantly different from all other applications (Table 1).Agronomy 2018, 8, 127 6 of 13
Table 1. Fresh and dry weight changes in the roots and shoots. Measurements were made at 10-day
Agronomy 2018, 8, x FOR PEER REVIEW 6 of 12
intervals in plants that were exposed to different sound levels.
the second highest. The lowest shoot fresh weights were found in plants at the 100 dB and 105 dB
10 Days after the Sound Treatment 20 Days after the Sound Treatment 30 Days after the Sound Treatment
levels;
Sound
they were significantly different from the other two applications (control and 95 dB). For the
RFW RDW SFW SDW RFW RDW SDW RFW RDW SFW SDW
lastIntensity
measurement (g)
date,(g)
the differences
(g) (g)
between
(g)
the(g)
applications
SFW (g) were
(g)
not(g)
found to be significant
(g) (g) (g)
at a
Treatments
statistical level in terms of shoot dry weight values. However, it was determined that the shoot dry
95 dB 7.94 a 1.10 a 10.92 2.61 9.50 ab 1.38 a 17.84 ab 3.10 a 12.50 a 1.72 a 21.25 a 3.64
weight
100 dB values were
5.77 b lower
0.85 b in10.33
the plants2.56 that were
8.98 b exposed
1.32 a to bsounds
16.32 3.23 a at high
9.32 b levels
1.40 ab(Table 1 band3.37
19.18 Figure
3). 105 dB 4.74 b 0.64 b 9.13 2.20 6.30 c 0.78 b 15.05 b 2.95 b 8.86 c 0.96 b 18.52 b 3.22
Control 7.34 a 1.15 a 11.15 2.78 10.57 a 1.43 a 19.52 a 3.40 a 13.03 a 1.77 a 22.92 a 3.59
At 105 dB, as the sound level increased, the rate of the decrease in root dry weights was 44–46%
The means in the columns followed by different letters are significantly different (p < 0.05); RFW: root fresh weight;
for all
RDW:measurement
root dry weight; dates
SFW:compared with the
shoot fresh weight; SDW: control
shoot dry plants.
weight.The decrease in root dry weight values
at the 100 dB sound level was determined to occur at a rate of 8–26% compared to the control plants.
The Theshoot measurement
dry weight values results at in
105Table 1 for fresh
dB decreased at aand ratedry weights compared
of 10.3–21% of shoots show to the there
control was no
plants.
statistically
The shoot dry significant
weightdifference
values at in thethese
100 dBvaluessound between the applications
level decreased at a ratefor of
the5–8%
measurements
comparedmade to the
10 days after
control the(Figure
plants onset of3). theThe
sound application.
95 dB However,inlike
level is included thethesamerootgroup
weights, as the
thesoundcontrols magnitude
for most
negatively
measurements, affected shoot weight,
although 95 dB did thenotcontrol
causeplantsmuchhad weightthe highest
loss in the values,
rootsand andweight
shoots.decreased at
105 dB. In the second measurement, made 20 days after the initial sound application, the difference
between Tablethe1. applications
Fresh and drywas weight changes
found to bein the roots and significant
statistically shoots. Measurements
in terms of wereshootmade at 10-day
fresh and dry
intervals in plants that were exposed to different sound levels.
weight values. For the root fresh weight results, while 100 and 105 dB treatments are in the same
statistical group withafter
10 Days thethe lowest values, the control
Sound Treatment 20 Days afterplants, withTreatment
the Sound the highest 30 values,
Days afterfallsthe into
SoundaTreatment
separate
group,Soundshowing RFW a significant
RDW difference
SFW SDW compared to
RDW the 100 and 105SDW dB level applications.
RDW SFW 95
The SDWdB
Intensity RFW (g) SFW (g) RFW (g)
sound application
Treatments
(g) is in (g)an intermediary
(g) (g) group. For (g) the measurements (g) made 30 days (g) after(g) the initial
(g)
sound application,
95 dB 7.94 a the 1.10fresh
a shoot weight
10.92 2.61 results
9.50 ab were
1.38 a determined
17.84 ab 3.10 ato be significant
12.50 a 1.72 a at 21.25
a statistical
a 3.64
level.100The
dB control
5.77 b plants
0.85 bhad10.33 2.56 fresh
the highest 8.98 bweight 1.32 avalues,
16.32 and
b 3.23
theaplants 9.32 at
b 951.40 dBabhad19.18 thebsecond3.37
0.78
105 dB 4.74 b 0.64 b 9.13 2.20 6.30 c 15.05 b
highest. The lowest shoot fresh weights were found inb plants at the 100 dB and 105 dB levels; they were 2.95 b 8.86 c 0.96 b 18.52 b 3.22
Control
significantly 7.34 a
different 1.15
froma 11.15other2.78
the 10.57 a
two applications 1.43 a(control
19.52 a and 3.40
95a dB). 13.03
For a the1.77 lasta measurement
22.92 a 3.59
The means in the columns followed by different letters are significantly
date, the differences between the applications were not found to be significant at a statistical level in different (p < 0.05); RFW: root
terms fresh weight;
of shoot dryRDW:weight root dry weight;
values. However, SFW: it shoot
wasfresh weight; SDW:
determined that the shoot
shootdry dry
weight.
weight values were
lower in the plants that were exposed to sounds at high levels (Table 1 and Figure 3).
4.5
4 3.64 3.59
3.4 a 3.37
3.5 3.23 a 3.22
3.1 a
2.95 b
3 2.78
2.61 2.56
Shoot dry weight (g)
2.5 2.2
2
1.5
1
0.5
0
95 dB 100 dB 105 dB Control 95 dB 100 dB 105 dB Control 95 dB 100 dB 105 dB Control
Sound level (dB)
Figure 3. Shoot dry weight changes. Measurements were made at 10-day intervals in plants that were
Figure 3. Shoot dry weight changes. Measurements were made at 10-day intervals in plants that were
exposed to different sound levels. The means of different letters are significantly different (p < 0.05).
exposed to different sound levels. The means of different letters are significantly different (p < 0.05).
Energy metabolism (for example, sugar, lipid, and photosynthesis) is influenced as abiotic stress
increases [22–25]. For this reason, it is possible that metabolic responses to abiotic stress are gradual
and complex. Abiotic stress also influences various cellular processes like growth, photosynthesis,Agronomy 2018, 8, 127 7 of 13
At 105 dB, as the sound level increased, the rate of the decrease in root dry weights was 44–46%
for all measurement dates compared with the control plants. The decrease in root dry weight values
at the 100 dB sound level was determined to occur at a rate of 8–26% compared to the control plants.
The shoot dry weight values at 105 dB decreased at a rate of 10.3–21% compared to the control plants.
The shoot dry weight values at the 100 dB sound level decreased at a rate of 5–8% compared to the
control plants (Figure 3). The 95 dB level is included in the same group as the controls for most
measurements, although 95 dB did not cause much weight loss in the roots and shoots.
Energy metabolism (for example, sugar, lipid, and photosynthesis) is influenced as abiotic stress
increases [22–25]. For this reason, it is possible that metabolic responses to abiotic stress are gradual
and complex. Abiotic stress also influences various cellular processes like growth, photosynthesis,
carbon partitioning, carbohydrate–lipid metabolism, osmotic homeostasis, protein synthesis, and gene
expression [26–28].
On the other hand, DNA damage occurs due to UVBR, and photosynthesis, secondary metabolites,
and the synthesis of phenolic compounds are reduced [29–31].
4.2. Results of the Analysis of Strawberry Plants
When we consider the results of the analysis made 30 days after the initial sound applications at
different levels (in Table 2), we see that pH values were similar for all applications, ranging between 3.36
and 3.39. Similarly, total soluble solids (TSS) and titratable acidity (TTA) values were not significantly
affected by the sound applications at different levels. The TTS results were similar, ranging between
8.2 and 8.4. The TTA results were between 7.35 and 7.42. Although there were differences in total acid
(TA) for different applications, this difference was not at a statistically significant level. As the sound
level increased, the acid rates in the fruits increased. While the total acid was 21.36 in the fruits at the
105 dB sound level, this value was 19.55 in the control plants (Table 2).
Table 2. Measurements of several quality parameters of the fruits taken from plants 30 days after
exposure to different sound levels
Sound Intensity TTA TS TA TPC AA
pH TSS (%)
Treatments (g kg−1 ) (g kg−1 ) (g kg−1 ) (mg 100 g−1 Gallic Acid) (mg 100 g−1 )
95 dB 3.36 8.4 7.37 59.33 ab 19.82 279.5 b 28.3 b
100 dB 3.38 8.3 7.41 62.06 a 20.62 282.0 ab 31.8 a
105 dB 3.39 8.4 7.42 63.25 a 21.36 288.0 a 32.7 a
Control 3.36 8.2 7.35 57.95 b 19.55 275.5 b 27.4 b
The means in the columns followed by different letters are significantly different (p < 0.05); TSS: total soluble solids;
TS: total sugars; TTA: titratable acidity; TA: total acids; TPC: total phenolic content; AA: ascorbic acid.
It was determined that different sound levels caused statistically significant differences in total
sugar (TS), total phenol content (TPC), and ascorbic acid (AA). Total sugar increased for the applications
of 105 and 100 dB sound levels, falling into the same statistical group with values of 62.06 and 63.25.
The control group fruits, falling into a separate group, were determined to have 57.95 total sugar.
Plants exposed to the 95 dB sound level had total sugar that falls into the intermediary group with a
value of 59.33. Total phenol content also increased with the sound magnitude; the phenol contents
of the fruits at 105 dB was determined to be 288.0 and is included in a separate group. Total phenol
content was 275.5 in the control group plants, which was the lowest value, and it was 279.5 for plants
at the 95 dB sound level; these values are in the same statistical group. Total phenol content was 282.0
for the application at 100 dB, which is in the intermediary group. Ascorbic acid (AA) results were
similar to the patterns for TPC. While the ascorbic acid of the control plants was 27.4, which is the
lowest value, it was 28.3 at 95 dB; the control and 95 dB treatment are in the same group. The ascorbic
acid values for the 100 dB and 105 dB sound levels were 31.8 and 32.7, respectively. These are the
highest values, and these two applications were found to be in the same group (Table 2).Agronomy 2018, 8, 127 8 of 13
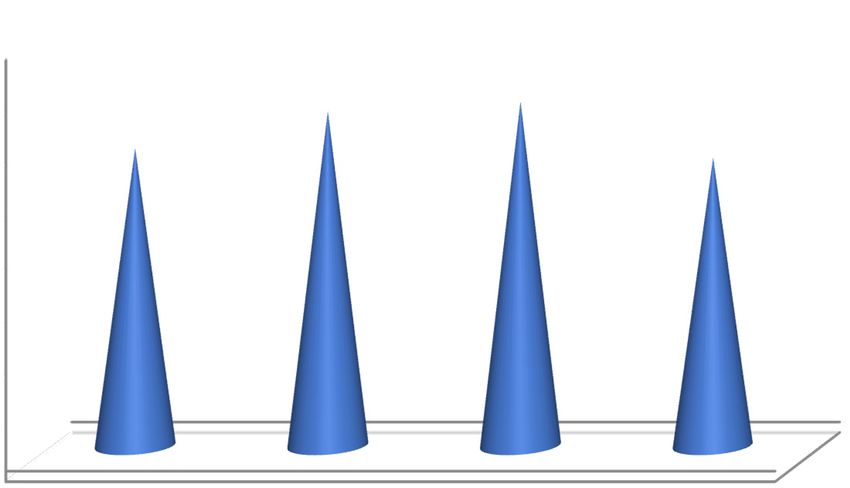
Total sugar (TS), total phenol content (TPC), and ascorbic acid (AA), which were detected at
statistically significant levels in the fruit analyses, increased with the increasing sound magnitudes.
Agronomy 2018, 8, x FOR PEER REVIEW 8 of 12
Total sugar increased at a rate of 9% in strawberry fruits at 105 dB compared to the control group,
and it increased at a rate of 7% at 100 dB (Figure 4). Total phenol content increased at a rate of 4.5%
Agronomy 2018, 8, x FOR PEER REVIEW
at
8 of 12
105 dB and at a rate of 2.4% at 100 dB. Ascorbic acid increased at a rate of 19% at 105 dB compared to
the control group and67 at a rate of 16% at 100 dB (Table 2 and Figure 5).
65 63.25 a
67 62.06 a
63
) kg -1)
65 63.25 a
61 59.33 ab 62.06 a
63 57.95 b
TS (g kgTS-1(g
59
61 59.33 ab
57 57.95 b
59
55
57
53
55 95 dB 100 dB 105 dB Control
53
95 dB 100 Sound
dB level 105
(dB)dB Control
Figure 4. Total sugars (TS) in strawberry fruits Sound levelafter
30 days (dB) exposure to different sound waves. The
means of different letters are significantly different (p < 0.05).
Figure4.4. Total
Figure sugars (TS)
Total sugars (TS) in
instrawberry
strawberryfruits
fruits3030days
days after
after exposure
exposure to different
to different sound
sound waves.
waves. The
The means of different letters are significantly different (p <
means of different letters are significantly different (p < 0.05). 0.05).
39
31.8 a 32.7 a
34 28.3 b
39 27.4 b
29 31.8 a 32.7 a
) g-1)
34 28.3 b
24 27.4 b
g-1100
29
19
(mg
24
100
14
AA (mgAA
19
9
14
4
9
-1
4 95 dB 100 dB 105 dB Control
-1 Sound level (dB)
95 dB 100 dB 105 dB Control
Figure 5. Total ascorbic acid (AA) in strawberry Soundfruits
level30 days after exposure to different sound waves.
(dB)
Figure 5. Total ascorbic acid (AA) in strawberry fruits 30 days after exposure to different sound waves. The
The means of different letters are significantly different (p < 0.05).
means of different letters are significantly different (p < 0.05).
Figure 5. Total ascorbic acid (AA) in strawberry fruits 30 days after exposure to different sound waves. The
The
The diversity
meansdiversity in the
thestructure
inletters
of different structure and
andfunction
are significantly function(pofof
different secondary
secondarymetabolites
< 0.05). metabolites makes
makes them
them necessary
necessary
because
because they are of
they are ofcritical
criticalimportance
importanceto to thethe survival
survival of plants
of plants under under
stressstress conditions
conditions [32].
[32]. Many
Many environmental
The diversity
environmental stresses stresses
in the(high/low (high/low
structure temperature,temperature,
and function drought,
of secondary
drought, alkalinity, alkalinity,
metabolites
salinity, UV salinity,
makes them
stress, UV stress,
and necessary
pathogen
and pathogen
because
infection) they
have infection)
are of critical
the have
potential the damaging
importance
for potential
to thefor damaging
survival
plants In plants
of plants
[3]. [3]. stress
under
laboratory In laboratory
conditions
conditions, conditions,
[32]. Many
production of
production
environmentalof secondary
stresses metabolites
(high/low was induced
temperature, anew
drought, by using elicitation
alkalinity, salinity,
secondary metabolites was induced anew by using elicitation [3,33]. Several researchers applied [3,33].
UV Several
stress, researchers
and pathogen
applied
various various
infection) have elicitors
elicitors theimprove
to to improve
potential secondary
for damaging
secondary metabolite
plants
metabolite [3]. In production
production in culturesin
laboratory of cultures
conditions, of
plant cells, plant cells,
production
tissues, of
and
tissues,
secondaryand organs
metabolites[34]. wasNutrient
induced stress
anewhasby an important
using influence
elicitation [3,33]. on phenolic
Several
organs [34]. Nutrient stress has an important influence on phenolic levels in plant tissues [3,34]. levels
researchers in plant
applied
tissues
various[3,34].
Pathogen Pathogen
elicitors
attack, toUV
improve attack, UVhigh-intensity
secondary
irradiation, irradiation,
metabolite high-intensity
production
light, wounds, inlight, wounds,
cultures
nutrient nutrient
ofdeficiency,
plant deficiency,
cells,temperature,
tissues, and
temperature,
herbicide herbicide
organs [34].treatment, treatment,
Nutrient stress
and other and other
has anenvironmentalenvironmental
important influence stress
stress onfactors factors
phenolic increase
levels in
increase the
theplant accumulation
tissues [3,34].
accumulation of
of phenylpropanoid
Pathogen attack, UV[35–37]. The
irradiation, effects of some
high-intensity secondary
light, plant
wounds, products
nutrient
phenylpropanoid [35–37]. The effects of some secondary plant products on growing conditions are on growing
deficiency, conditions
temperature,
are high
herbicide
high in treatment,
in terms terms of metabolic
of the theandmetabolic
other pathways thatresponsible
environmental
pathways that are are responsible
stress factors for accumulation
increase
for accumulation the of the related
accumulation
of the related of
natural
natural products. [35–37]. The effects of some secondary plant products on growing conditions are
phenylpropanoid
products.
high Sugar
in terms of the metabolic
accumulation pathwaysresult
is a common that are
of responsible
abiotic stress for(e.g.,
accumulation of the related
glucose, fructose, natural
and sucrose
products. along with other osmolytes, during cold treatment [38–40]). It was traditionally believed
accumulate,
Sugar accumulation
that osmolyte accumulation is aprotected
common plantresultcells
of abiotic
(eitherstress (e.g., glucose,
by osmotic adjustment fructose,
or byand sucrose
stabilizing
accumulate, along with other osmolytes, during cold treatment [38–40]).
membranes and proteins); however, in time, another role of osmolytes was proposed to be the It was traditionally believed
that osmolyte
regulation accumulation
of redox or sugar protected
signaling.plant
Thesecells (either might,
influences by osmotic adjustment
for instance, or byhexokinase-
involve stabilizingAgronomy 2018, 8, 127 9 of 13
Sugar accumulation is a common result of abiotic stress (e.g., glucose, fructose, and sucrose
accumulate, along with other osmolytes, during cold treatment [38–40]). It was traditionally
believed that osmolyte accumulation protected plant cells (either by osmotic adjustment or by
stabilizing membranes and proteins); however, in time, another role of osmolytes was proposed
to be the regulation of redox or sugar signaling. These influences might, for instance, involve
hexokinase-dependent signaling or interactions between trehalose synthesis and sugar and ABA
signaling [41,42]. It was been reported that ABA synthesis and signaling are important components
in sugar signaling. In plants, sugars play important roles as both nutrients and signal molecules.
Both glucose and sucrose are recognized as pivotal integrating regulatory molecules that control gene
expression related to plant metabolism, stress resistance, growth, and development [43–45]. It was
recently proposed that soluble sugars, especially when they are present at higher concentrations,
might act as reactive oxygen species (ROS) scavengers themselves [46]. All abiotic stresses generate
ROS, potentially leading to oxidative damage affecting crop yield and quality. In addition to the
well-known classical antioxidant mechanisms, sugars and sugar-metabolizing enzymes have entered
the picture as important players in the defense against oxidative stress [47].
Abiotic stress may be used in preharvest activities to improve the quality and yield of products [48].
For instance, vitamin C may be improved in plants that are exposed to high-intensity light or in plants
that have less frequent irrigation [49].
The environment affects the ascorbic acid concentration in the fruits and leaves [50,51]. The level
of synthesis controls the regulation of ascorbate levels in cells [52,53]. Recycling and degradation
(Pallanca and Smirnoff, Green and Fry [53,54]) and transport of this molecule in cells or between organs
(Horemans, Foyer, and Asard [55]) are also controlled by the synthesis. During the stress response
and the adaptation to stress, the recycling pathway is important. Reduced ascorbate, an antioxidant,
is oxidized into an unstable radical (monodehydroascorbate) in oxidative stress conditions; the oxidized
molecules then dissociate into ascorbate and dehydroascorbate.
Alessandra Ferrandino and Claudio Lovisolo [56] claimed that abiotic stress modified the growth
and development in all plant organs of grapevine plants. At the berry level, the response to abiotic
stress drives the accumulation of secondary metabolites in berry pulps, seeds, and skins as a defense
against cell damage. Viticultural trials may be designed to control plant stress response to increase
secondary metabolite concentrations.
Exposure of plants to unfavorable environmental conditions (e.g., heavy metals, drought,
nutrient deficiency, salt stress) can increase the production of reactive oxygen species (ROS).
To protect themselves against these toxic oxygen intermediates, plants employ antioxidant defense
systems [57]. To control the levels of ROS and to protect cells under stress conditions, plant tissues
contain several enzymes that scavenge ROS (SOD, CAT, peroxidases, and glutathione peroxidase),
detoxify LP products (glutathione-S-transferases, phospholipid-hydroperoxide glutathione peroxidase,
and ascorbate peroxidase), and a network of low molecular mass antioxidants (ascorbate, glutathione,
phenolic compounds, and tocopherols) [57]. Secondary metabolites are involved in protective functions
in response to both biotic and abiotic stress conditions. As determined in a recent study, environmental
factors increase the concentrations of phytochemicals [58]. Stress predominates among all the
factors that enhance the concentrations of phytochemicals in fruits and vegetables. This makes
sense when it is considered that all stress types (biotic/abiotic) are conducive to oxidative stress in
plants [59], and oxidative signaling controls synthesis and accumulation of secondary metabolites [60].
Plants produce phenolic compounds as a defensive mechanism to biotic/abiotic stresses [61].
In the strawberry plant in the fruit development stage, sound frequency stress promoted
metabolite accumulation, which resulted in an improvement in fruit quality.
5. Conclusions
In the present study, different sound waves with different decibel values at a constant frequency
were applied, and they caused decreases in the weight of roots and the green parts of the strawberryAgronomy 2018, 8, 127 10 of 13
plants. However, these different sound waves also caused some increases in several quality parameters
in the fruits at a statistically significant level. This increase, which also enhances the value of the fruit
and is important for human health, is positive. Salinity, drought, high temperature, and irreversible
abiotic stress factors reduce the growth and development of the plants, causing major losses in terms of
yield; plants even die under continuous stress. In further studies, greenhouse trials may be performed
at sound levels that do not affect plant development and yield at significant levels but increase fruit
quality. In this way, sound applications that do not damage the soil and plant but increase the quality
parameters in a positive manner may be recommended for greenhouse cultivation. In the present
study, the weight losses were found to be greater in plants at the 105 dB sound level. At 95 dB, on the
other hand, the results were close to those of the control group plants which were not exposed to
sound. For this reason, 1000 Hz and 100 dB sound levels may be used for the strawberry plant to
increase the quality of its fruits. However, in the future, it should be investigated whether it affects the
yield in greenhouse designs.
Author Contributions: H.O. and O.A. conceived and designed the experiments; H.O. performed parts of physics
and sound system of the experiments; O.A. performed the parts related to plants and O.A. analyzed the data;
O.A. contributed reagents/materials/analysis tools; H.O. and O.A. wrote the paper.
Funding: We thank Cukurova University Scientific Research Projects Directorate for their financial support.
And also, we thank to Ebru Kafkas and her laboratory team for strawberry fruits analyses.
Conflicts of Interest: The authors declare no conflict of interest.
References
1. Klein, B.P.; Perry, A.K. Ascorbic acid and vitamin A activity in selected vegetables from different geographical
areas of the United States. J. Food Sci. 1982, 47, 941–945. [CrossRef]
2. Robards, K.; Prenzler, P.D.; Tucker, G.; Swatsitang, P.; Glover, W. Phenolic compounds and their role in
oxidative processes in fruits. Food Chem. 1999, 66, 401–436. [CrossRef]
3. Akula, R.; Ravishankar, G.A. Influence of abiotic stress signals on secondary metabolites in plants.
Plant Signal. Behav. 2011, 6, 1720–1731. [CrossRef] [PubMed]
4. Ozkurt, H.; Altuntas, O. The Effect of Sound Waves at Different Frequencies upon the Plant Element
Nutritional Uptake of Snake Plant (Sansevieria trifasciata) Plants. Indian J. Sci. Technol. 2016, 9, 48–55.
[CrossRef]
5. Ozkurt, H.; Altuntas, O.; Bozdogan, E. The Effects of Sound Waves upon Plant Nutrient Elements Uptake of
Sword Fern (Nephrolepis exaltata) Plants. J. Basic Appl. Sci. Res. 2016, 6, 9–15.
6. Jaffe, M.J.; Leopold, A.C.; Staples, R.C. Thigmo responses inplants and fungi. Am. J. Bot. 2002, 89, 375–382.
[CrossRef] [PubMed]
7. Baluška, F.; Šamaj, J.; Wojtazek, P.; Volkmann, D.; Menzel, D. Cytoskeleton–plasma membrane–cell wall
continuum in plants. Emerging links revisited. Plant Physiol. 2003, 133, 483–491. [CrossRef] [PubMed]
8. Mary, M.; Braam, J. The Arabidopsis TCH4 xyloglucan endotransglyco-sylase. Plant Physiol. 1997, 115,
181–190.
9. Sistrunk, M.L.; Antosiewicz, D.M.; Purugganan, M.M.; Braam, J. Arabidopsis TCH3 encodes a novel Ca2+
binding protein and shows environmentally induced and tissue-specific regulation. Plant Cell 1994, 6,
1553–1565. [CrossRef] [PubMed]
10. Sato, Y.; Kadota, A.; Wada, M. Mechanically induced avoidance response of chloroplasts in fern protonemal
cells. Plant Physiol. 1999, 121, 37–44. [CrossRef] [PubMed]
11. Erner, Y.; Jaffe, M.J. Thigmomorphogenesis: The involvement of auxin and abscisic acid in growth retardation
due to mechanical perturbation. Plant Cell Physiol. 1982, 23, 935–941.
12. Wang, L.; Weller, C.L. Recent advances in extraction of nutraceuticals from plants. Trends Food Sci. Technol.
2006, 17, 300–312. [CrossRef]
13. Hou, T.Z.; Li, M.D. Experimental evidence of a plant meridian system: IV. The effects of acupuncture on
growth and metabolism of Phaseolus vulgaris L. beans. Am. J. Chin. Med. 1997, 25, 135–142. [CrossRef]
[PubMed]Agronomy 2018, 8, 127 11 of 13
14. Hou, T.Z.; Luan, J.Y.; Wang, J.Y.; Li, M.D. Experimental evidence of a plant meridian system: III. The sound
characteristics of Phylodendron (Alocasia) and effects of acupuncture on those properties. Am. J. Chin. Med.
1994, 22, 205–214. [CrossRef] [PubMed]
15. Hou, T.Z.; Re, Z.W.; Li, M.D. Experimental evidence of a plant meridian system: II. The effects of needle
acupuncture on the; temperature changes of soybean (Glycine max). Am. J. Chin. Med. 1994, 22, 103–110.
[CrossRef] [PubMed]
16. Yang, X.C.; Wang, B.C.; Duan, C.R.; Dai, C.Y.; Jia, Y.; Wang, X.J. Brief study on physiological effects of sound
field on actinidia Chinese callus. J. Chongqing Univ. 2002, 25, 79–84. (In Chinese)
17. Yang, X.C.; Wang, B.C.; Duan, C.R. Effects of sound stimulation on energy metabolism of Actinidia chinensis
callus. Colloids Surf. B Biointerfaces 2003, 30, 67–72.
18. Yang, X.C.; Wang, B.C.; Ye, M. Effects of different sound intensities on root development of Actinidia Chinese
plantlet. Chin. J. Appl. Environ. Biol. 2004, 10, 274–276. (In Chinese)
19. Taş, F. Internal Acoustic Research and Improvement Methods in a Commercial Vehicle. Ph.D. Thesis, Istanbul
Technical University, Istanbul, Turkey, 2010.
20. Hoagland, D.R.; Arnon, D.I. The water culture method for growing plants without soil. In Circular California
Agricultural Experiment Station; University of California: Berkeley, CA, USA, 1938; pp. 347–461.
21. Kafkas, E.; Koşar, M.; Paydaş, S.; Kafkas, S.; Başer, K.H.C. Quality characteristics of strawberry genotypes at
different maturation stages. Food Chem. 2007, 100, 1229–1236. [CrossRef]
22. Pinheiro, C.; Chaves, M.M. Photosynthesis and drought: Can we make metabolic connections from available
data? J. Exp. Bot. 2010, 62, 869–882. [CrossRef] [PubMed]
23. Cramer, G.R.; Ergül, A.; Grimplet, J.; Tillett, R.L.; Tattersall, E.A.; Bohlman, M.C.; Quilici, D. Water and
salinity stress in grapevines: Early and late changes in transcript and metabolite profiles. Funct. Integr. Genom.
2007, 7, 111–134. [CrossRef] [PubMed]
24. Kilian, J.; Whitehead, D.; Horak, J.; Wanke, D.; Weinl, S.; Batistic, O.; Harter, K. The AtGenExpress global
stress expression data set: Protocols, evaluation and model data analysis of UV-B light, drought and cold
stress responses. Plant J. 2007, 50, 347–363. [CrossRef] [PubMed]
25. Hasegawa, P.M.; Bressan, R.A.; Zhu, J.K.; Bohnert, H.J. Plant cellular and molecular responses to high salinity.
Annu. Rev. Plant Biol. 2000, 51, 463–499. [CrossRef] [PubMed]
26. Munns, R. Comparative physiology of salt and water stress. Plant Cell Environ. 2002, 25, 239–250. [CrossRef]
[PubMed]
27. Rosa, S.B.; Caverzan, A.; Teixeira, F.K.; Lazzarotto, F.; Silveira, J.A.; Ferreira-Silva, S.L.; Abreu-Neto, J.;
Margis, R.; Margis-Pinheiro, M. Cytosolic APx knockdown indicates an ambiguous redox responses in rice.
Phytochemistry 2010, 71, 548–558. [CrossRef] [PubMed]
28. Britt, A.B. Repair of DNA damage induced by solar UV. Photosynth. Res. 2004, 81, 105–112. [CrossRef]
29. Hilal, M.; Parrado, M.F.; Rosa, M.; Gallardo, M.; Orce, L.; Massa, E.M.; Prado, F.E. Epidermal lignin deposition
in quinoa cotyledons in response to UV-B radiation. Photochem. Photobiol. 2004, 79, 205–210. [CrossRef]
30. Ibañez, S.; Rosa, M.; Hilal, M.; González, J.A.; Prado, F.E. Leaves of Citrus aurantifolia exhibit a different
sensibility to solar UV-B radiation according to development stage in relation to photosynthetic pigments
and UV-B absorbing compounds production. J. Photochem. Photobiol. B Biol. 2008, 90, 163–169. [CrossRef]
[PubMed]
31. Bartwal, A.; Mall, R.; Lohani, P.; Guru, S.K.; Arora, S. Role of secondary metabolites and brassinosteroids in
plant defense against environmental stresses. J. Plant Growth Regul. 2013, 32, 216–232. [CrossRef]
32. Seigler, D.S. Plant Secondary Metabolism; Kluwer Academic Publishers: Boston, MA, USA, 1998.
33. DiCosmo, F.; Misawa, M. Eliciting secondary metabolism in plant cell cultures. Trends Biotechnol. 1985, 3, 318.
[CrossRef]
34. Sudha, G.; Ravishankar, G.A. Influence of methyl jasmonate and salicylic acid in the enhancement of
capsaicin production in cell suspension cultures of Capsicum frutescens Mill. Curr. Sci. 2003, 85, 1212–1217.
35. Karuppusamy, S. A review on trends in production of secondary metabolites from higher plants by in vitro
tissue, organ and cell cultures. J. Med. Plants Res. 2009, 3, 1222–1239.
36. Dixon, R.A.; Paiva, N.L. Stress-induced phenylpropanoid metabolism. Plant Cell 1995, 7, 1085. [CrossRef]
[PubMed]Agronomy 2018, 8, 127 12 of 13
37. Cook, D.; Fowler, S.; Fiehn, O.; Thomashow, M.F. A prominent role for the CBF cold response pathway
in configuring the low-temperature metabolome of Arabidopsis. Proc. Natl. Acad. Sci. USA 2004, 101,
15243–15248. [CrossRef] [PubMed]
38. Chalker-Scott, L.; Fnchigami, L.H. The role of phenolic compounds in plant stress responses. In Low
Temperature Stress Physiology in Crops; Paul, H.L., Ed.; CRC Press Inc.: Boca Raton, FL, USA, 1989; p. 40.
39. Kaplan, F.; Kopka, J.; Sung, D.Y.; Zhao, W.; Popp, M.; Porat, R.; Guy, C.L. Transcript and metabolite profiling
during cold acclimation of Arabidopsis reveals an intricate relationship of cold-regulated gene expression
with modifications in metabolite content. Plant J. 2007, 50, 967–981. [CrossRef] [PubMed]
40. Wingler, A.; Roitsch, T. Metabolic regulation of leaf senescence: Interactions of sugar signalling with biotic
and abiotic stress responses. Plant Biol. 2008, 10, 50–62. [CrossRef] [PubMed]
41. Hare, P.D.; Cress, W.A.; Van Staden, J. Dissecting the roles of osmolyte accumulation during stress.
Plant Cell Environ. 1998, 21, 535–553. [CrossRef]
42. Avonce, N.; Leyman, B.; Mascorro-Gallardo, J.O.; Van Dijck, P.; Thevelein, J.M.; Iturriaga, G. The Arabidopsis
trehalose-6-P synthase AtTPS1 gene is a regulator of glucose, abscisic acid, and stress signalling. Plant Physiol.
2004, 136, 3649–3659. [CrossRef] [PubMed]
43. Pego, J.V.; Kortstee, A.J.; Huijser, C.; Smeekens, S.C.M. Photosynthesis, sugars and the regulation of gene
expression. J. Exp. Bot. 2000, 51, 407–416. [CrossRef] [PubMed]
44. Ramon, M.; Rolland, F.; Sheen, J. Sugar sensing and signaling. The Arabidopsis Book. Am. Soc. Plant Biol.
2008. [CrossRef]
45. Van den Ende, W.; Valluru, R. Sucrose, sucrosyl oligosaccharides, and oxidative stress: Scavenging and
salvaging? J. Exp. Bot. 2009, 60, 9–18. [CrossRef] [PubMed]
46. Bolouri-Moghaddam, M.R.; Le Roy, K.; Xiang, L.; Rolland, F.; Van den Ende, W. Sugar signalling and
antioxidant network connections in plant cells. FEBS J. 2010, 277, 2022–2037. [CrossRef] [PubMed]
47. Kalt, W.; Ryan, D.A.J.; Duy, J.C.; Prior, R.L.; Ehlenfeldt, M.K.; Vander Kloet, S.P. Interspecific variation in
anthocyanins, phenolics, and antioxidant capacity among genotypes of highbush and lowbush blueberries
(Vaccinium section cyanococcus spp.). J. Agric. Food Chem. 2001, 49, 4761–4767. [CrossRef] [PubMed]
48. Lee, S.K.; Kader, A.A. Preharvest and postharvest factors influencing vitamin C content of horticultural
crops. Postharvest Biol. Technol. 2000, 20, 207–220. [CrossRef]
49. Dumas, Y.; Dadomo, M.; Di Lucca, G.; Grolier, P. Effects of environmental factors and agricultural techniques
on antioxidantcontent of tomatoes. J. Sci. Food Agric. 2003, 83, 369–382. [CrossRef]
50. Bartoli, C.G.; Yu, J.; Gomez, F.; Fernández, L.; McIntosh, L.; Foyer, C.H. Inter-relationships between light
and respiration in the control of ascorbic acid synthesis and accumulation in Arabidopsis thaliana leaves.
J. Exp. Bot. 2006, 57, 1621–1631. [CrossRef] [PubMed]
51. Smirnoff, N.; Conklin, P.L.; Loewus, F.A. Biosynthesis of ascorbic acid in plants: A renaissance. Annu. Rev.
Plant Biol. 2001, 52, 437–467. [CrossRef] [PubMed]
52. Pallanca, J.E.; Smirnoff, N. The control of ascorbic acid synthesis and turnover in pea seedlings. J. Exp. Bot.
2000, 51, 669–674. [CrossRef] [PubMed]
53. Green, M.A.; Fry, S.C. Vitamin C degradation in plant cells via enzymatic hydrolysis of 4-O-oxalyl-L-threonate.
Nature 2005, 433, 83–87. [CrossRef] [PubMed]
54. Horemans, N.; Foyer, C.H.; Asard, H. Transport and action of ascorbate at the plant plasma membrane.
Trends Plant Sci. 2000, 5, 263–267. [CrossRef]
55. Ferrandino, A.; Lovisolo, C. Abiotic stress effects on grapevine (Vitis vinifera L.): Focus on abscisic
acid-mediated consequences on secondary metabolism and berry quality. Environ. Exp. Bot. 2014, 103,
138–147. [CrossRef]
56. Gill, S.S.; Tuteja, N. Reactive oxygen species and antioxidant machinery in abiotic stress tolerance in crop
plants. Plant Physiol. Biochem. 2010, 48, 909–930. [CrossRef] [PubMed]
57. Poiroux-Gonord, F.; Bidel, L.P.; Fanciullino, A.L.; Gautier, H.; Lauri-Lopez, F.; Urban, L. Health benefits of
vitamins and secondary metabolites of fruits and vegetables and prospects to increase their concentrations
by agronomic approaches. J. Agric. Food Chem. 2010, 58, 12065–12082. [CrossRef] [PubMed]
58. Grassmann, J.; Hippeli, S.; Elstner, E.F. Plant’s defence and its benefits for animals and medicine: Role of
phenolics and terpenoids in avoiding oxygen stress. Plant Physiol. Biochem. 2002, 40, 471–478. [CrossRef]
59. Kunz, D.A.; Chen, J.L.; Pan, G. Accumulation of α-keto acids as essential components in cyanide assimilation
by Pseudomonas fluorescens NCIMB 11764. Appl. Environ. Microbiol. 1998, 64, 4452–4459. [PubMed]You can also read