PDZ Binding Kinase/T-LAK Cell-Derived Protein Kinase Plays an Oncogenic Role and Promotes Immune Escape in Human Tumors
←
→
Page content transcription
If your browser does not render page correctly, please read the page content below
Hindawi
Journal of Oncology
Volume 2021, Article ID 8892479, 16 pages
https://doi.org/10.1155/2021/8892479

Research Article
PDZ Binding Kinase/T-LAK Cell-Derived Protein Kinase Plays an
Oncogenic Role and Promotes Immune Escape in Human Tumors

          Tingting Feng ,1,2,3 Yan Zhang ,4 Sunbin Ling ,5 Chenyang Xu ,1 Yingqi Lyu ,1
          Tingting Lu ,1 Xinyuan Liu ,1 Lisha Ying ,3 Yafeng Wan ,5 Haijun Zhong ,2
          and Dan Su 1
          1
            Department of Pathology, The Cancer Hospital of the University of Chinese Academy of Sciences (Zhejiang Cancer Hospital),
            Institute of Basic Medicine and Cancer (IBMC), Chinese Academy of Sciences, Hangzhou, Zhejiang 310022, China
          2
            Department of Colorectal Medicine, The Cancer Hospital of the University of Chinese Academy of Sciences
            (Zhejiang Cancer Hospital), Institute of Basic Medicine and Cancer (IBMC), Chinese Academy of Sciences, Hangzhou,
            Zhejiang 310022, China
          3
            Cancer Research Institute, The Cancer Hospital of the University of Chinese Academy of Sciences (Zhejiang Cancer Hospital),
            Institute of Basic Medicine and Cancer (IBMC), Chinese Academy of Sciences, Hangzhou, Zhejiang 310022, China
          4
            Department of Gerontology, The Second Affiliated Hospital of Zhejiang University School of Medicine, Hangzhou,
            Zhejiang 310009, China
          5
            Department of Hepatobiliary and Pancreatic Surgery, The Center for Integrated Oncology and Precision Medicine,
            Affiliated Hangzhou First People’s Hospital, Zhejiang University School of Medicine, Hangzhou 310006, China

          Correspondence should be addressed to Haijun Zhong; zhj1712@aliyun.com and Dan Su; sudan@zjcc.org.cn

          Received 31 May 2021; Accepted 5 September 2021; Published 24 September 2021

          Academic Editor: Dali Zheng

          Copyright © 2021 Tingting Feng et al. This is an open access article distributed under the Creative Commons Attribution License,
          which permits unrestricted use, distribution, and reproduction in any medium, provided the original work is properly cited.
          Background. PDZ binding kinase (PBK)/T-LAK cell-derived protein kinase (TOPK) is an important mitotic kinase that promotes
          tumor progression in some cancers. However, the pan-cancer analysis of PBK/TOPK and its role in tumor immunity are limited.
          Methods. The oncogenic and immune roles of PBK in various cancers were explored using multiple databases, including
          Oncomine, Human Protein Atlas, ULCAN, Tumor Immune Estimation Resource 2.0, STRING, and Gene Expression Profiling
          Interactive Analysis 2, and data collected from The Cancer Genome Atlas and Genotype-Tissue Expression Project. Several
          bioinformatics tools and methods were used for quantitative analyses and panoramic descriptions, such as the DESeq2 and Tumor
          Immune Dysfunction and Exclusion (TIDE) algorithm. Results. PBK was expressed at higher levels in most solid tumors than in
          normal tissues in multiple databases. PBK was associated with an advanced tumor stage and grade and a poor prognosis in most
          cases. PBK was associated with tumor immune cell infiltration in most cases and was especially positively correlated with TAMs,
          Tregs, MDSCs, and T cell exhaustion in KIRC, LGG, and LIHC. PBK was closely related to TMB, MSI, and immune checkpoint
          genes in various cancers, and patients with higher expression of PBK in KIRC, LGG, and LIHC had higher TIDE scores and lower
          immune responses in the predicted results. PBK was closely related to cell cycle regulation and immune-related processes in LIHC
          and LGG according to GO and KEGG enrichment analyses. Conclusions. PBK may play an oncogenic role in most solid tumors
          and promotes immune escape, especially in KIRC, LGG, and LIHC. This study suggests the potential value of PBK inhibitors
          combined with immunotherapy.

1. Introduction                                                        protein kinase (TOPK) is a serine-threonine protein kinase
                                                                       identified from a cDNA library of activated lymphokine-
PDZ binding kinase (PBK) is a kinase that binds to the PDZ2            activated killer T cells [2], and PBK was later identified as the
region of HDIG as first identified by an investigator                    same molecule as TOPK by a sequence analysis, hence re-
screening a yeast two-hybrid system [1], and the gene was              ceiving the name PBK/TOPK. PBK/TOPK is a potential
cloned from a HeLa cell cDNA library. T-LAK cell-derived               target for antitumor therapy. First, based on the distribution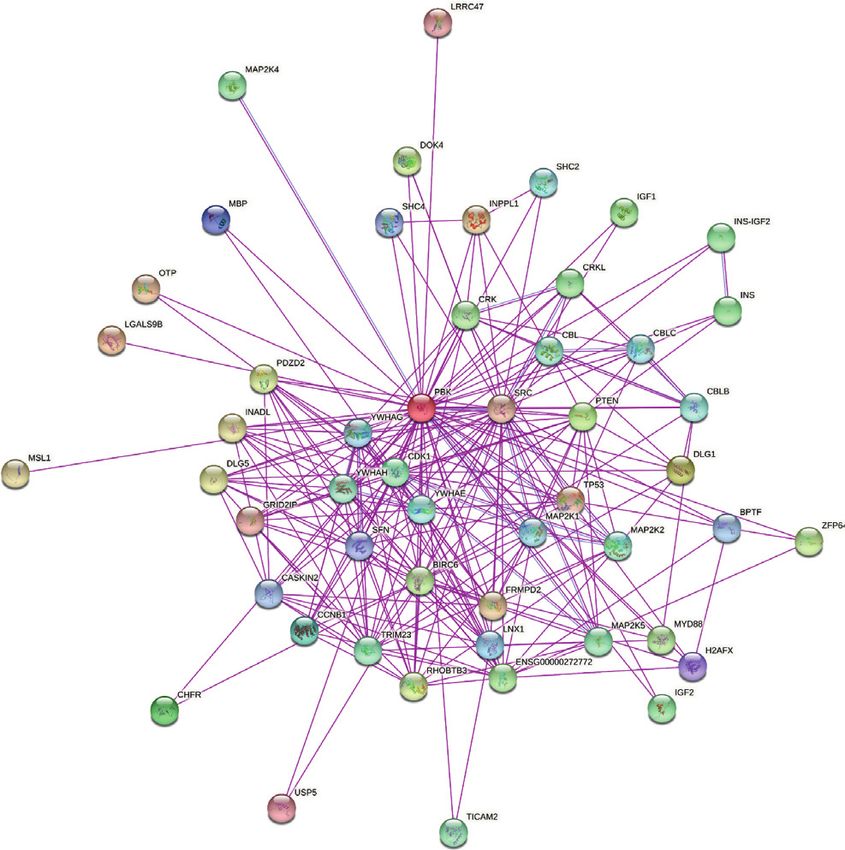
2                                                                                                          Journal of Oncology

of its expression, PBK/TOPK is rarely expressed in normal          ENSG00000168078-PBK/TOPK/pathology). Differences in
tissues, as its expression is detected only in testicular and      PBK/TOPK protein levels were analyzed with the “CPTAC
embryonic tissues but is expressed at high levels in some          analysis” module in the UALCAN portal database (http://
malignancies; its expression level is negatively correlated        ualcan.path.uab.edu/) [15]. Differences in PBK/TOPK protein
with patient prognosis [3–5]. Second, regarding the mo-            expression between tumors (breast cancer, ovarian cancer,
lecular mechanism, PBK/TOPK, a mitotic kinase is involved          colon cancer, clear cell renal cell carcinoma, uterine corpus
in regulating multiple important signaling pathways such as        endometrial carcinoma, lung adenocarcinoma, and pediatric
p53 [6], MAPK [3], and PI3K/AKT [7], playing an important          brain cancer) and paired normal tissues were analyzed.
role in the process of tumorigenesis and tumor progression.            Cancers’ name abbreviations were given as follows:
Third, regarding the molecular properties, PBK/TOPK is a           adrenocortical carcinoma (ACC); Bladder Urothelial
serine-threonine protein kinase, and several PBK/TOPK              Carcinoma (BLCA); breast invasive carcinoma (BRCA);
specific inhibitors have been screened, such as HI-TOPK-            cervical squamous cell carcinoma and endocervical ade-
032, OTS514, and OTS964. In animal models, these in-               nocarcinoma (CESC); cholangiocarcinoma (CHOL); co-
hibitors effectively inhibit the development of multiple            lon adenocarcinoma (COAD); Lymphoid Neoplasm
malignant tumors with fewer toxic side effects [8–10],              Diffuse Large B-cell Lymphoma (DLBCL); esophageal
showing good clinical prospects.                                   carcinoma (ESCA); glioblastoma multiforme (GBM);
    Furthermore, several recent studies have suggested that        Head and Neck squamous cell carcinoma (HNSC); Kidney
PBK/TOPK may be associated with tumor-infiltrating im-              Chromophobe (KICH); kidney renal clear cell carcinoma
mune cells and have a potential target for cancer immu-            (KIRC); kidney renal papillary cell carcinoma (KIRP);
notherapy [5, 11, 12]. This study is the first to conduct a pan-    Acute Myeloid Leukemia (LAML); Brain Lower Grade
cancer analysis of PBK/TOPK using Oncomine, Human                  Glioma (LGG); liver hepatocellular carcinoma (LIHC);
Protein Atlas(HPA), ULCAN, the Tumor Immune Esti-                  lung adenocarcinoma (LUAD); Lung squamous cell
mation Resource 2.0 (TIMER2.0), STRING, Gene Expres-               carcinoma (LUSC); Mesothelioma (MESO); ovarian se-
sion Profiling Interactive Analysis 2 (GEPIA2), and the data        rous cystadenocarcinoma (OV); pancreatic adenocarci-
collected from The Cancer Genome Atlas (TCGA) and                  noma (PAAD); Pheochromocytoma and Paraganglioma
Genotype-Tissue Expression Project (GTEx). The results of          Prostate adenocarcinoma (PCPG); Prostate adenocarci-
this study showed the potential correlation and mechanism          noma (PRAD); rectum adenocarcinoma (READ); Sar-
of PBK/TOPK and tumor-immune interactions.                         coma (SARC); Skin Cutaneous Melanoma (SKCM);
                                                                   stomach adenocarcinoma (STAD); Testicular Germ Cell
2. Materials and Methods                                           Tumors (TGCT); Thyroid carcinoma (THCA); Thymoma
                                                                   (THYM); Uterine Corpus Endometrial Carcinoma
2.1. Analysis of PBK/TOPK Expression. Differences in PBK/           (UCEC); Uterine Carcinosarcoma (UCS); Uveal Mela-
TOPK mRNA expression across cancers in the Oncomine                noma (UVM); renal cell carcinoma (RCC).
database (https://www.oncomine.org/) were analyzed. The
thresholds were set as a fold change of 1.5 and P value of
0.001.                                                             2.2. Survival Analysis Based on PBK/TOPK Expression.
     RNAseq data from TCGA and GTEx were downloaded                The patients were stratified based on the expression of the
from UCSC XENA (https://xenabrowser.net/datapages/)                PBK/TOPK mRNA in tumors and adjacent noncancerous
[13]. All RNAseq data were processed using the Toil process        tissues using a bipartite method and were divided into two
in TPM format. Notably, 33 cancers and 31 types of normal          groups: PBK/TOPK high expression and PBK/TOPK low
tissues (N � 15776) were included in the gene expression           expression groups. The correlation of PBK/TOPK expres-
analysis. The difference in PBK/TOPK mRNA expression                sion with overall survival (OS) was analyzed with the
between tumors and paired adjacent noncancerous tissues            Kaplan–Meier survival analysis.
from TCGA data was analyzed. Differences in PBK/TOPK
mRNA expression between tumors and unpaired normal
tissues from TCGA and GTEx data were also analyzed. The            2.3. Analysis of the Correlation of PBK/TOPK Expression with
RNAseq data in TPM (transcripts per million reads) format          Immune Cell Infiltration. The immune cell infiltration score
were log2 transformed. If not stated otherwise, the analysis       data were downloaded from the Timer2.0 database (http://
of “TCGA” in this study was based on the data downloaded           timer.comp-genomics.org/) [16]. TIMER2.0 is a compre-
from UCSC Xena.                                                    hensive resource for the systematical analysis of immune cell
     Protein expression in 20 cancers (breast cancer, carcinoid,   infiltrates and tumor immunological, clinical, and genomic
cervical cancer, colorectal cancer, endometrial cancer, glioma,    features across diverse cancer types. “PBK/TOPK” was input
head and neck cancer, liver cancer, lung cancer, lymphoma,         in the “Gene” of the “Immune Association” module. The
melanoma, ovarian cancer, pancreatic cancer, prostate cancer,      association of PBK/TOPK with selected immune cell types
renal cancer, skin cancer, stomach cancer, testis cancer,          was analyzed. Timer2.0 provides six immune estimation
thyroid cancer, and urothelial cancer) in the HPA database         algorithms, among which TIMER algorithms is the only one
(https://www.proteinatlas.org/) was analyzed [14]. Images of       that considers tissue specificity. The associated data was
immunohistochemical staining were available from the Hu-           downloaded from the “Table” module of TIMER2.0, and we
man Protein Atlas version 20.1 (https://www.proteinatlas.org/      present the TIMER algorithms-associated data of “T-cell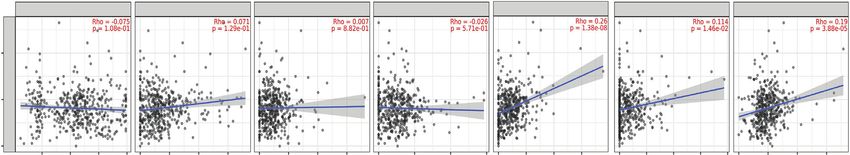
Journal of Oncology                                                                                                             3

CD8+,” “T-cell CD4+,” “B cell,” “Neutrophil,” “Macro-              “correlation analysis” module was used to analyze the
phage,” and “Myeloid dendritic cell” across cancers as a           Pearson correlation coefficients of PBK/TOPK with the top
heatmap with R software v4.0.3 and the “ComplexHeatmap”            100 selected genes. The results were visualized by con-
R package [17]. To further analyze the relationship of PBK         structing a dot plot. Then, we used TIMER2.0 to verify the
with tumor-killing immune cells (CD8+ T cell and NK cell)          correlation of PBK/TOPK expression with the five highest
as well as immune cells that facilitate tumor immune escape        PBK/TOPK-correlated genes in GEPIA2. BIO-
(M2 macrophage, Tregs, cancer-associated fibroblast                 INFORMATICS & EVOLUTIONARY GENOMICS, a web
(CAFs), and Myeloid-derived suppressor cells (MDSCs)) in           viewer that calculates and draws Venn diagrams (http://
KIRC, LGG, and LIHC, we displayed the images of the                bioinformatics.psb.ugent.be/webtools/Venn/), was used to
relevant data derived from the analysis based on the               prepare the Venn diagrams of the PBK/TOPK-binding and
QUANTISEQ, MCP-COUNTER, and Tumor Immune                           related genes. These selected genes and the differentially
Dysfunction and Exclusion (TIDE) algorithms in the                 expressed genes between the PBK/TOPK high expression
TIMER2.0. The partial correlation (cor) values and P values        and low expression groups of KIRC, LGG, and LIHC in
were analyzed using Spearman’s rank correlation test.              TCGA were subjected to KEGG and GO pathway en-
                                                                   richment analysis.
2.4. Analysis of the Correlation between PBK/TOPK Expres-
sion and Tumor Mutational Burden and Microsatellite                2.8. Statistical Analysis. All statistical analyses of the
Instability. TMB (tumor mutation burden) is derived from           RNAseq data of TCGA were performed using R software
the article The Immune Landscape of Cancer published by            v4.0.3. The Wilcoxon rank-sum test was used to analyze the
Vesteinn Thorsson et al. in 2018 [18]. MSI (microsatellite         expression differences between tumor and normal tissues.
instability) is derived from the Landscape of Microsatellite       ANOVA was used for PBK/TOPK mRNA expression
Instability Across 39 Cancer Types published by Russell            comparison between the different pathological stages. The
Bonneville et al. in 2017 [19]. Spearman’s rank correlation        Shapiro–Wilk normality test was used to determine the
coefficients were calculated to analyze the correlations of          normal distribution of the data, and Levene’s test was used
PBK/TOPK expression with the TMB and the MSI of each               for the homogeneity of variance analysis. One-way ANOVA
tumor sample.                                                      was used if variances were homogeneous, and Welch’s one-
                                                                   way ANOVA was used if variances were not homogeneous.
2.5. Analysis of the Correlation between PBK/TOPK Expres-          The student’s t-test was used for expression comparison of
sion and the Immune Response. The association of PBK/              PBK/TOPK between different tumor grade groups. Inde-
TOPK expression with immune checkpoint gene expression             pendent samples t-tests were used if the data had a normal
in pan-cancers from TCGA was analyzed.                             distribution, and Welch’s t-tests were used if the data were
    Potential immune checkpoint inhibitor (ICI) response           not normally distributed. The correlation of PBK/TOPK
was predicted with the TIDE algorithm [20, 21].                    expression and OS was analyzed with the Kaplan–Meier
                                                                   survival analysis. The “survival” R package was used for
                                                                   statistical analysis. Spearman’s rank correlation coefficient
2.6. Analysis of the Correlation between PBK/TOPK Expres-          was used to analyze the correlations of PBK/TOPK ex-
sion and DNA Mismatch Repair Genes and                             pression and TMB, MSI, immune checkpoint gene ex-
Methyltransferases. The association of PBK/TOPK expres-            pression, DNA mismatch repair gene expression, and
sion with the expression of DNA mismatch repair gene               methyltransferase gene expression. The “clusterProfiler” was
(MLH1, MSH2, MSH6, and PMS2) and methyltransferases                used for GO and KEGG enrichment analysis. And the
gene (DNMT1, DNMT3A, and DNMT3B) [22] was analyzed                 “org.Hs.eg.db” R package (V.3.10.0) was used for ID
using the RNAseq data of 33 cancers from TCGA.                     transformation. We limit species to “Homo sapiens.” The
                                                                   thresholds were set as a fold change of 1.0 and P value of 0.05
2.7. Gene Enrichment Analysis. STRING (https://www.                in the TCGA datasets. The “ ggplot2” and “ggpubr” R
string-db.org/) [23] and GEPIA2 (http://gepia2.cancer-             packages were used to generate boxplots, violin plots, lol-
pku.cn/) were used for the PBK/TOPK-associated enrich-             lipop charts, and Bubble charts. The “forestplot” R package
ment analysis. “PBK/TOPK” was input into the “SEARCH”              and “survminer” R package were used to generate forest
module, and “Homo sapiens” was subsequently selected. We           plots and survival curves. The “ComplexHeatmap” was used
next set the following parameters: network type (“full net-        to generate heatmaps. A P value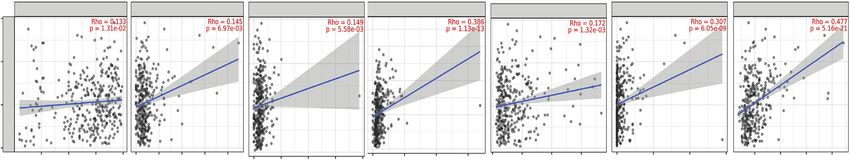
4                                                                                                          Journal of Oncology

CNS cancer, cervical cancer, colorectal cancer, esophageal       contained histologic grade information. The expression of
cancer, gastric cancer, head and neck cancer, liver cancer,      PBK/TOPK increased from pathologic stages I to IV in
lung cancer, lymphoma, ovarian cancer, pancreatic cancer,        various cancers including ACC, KICH, KIRC, KIRP, and
prostate cancer, and sarcoma (Figure 1(a)). Meanwhile,           LUAD. The expression of PBK/TOPK increased in LIHC
lower expression of the PBK/TOPK mRNA was observed in            from stages I to II but was a lower expression in stage IV.
the leukemia datasets. Notably, higher PBK/TOPK mRNA             Although elevated PBK expression in stages II and III
expression was found in 9 datasets, and lower PBK/TOPK           compared to stage I was found in BRCA, no statistical
mRNA expression was found in 1 dataset of breast cancer.         difference was found in the comparison between the other
Next, we analyzed PBK/TOPK mRNA expression in various            staging groups. However, PBK/TOPK mRNA expression
cancers from TCGA. First, we performed paired compari-           was negatively correlated with the pathological stage of
sons of differences in PBK/TOPK mRNA expression levels            COAD (Figure 2(a)). And no significance was found in 15
between cancer and normal tissues from individuals with the      cancers including BLCA, CESC, CHOL, DLBC, ESCA,
same cancer. Only 18 tumors were eligible, and PBK/TOPK          HNSC, LUSC, MESO, OV, READ, SKCM, TGCT, THCA,
mRNA expression showed no significant differences only in          UCS, and UVM (Figures S1A–S10). In addition, we explored
PAAD and READ. Higher PBK/TOPK mRNA expression                   the correlation between the expression of the PBK/TOPK
levels were detected in other tumors, such as BLCA, BRCA,        mRNA and the tumor grade. Higher expression of PBK/
CHOL, COAD, ESCA, HNSC, KICH, KIRC, KIRP, LIHC,                  TOPK mRNA was found in high-grade (G3&G4) tumors
LUAD, LUSC, PRAD, READ, STAD, THCA, and UCEC,                    than in low-grade (G1&G2) tumors of BLCA, CESE, CHOL,
than in tumor tissues compared to normal tissues                 HNSC, KIRC, LGG, LIHC, PAAD, UCEC, and UCS
(Figure 1(b); for additional details, see Table S1). Then, the   (Figure 2(b)). And no significance was found in ESCA and
normal tissues from GTEx were included. We reconfirmed            OV (Figures S1P-S1Q).
the similar expression in the 18 cancers. Higher expression
of the PBK/TOPK mRNA was detected in the following 12
                                                                 3.3. PBK/TOPK Is Associated with Prognosis in Multiple
cancers: ACC, CESC, DLBC, GBM, HNSC, LGG, OV,
                                                                 Cancers. In this study, we first explored the correlation of
PAAD, PCPG, READ, SKCM, and THYM, while no sig-
                                                                 PBK/TOPK mRNA expression with 33 cancers in TCGA
nificance was found in SARC. Because of the lack of matched
                                                                 using the Kaplan–Meier survival analysis. As shown in
normal tissues, MESO was not conducted statistical dif-
                                                                 Figure 3(a), the expression of PBK/TOPK was negatively
ference analysis (Figure 1(c); for additional details, see
                                                                 correlated with the OS of patients with 9 tumors including,
Table S1). Similar to the Oncomine results, lower expression
                                                                 including ACC (HR � 5.22, log-rank P < 0.001), KIRC
of PBK/TOPK was observed in LAML tissues than that in
                                                                 (HR � 1.48, log-rank P � 0.011), KIRP (HR � 2.87, log-rank
normal tissues. Combining the aforementioned data, we
                                                                 P � 0.001), LGG (HR � 2.50, log-rank P < 0.001), LIHC
found that the PBK/TOPK mRNA appeared to be expressed
                                                                 (HR � 1.63, log-rank P � 0.005), LUAD (HR � 1.56, log-rank
at high levels in 30 cancers, except LAML, SARC, and
                                                                 P � 0.002), MESO (HR � 2.41, log-rank P < 0.001), PAAD
MESO.
                                                                 (HR � 1.65, log-rank P � 0.016), and PCPG (HR � 6.72, log-
    The expression of the PBK/TOPK protein was obtained
                                                                 rank P � 0.038). Meanwhile, PBK/TOPK expression was
from the Human Protein Atlas and CPTAC datasets.
                                                                 found to play a protective role in THYM (HR � 0.08, log-
Moderate nuclear and cytoplasmic positivity was observed
                                                                 rank P � 0.002). The KM curves for the 10 tumors listed
in varying fractions of cells in several cases of ovarian,
                                                                 above are shown in Figure 3(b).
colorectal, melanoma, breast, stomach, testis, and cervical
cancers. The remaining cancer tissues including urothelial
carcinoma, prostate cancer, skin basal cell carcinoma,           3.4. PBK/TOPK Is Correlated with Tumor Immune Cell
pancreatic adenocarcinoma, Hodgkin lymphoma, glioma,             Infiltration. Immune infiltration cells in the tumor micro-
oral squamous carcinoma, hepatocellular carcinoma, and           environment have been shown to play a key role in the
lung squamous carcinoma showed weak staining                     occurrence and progression of cancer. Immune infiltration
(Figure 1(d)). Endometrial cancer, renal cancer, carcinoid       cells affect the effect of clinical treatments for cancer. A
cancer, and thyroid cancer generally exhibited negative          comprehensive analysis of immune infiltration cells will
staining. We confirmed the high expression of the PBK/            elucidate the mechanism of cancer immune escape, thus
TOPK protein in COAD and OV in the CPTAC datasets. In            providing an opportunity to develop new therapeutic
addition, we also observed high expression of PBK/TOPK in        strategies [24]. Tumor purity was a major confounding
UCEC and RCC tissues compared to the normal tissues in           factor in this analysis since most immune cell types were
the CPTAC datasets (Figure 1(e)).                                negatively correlated with tumor purity. As TIMER is the
                                                                 only algorithm that considers tissue specificity, we displayed
                                                                 the results of the correlation between PBK/TOPK and im-
3.2. Analysis of PBK/TOPK mRNA Expression Based on the           mune infiltration cells based on the TIMER algorithm of
Pathological Stage and Tumor Grade. We explored PBK/             TIMER2.0. According to the data analyzed from the
TOPK mRNA expression in various tumors with different             TIMER2.0, we redrew the heatmap (Figure 4(a)) to help
pathological stages in TCGA. We found that in the                readers more intuitively understand the correlation between
downloaded TCGA data, only 23 cancer datasets contained          PBK/TOPK and immune infiltration cells in pan-cancer
tumor staging information, while 12 cancer datasets              datasets (Figure 4(a); for additional details, see Table S2). We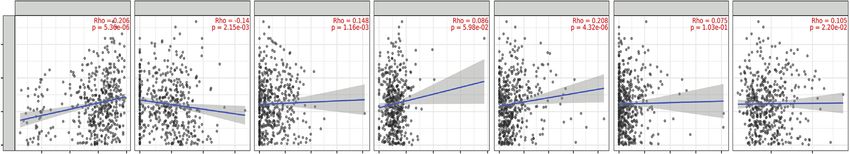
Journal of Oncology 5
Cancer
vs.
Analysis Type Normal
by Cancer
Bladder Cancer 2
Brain and CNS Cancer 6
Breast Cancer 9 1
Cervical Cancer 2
Colorectal Cancer 2
Esophageal Cancer 2
Gastric Cancer 3
Head and Neck Cancer 2
Kidney Cancer
Leukemia 5
Liver Cancer 3
Lung Cancer 5
Lymphoma 4
Melanoma
Myeloma
Other Cancer 3 5
Ovarian Cancer 3
Pancreatic Cancer 1
Prostate Cancer 1
Sarcoma 8
Significant Unique Analyses 55 11
Total Unique Analyses 385
1 5 10 10 5 1
%
Cell color is determined by the best gene
rank percentile for the analyses
within the cell.
NOTE: An analysis may be counted in
more than one cancer type.
(a)
6 *** ***
*** *** ** *** ***
*** ** *
The expression of PBK
5 *** *** ns
Log2 (TPM+1)
4 *** *** ***
3 ns
***
2
1
0
CA
CA
CO L
AD
CA
SC
CH
RC
RP
C
AD
SC
AD
AD
AD
AD
CA
C
O
H
CE
N
LU
KI
CH
KI
TH
BL
BR
LU
ST
ES
KI
LI
PA
PR
RE
H
U
Normal
Tumor
(b)
8 *** *** *** *** *** *** *** *** *** *** *** *** *** *** *** *** *** *** *** *** * *** *** *** *** *** *** *** *** *** ***
The expression of PBK
6
Log2 (TPM+1)
4
2
0
BR A
BL C
CA
CH C
CO L
D D
ES C
CA
BM
KI C
CH
RC
LA P
L
G
LU C
AD
M C
O
PA V
PC D
PR G
AD
SA D
SK C
CM
TG D
TH T
TH A
U M
C
U S
VM
C
O
M
R
C
H
R
S
S
S
CE
AC
C
LB
O
C
LG
P
A
A
A
A
ES
Y
CE
N
LU
U
KI
KI
ST
LI
RE
G
H
Normal
Tumor
(c)
Figure 1: Continued.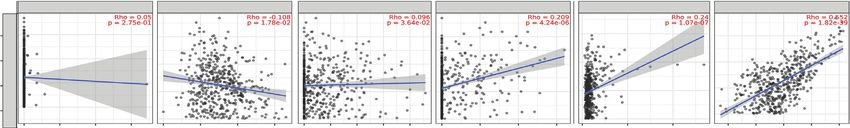
6 Journal of Oncology
Ovarian Cancer Gastric Cancer Prostate Cancer Glioma
Colon Cancer Testis Seminoma Skin Basal Cell Carcinoma Oral Squamous cell carcinoma
Melanoma Cervical Cancer Pancreatic Adenocarcinoma Hepatocellular carcinoma
Breast Cancer Urothelial carcinoma Hodgkin Lymphoma Lung squamous carcinoma
(d)
Protein expression of PBK in Ovarian cancer***
3
2
1
Z–value
0
–1
–2
–3
Normal Primary tumor
(n = 25) (n = 100)
Protein expression of PBK in Colon cancer***
2
1
0
Z–value
–1
–2
–3
–4
Normal Primary tumor
(n = 100) (n = 97)
Protein expression of PBK in UCEC***
3
2
1
0
Z–value
–1
–2
–3
–4
Normal Primary tumor
(n = 31) (n = 100)
Protein expression of PBK Clear cell RCC***
3
2
1
0
Z–value
–1
–2
–3
–4
Normal Primary tumor
(n = 84) (n = 110)
(e)
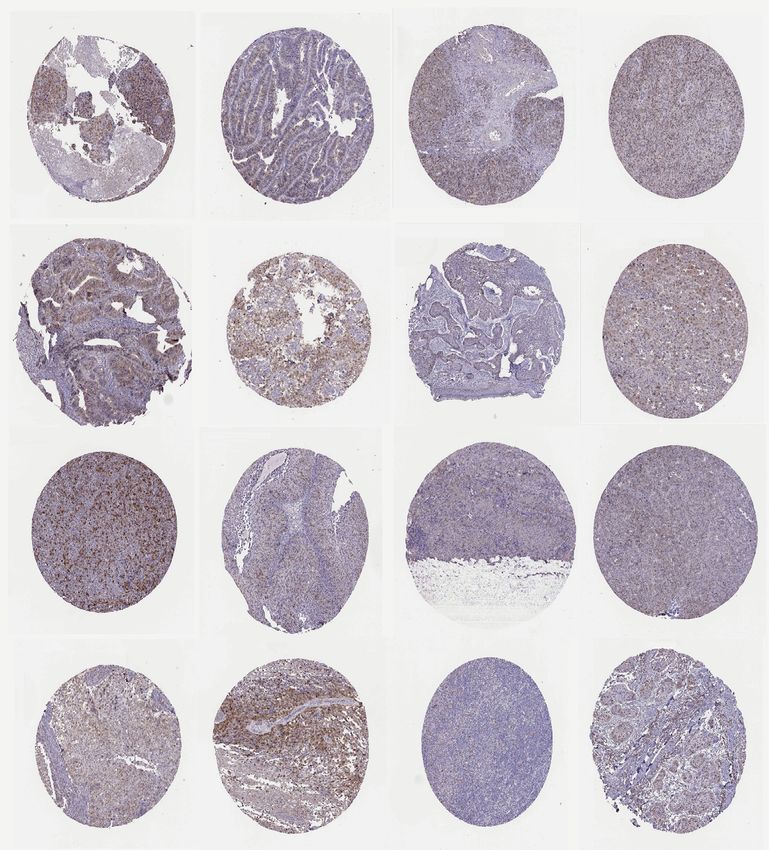
Figure 1: The expression of PBK in different types of cancers. (a) PBK mRNA expression in tumors compared to normal tissues in datasets
from the Oncomine database (N � 74752). (b) Paired comparisons of differences in PBK mRNA expression levels between cancer and
normal tissues in TCGA (N � 670). (c) Nonpaired comparisons of differences in PBK mRNA expression levels between cancer and normal
tissues in TCGA + GTEx databases (N � 15776). (d) Image of PBK immunohistochemical staining in various cancers obtained from the
Human Protein Atlas (N � 16). (e) Expression of the PBK protein in tumor tissues compared to the normal tissues from patients with various
cancers in CPTAC datasets (∗ P < 0.05,∗∗ P < 0.01, and ∗∗∗ P < 0.001) (N � 647).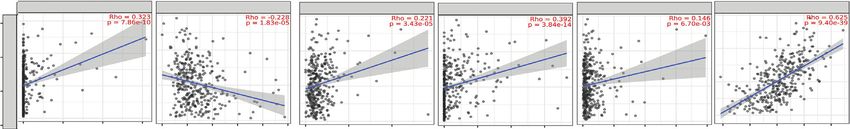
Journal of Oncology 7
ACC 12 BRCA KIRC KICH
14 ns 10 ***
* 10
ns ns **
ns ** ns
12 * 10 ns
ns ns ***
8 *** 8
* ** ns ns
10 ns ns
8 *** ns
The expression of PBK
The expression of PBK
The expression of PBK
The expression of PBK
ns
6
Log2 (TPM+1)
Log2 (TPM+1)
Log2 (TPM+1)
Log2 (TPM+1)
8 6
6
6 4 4
4
4
2 2
2 2
0 0 0
0
Stage I Stage II Stage III Stage IV Stage I Stage II Stage III Stage IV Stage I Stage II Stage III Stage IV Stage I Stage II Stage III Stage IV
F = 4.582, P = 0.005 F = 9.115, P < 0.001 F = 6.2, P = 0.001 F = 13.69, P < 0.001
KIRP LIHC LUAD COAD
* 12 ns 12 ns
ns 10 ns ns
* ***
8 ns ns ***
* ns 10 10
*** * ***
8 *** ** *
*** ns ns ns
The expression of PBK
ns
The expression of PBK
The expression of PBK
The expression of PBK
6 8 8
Log2 (TPM+1)
Log2 (TPM+1)
Log2 (TPM+1)
Log2 (TPM+1)
6
6 6
4
4
4 4
2
2
2 2
0 0
0 0
Stage I Stage II Stage III Stage IV Stage I Stage II Stage III Stage IV Stage I Stage II Stage III Stage IV Stage I Stage II Stage III Stage IV
F = 23.18, P < 0.001 F = 9.28, P < 0.001 F = 6.81, P < 0.001 F = 6.2, P = 0.001
(a)
CHOL
BLCA CESC HNSC KIRC
8 *** * ** 9
**
6 *** 6
7
5 7 5
6
The expression of PBK
The expression of PBK
The expression of PBK
The expression of PBK
The expression of PBK
6
Log2 (TPM+1)
4
Log2 (TPM+1)
Log2 (TPM+1)
Log2 (TPM+1)
Log2 (TPM+1)
4
4 5
5 3
3
2
2 4 2 3
1
1
3 0
0 1
Low Grade High Grade G1&G2 G3&G4 G1&G2 G3&G4 G1&G2 G3&G4 G1&G2 G3&G4
Histologic grade Histologic grade Histologic grade Histologic grade Histologic grade
LGG LIHC UCEC UCS
7 PAAD
*** 6 8 *** 6
*** ***
8 *
6
5 5
5 6
6
The expression of PBK
The expression of PBK
The expression of PBK
The expression of PBK
The expression of PBK
4 4
Log2 (FPKM+1)
Log2 (TPM+1)
Log2 (TPM+1)
Log2 (TPM+1)
Log2 (TPM+1)
4
4 3 4 3
3
2 2
2
2 2
1 1 1
0
0 0 0 0
G2 G3 G1&G2 G3&G4 G1&G2 G3&G4 G1&G2 G3 G1&G2 G3
WHO grade Histologic grade Histologic grade Histologic grade Histologic grade
(b)
Figure 2: PBK mRNA expression based on the pathological stage and tumor grade of various cancers in TCGA. (a) PBK mRNA expression
in cancers of different pathological stages (N � 7604). (b) PBK mRNA expression in the low-grade (G1 and G2) and high-grade groups of
various cancers (∗ P < 0.05,∗∗ P < 0.01, and ∗∗∗ P < 0.001) (N � 3372).
observed a significant correlation between PBK/TOPK ex- these results, PBK/TOPK may influence the prognosis of
pression and TILs in most cancers. We focused on the 10 patients with cancer by modulating tumor immune cell
cancers in which PBK/TOPK affects prognosis. Finally, we infiltration.
focused on 3 tumors, KIRC, LGG, and LIHC, in which PBK/
TOPK expression has a similar correlation with TILs. As
shown in Figure 4(b), PBK/TOPK mRNA expression levels 3.5. Correlations of PBK mRNA Expression with the
were significantly correlated with neutrophils (R � 0.26, Infiltrating Immune Cells in KRIC, LGG, and LIHC Based on
P < 0.001), macrophages (R � 0.114, P � 0.015), and DCs TIMER2.0. We analyzed the correlations of PBK/TOPK
(R � 0.19, P < 0.001) in KIRC; CD8+ T cells (R � −0.14, expression with the infiltrating immune cells that exert
P � 0.002), CD4+ T cells (R � 0.148, P � 0.001), neutrophils tumor-killing effect (CD8+, NK cell) and promote tumor
(R � 0.208, P < 0.001), and DCs (R � 0.105, P � 0.022) in immune escape (M2 macrophage, Tregs, CAFs, MDSCs)
LGG; and CD8+ T cells (R � 0.145, P � 0.006), CD4+ T cells based on TIMER2.0 to further explore the potential role of
(R � 0.149, P � 0.006), B cells (R � 0.386, P < 0.001), neu- PBK in cancer immunity. As shown in Figure 5, similar to
trophils (R � 0.172, P � 0.001), macrophages (R � 0.307, the results based on the TIMER algorithm, the relationships
P < 0.001), and DCs (R � 0.477, P < 0.001) in LIHC. Based on between PBK expression level and CD8+ T cell in 3 tumors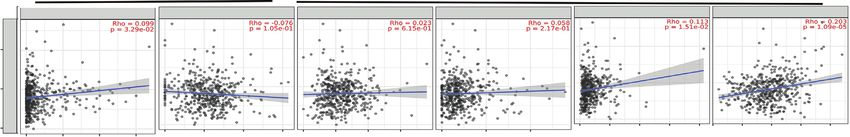
8                                                                                                                                                                                                                                                          Journal of Oncology

                                                                                                                     ACC                                                                            LUAD                                                                          KIRC
     Cancer        P value           HR (95% CI)                                            1.0                                                                           1.0                                                                            1.0

     ACC            0.001                                                      0.0   Log-rank P = 0.002                                                       0.0   Log-rank P = 0.011

                                                                                                  0            50        100             150                                    0       50       100    150     200         250                                0             50         100           150
     CHOL           0.09           2.37 (0.94–5.98)                                                            Time (months)                                                                   Time (months)                                                                 Time (months)

     COAD          0.123           0.74 (0.50–1.09)                                               PBK                                                                           PBK                                                                            PBK

     DLBC          0.242           0.43 (0.11–1.62)                                                        Low                                                                            Low                                                                           Low

                                                                                                           High                                                                           High                                                                          High
     ESCA          0.926           1.02 (0.63–1.67)
                                                                                                                    MESO                                                                            KIRP                                                                         PAAD
     GBM           0.651           1.08 (0.77–1.51)                                         1.0                                                                           1.0                                                                            1.0

                                                                                            0.8                                                                           0.8                                                                            0.8
     HNSC                          0.97 (0.74–1.26)

                                                                     Survival probability

                                                                                                                                                  Survival probability

                                                                                                                                                                                                                                  Survival probability
                   0.796
                                                                                            0.6                                                                           0.6                                                                            0.6
     KICH          0.088           3.59 (0.97–13.24)
                                                                                            0.4                                                                           0.4                                                                            0.4

     KIRC          0.011           1.48 (1.10–1.99)                                         0.2   Overall Survival                                                        0.2    Overall Survival                                                        0.2   Overall Survival
                                                                                                  HR = 2.41 (1.47-3.96)                                                          HR = 2.87 (1.58-5.19)                                                         HR = 1.65 (1.10-2.49)
     KIRP          0.001           2.87 (1.58–5.19)                                         0.0   Log-rank P > 0.001                                                      0.0    Log-rank P = 0.001                                                      0.0   Log-rank P = 0.016

                                                                                                  0         25          50         75                                            0        50         100     150        200                                    0         25          50          75
     LAML           0.97           1.01 (0.66–1.54)                                                              Time (months)                                                                 Time (months)                                                                  Time (months)

     LGG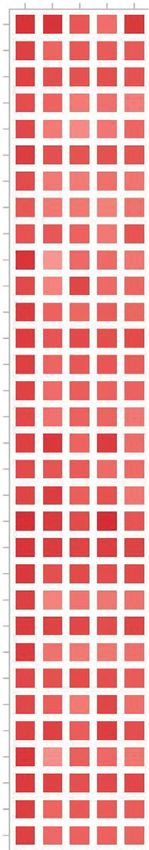
Journal of Oncology 9
*** * *** *** ** * * *** ** *** T cell CD8+
*** * * *** *** *** * ** * *** * ** ** * *** *** *** * T cell CD4+
*** *** *** *** *** ** *** *** B cell
** ** ** ** * *** *** * * *** *** ** *** ** Neutrophil
Timer
** *** *** * ** *** *** * *** Macrophage
4
** * ** * *** *** *** * *** *** Myeloid dendritic cell
2
ACC. (n = 79)
BLCA. (n = 408)
BRCA. (n = 1100)
BRCA-Basal. (n = 191)
BRCA-Her2. (n = 82)
BRCA-LumA. (n = 568)
BRCA-LumB. (n = 219)
CESC. (n = 306)
CHOL. (n = 36)
COAD. (n = 458)
DLBC. (n = 48)
ESCA. (n = 185)
GBM. (n = 153)
HNSC. (n = 522)
HNSC-HPV-. (n = 422)
HNSC-HPV+. (n = 98)
KICH. (n = 66)
KIRC. (n = 533)
KIRP. (n = 290)
LGG. (n = 516)
LIHC. (n = 371)
LUAD. (n = 515)
LUSC. (n = 501)
MESO. (n = 87)
OV. (n = 303)
PAAD. (n = 179)
PCPG. (n = 181)
PRAD. (n = 498)
READ. (n = 166)
SARC. (n = 260)
SKCM. (n = 471)
SKCM-Metastasis. (n = 368)
SKCM-Primary. (n = 103)
STAD. (n = 415)
TGCT. (n = 150)
THCA. (n = 509)
THYM. (n = 120)
UCEC. (n = 545)
UCS. (n = 57)
UVM. (n = 80)
0
-2
-4
Zscore
(a)
Purity T cell CD8+_TIMER T cell CD4+_TIMER B cell_TIMER Neutrophil_TIMER Macrophage_TIMER Myeloid dendritic cell_TIMER
PBK Expression Level (log2 TPM)
4
KIRC
2
0
0.25 0.50 0.75 1.000.0 0.3 0.6 0.9 0.00 0.25 0.50 0.75 0.0 0.2 0.4 0.6 0.0 0.3 0.6 0.9 0.00 0.25 0.50 0.75 1.00 0.0 0.5 1.0 1.5
Purity Infiltration Level Infiltration Level Infiltration Level Infiltration Level Infiltration Level Infiltration Level
(b)
Purity T cell CD8+_TIMER T cell CD4+_TIMER B cell_TIMER Neutrophil_TIMER Macrophage_TIMER Myeloid dendritic cell_TIMER
PBK Expression Level (log2 TPM)
6
4
LGG
2
0
0.25 0.50 0.75 1.000.0 0.2 0.4 0.4 0.00 0.25 0.50 0.75 1.00 0.0 0.2 0.4 0.6 0.8 0.0 0.2 0.4 0.6 0.8 0.0 0.2 0.4 0.6 0.8 0.5 1.0
Purity Infiltration Level Infiltration Level Infiltration Level Infiltration Level Infiltration Level Infiltration Level
(c)
Purity T cell CD8+_TIMER T cell CD4+_TIMER B cell_TIMER Neutrophil_TIMER Macrophage_TIMER Myeloid dendritic cell_TIMER
6
PBK Expression Level (log2 TPM)
4
LIHC
2
0
0.25 0.50 0.75 1.000.0 0.5 1.0 1.5 2.0 0.0 0.5 1.0 1.5 2.00.0 0.5 1.0 1.5 0.0 0.2 0.4 0.6 0.0 0.5 1.0 1.5 0.5 1.0 1.5 2.0
Purity Infiltration Level Infiltration Level Infiltration Level Infiltration Level Infiltration Level
Infiltration Level
(d)
Figure 4: The correlations of PBK mRNA expression with tumor immune cell infiltration in pan-cancer using TIMER2.0. (a) Heatmap of
the correlations between PBK expression and TILs determined using TIMER2.0. The Z-score method was used to standardize data. A
significant correlation was found between PBK expression and TILs in most cancers (∗ P < 0.05,∗∗ P < 0.01, and ∗∗∗ P < 0.001) (N � 12159).
(b) Scatter plots of the correlations between PBK mRNA expression levels and immune infiltration cells (N � 1420).
in DNA mismatch repair in the tumor tissue. Both TMB and negatively correlated in THYM. PBK/TOPK expression was
MSI are currently considered markers for the evaluation of significantly positively correlated with MSI in STAD, UCEC,
the efficacy of immune checkpoint inhibitors therapy in a READ, SARC, MESO, and LIHC (for additional details, see
variety of tumors [25]. Patients with cancer presenting Tables S3 and S4).
TMB-High or MSI may exhibit a better response to im- Immune checkpoints are inhibitory pathways in the
munotherapy than those with TMB-Low or microsatellite immune system that are regulated by ligand and receptor
stability (MSS). As shown in Figures 6(a) and 6(b), PBK/ interactions. They are important for maintaining autoim-
TOPK expression was significantly positively correlated with mune tolerance and regulating the duration and amplitude
TMB in STAD, ACC, KICH, LGG, PRAD, COAD, PAAD, of physiological immune responses to avoid the destruction
CHOL, LUAD, SARC, MESO, BRCA, UCEC, LAML, and damage caused by immune cells to normal tissues.
SKCM, KIRC, HNSC, LUSC, and BLCA and significantly However, they may be exploited to participate in immune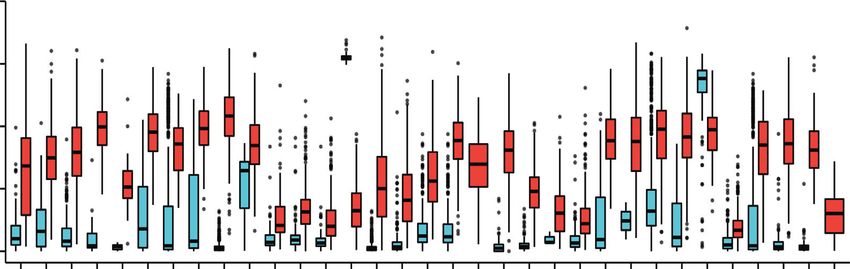
10 Journal of Oncology
(a) Anti–Tumor Cytotoxicity (b) Tumor Evasion
PBK Expression Level (log2 TPM)
T cell CD8+ QUANTISEQ NK cell_QUANTISEQ Macrophage M2_QUANTISEQ T cell regulatory (Tregs)_QUANTISEQ cancer associated fibroblast_MCPCOUNTER MDSC_TIDE
4
LIHC
2
0
0.0 0.1 0.2 0.3 0.00 0.01 0.02 0.03 0.00 0.05 0.10 0.15 0.00 0.02 0.04 0 5000 10000 15000 20000–0.2 –0.1 0.0 0.1 0.2
Infiltration Level Infiltration Level Infiltration Level Infiltration Level Infiltration Level Infiltration Level
PBK Expression Level (log2 TPM)
T cell CD8+ QUANTISEQ NK cell_QUANTISEQ Macrophage M2_QUANTISEQ T cell regulatory (Tregs)_QUANTISEQ Cancer associated fibroblast_MCPCOUNTER MDSC_TIDE
6
4
LGG
2
0
0.00 0.01 0.02 0.03 0.00 0.05 0.10 0.15 0.00 0.05 0.10 0.15 0.20 0.00 0.01 0.02 0.03 0 2000 4000 –0.2 –0.1 0.0 0.1 0.2
Infiltration Level Infiltration Level Infiltration Level Infiltration Level Infiltration Level Infiltration Level
PBK Expression Level (log2 TPM)
T cell CD8+ QUANTISEQ NK cell_QUANTISEQ Macrophage M2_QUANTISEQ T cell regulatory (Tregs)_QUANTISEQ Cancer associated fibroblast _MCPCOUNTER MDSC_TIDE
6
4
LIHC
2
0
0.00 0.04 0.08 0.12 0.00 0.01 0.02 0.03 0.04 0.05 0.00 0.05 0.10 0.00 0.01 0.02 0.03 0 2500 5000 7500 10000–0.2 –0.1 0.0 0.1 0.2
Infiltration Level Infiltration Level Infiltration Level Infiltration Level Infiltration Level Infiltration Level
Figure 5: The relationship of PBK mRNA expression with the infiltrating immune cells in KRIC (N � 533), LGG (N � 516), and LIHC
(N � 371) using TIMER2.0. (a) The correlation of PBK mRNA expression with CD8+ T cell and NK cell which may play a tumor-killing role
in tumors. (b) The correlation of PBK mRNA expression with M2 macrophage, Tregs, CAFs, and MDSCs which play tumor evasion
promotion roles in tumors.
STAD STAD
ACC UCEC
KICH READ
LGG SARC
PRAD MESO
COAD ACC
PAAD CHOL
CHOL UVM
LUAD LIHC
SARC KIRC
KIRP
MESO
Correlation LUSC -log10(p-value)
BRCA 16
0.1 HNSC
UCS 12
0.2 GBM
UCEC 0.3 8
PCPG
LAML 0.4 4
KICH
SKCM 0.5 BLCA
KIRC
COAD Correlation
HNSC -log10(p-value)
ESCA 0.1
LUSC 16
PRAD 0.2
BLCA 12
THYM 0.3
DLBC 8
LAML 0.4
GBM 4
THCA
OV SKCM
PCPG CESC
UVM BRCA
THCA LGG
KIRP LUAD
READ PAAD
TGCT UCS
LIHC OV
CESC TGCT
ESCA DLBC
THYM –0.2 0.0 0.2 0.4
-0.6 -0.3 0.0 0.3 0.6 Correlation(MSI)
Correlation(TMB)
(a) (b)
Figure 6: Continued.Journal of Oncology 11
** ** ** ** * * ** ** ** ** * ** * CD274
* ** * ** * ** ** **** ** * * **
** ** CTLA4 4
* ** ** * ** **** ** ** ** ** HAVCR2 2
** ** ** ** ** **** ** ** * ** ** ** LAG3 0
** * **** * * ** * PDCD1 –2
** ** ** ** ** * * ** ** ** PDCD1LG2 –4
* * ** * ** ** * ** ** ** * TIGIT
** ** * ** ** * ** * ** ** * * SIGLEC15
BLCA
BRCA
ACC
CESC
CHOL
COAD
DLBC
ESCA
GBM
HNSC
KICH
KIRC
KIRP
LGG
LIHC
LUAD
LUSC
MESO
OV
PAAD
PCPG
PRAD
READ
SARC
SKCM
STAD
TGCT
THCA
THYM
UCEC
UCS
UVM
(c)
Responder
Responder
True 41 62 True 76 137
Responder
True 39 69
False 103 82 False 179 118
False 147 116
wilcox.tests p = 0.028 wilcox .tests p=5.3e–10
3 * *** wilcox.tests p = 0.00015
2 ***
2
2
1
1 1
Tide score
Tide score
Tide score
0 0
0
–1 –1
–1
–2
–2
–2
G1 G2 G1 G2 G1 G2
KIRC LGG LIHC
PBK high expression PBK high expression PBK high expression
PBK low expression PBK low expression PBK low expression
(d)
Figure 6: The individual correlations of PBK expression with TMB and MSI of each tumor type in TCGA (N � 10363). (a) The lollipop chart
of the correlations of PBK expression with TMB (a) and MSI (b). The cancers marked in red indicate that the P value is less than 0.05.
(c) Heatmap of correlations of PBK mRNA expression with the expression of different immune checkpoint genes in various cancers. (d) The
numbers of immune responses and the distribution of TIDE scores for samples in the PBK high expression and low expression groups of
KIRC (N � 288), LGG (N � 510), and LIHC (N � 371) in the predicted results (∗ P < 0.05,∗∗ P < 0.01, and ∗∗∗ P < 0.001).
escape from cancer. The current immunotherapy drugs used PBK/TOPK expression and the expression of DNA mis-
in the clinic are mainly antibodies against these targets. PBK/ match repair genes and methyltransferase in pan-cancer. As
TOPK expression showed different correlations with dif- shown in Figure 7(a), PBK/TOPK expression was positively
ferent immune checkpoint genes in various cancers (see correlated with the expression of DNA mismatch genes,
Figure 6(c); for additional details, see Table S5). In KIRC, including MLH1, MSH2, MSH6, and PMS2, in the majority
LGG, and LIHC, the expression of PBK/TOPK was posi- of cancers except CHOL and UCS (see Figure 7(a); for
tively correlated with the selected immune checkpoint genes. additional details, see Table S7), suggesting that PBK/TOPK
Furthermore, the potential ICI response was predicted with may promote cancer progression by upregulating DNA
the TIDE algorithm. TIDE uses a set of gene expression mismatch repair-related genes. In addition, DNA methyl-
markers to estimate 2 distinct mechanisms of tumor im- ation may play an important role in tumor progression, and
mune evasion, including dysfunction of tumor infiltration PBK/TOPK expression was positively correlated with
cytotoxic T lymphocytes (CTLs) and exclusion of CTLs by methyltransferase expression, including DNMT1,
immunosuppressive factors. Patients with higher TIDE DNMT3A, and DNMT3B, in most cancers except CHOL
scores have a higher chance of antitumor immune escape, (see Figure 7(b); for additional details, see Table S7). This
thus exhibiting a lower response rate to ICI treatment. result suggested that PBK/TOPK potentially plays an im-
Figure 6(d) shows the numbers of immune responses and portant role in promoting tumorigenesis and progression by
the distribution of TIDE scores of samples in the PBK/TOPK regulating gene methylation.
high expression and low expression groups of patients with
KIRC, LGG, and LIHC in the predicted results. In all the 3
cancers, the PBK/TOPK overexpression group had a lower 3.8. Enrichment Analysis of PBK/TOPK-Related Partners.
immune response rate and higher TIDE score in the pre- The target PBK/TOPK-binding proteins screened using
dicted results (for additional details, see Table S6). STRING and PBK/TOPK expression-correlated genes
screened using GEPIA2 were included in a series of en-
richment analyses to further explore the molecular mech-
3.7. Correlations of PBK/TOPK Expression with DNA anism of the PBK/TOPK gene in tumorigenesis and tumor
Mismatch Repair Genes and Methyltransferase Expression in immunity. We obtained the top 50 PBK/TOPK-binding
Pan-Cancer. We further analyzed the correlation between proteins based on experimental evidence in the STRING12 Journal of Oncology
Spearman-Cor
*** *** *** *** * *** *** *** *** *** * ** *** *** *** * *** ** *** * *** *** *** *** *** *** *** *** ** *** MLH1 0.8
*** *** *** *** *** *** *** *** *** ** *** *** * *** *** *** *** *** *** *** *** *** *** *** *** *** *** *** *** *** *** MSH2 0.6
*** *** *** *** *** * *** *** *** ** *** *** ** *** *** *** *** *** *** *** *** *** *** *** *** *** *** *** *** *** *** MSH6 0.4
* *** *** *** * *** *** *** *** * ** *** *** *** *** ** *** *** *** *** ** *** *** *** *** *** *** PMS2 0.2
BLCA
BRCA
ACC
CESC
CHOL
COAD
DLBC
ESCA
GBM
HNSC
KICH
KIRC
KIRP
LAML
LGG
LIHC
LUAD
LUSC
MESO
OV
PAAD
PCPG
PRAD
READ
SARC
SKCM
STAD
TGCT
THCA
THYM
UCEC
UCS
UVM
0
–0.2
(a)
Spearman-Cor
*** *** *** *** *** *** *** *** *** ** *** *** *** *** *** *** *** *** *** *** *** *** ** *** *** *** *** *** *** *** *** DNMT1 1
*** * *** *** *** *** *** *** * * *** *** *** *** *** *** *** *** *** *** *** ** *** DNMT3A
0.5
*** ** *** *** * *** *** * *** *** *** *** *** *** *** *** ** *** *** ** *** *** *** ** *** *** *** DNMT3B
0
BLCA
BRCA
ACC
CESC
CHOL
COAD
DLBC
ESCA
GBM
HNSC
KICH
KIRC
KIRP
LAML
LGG
LIHC
LUAD
LUSC
MESO
OV
PAAD
PCPG
PRAD
READ
SARC
SKCM
STAD
TGCT
THCA
THYM
UCEC
UCS
UVM
–0.5
(b)
Figure 7: The correlations of PBK expression with the DNA mismatch repair gene (a) and methyltransferase (b) expression in pan-cancer
data from TCGA (N � 10363). (a) The correlation of PBK expression with the expression of DNA mismatch repair genes in pan-cancer.
(b) The correlation of PBK expression with methyltransferase expression in pan-cancer. Dark and light red colors represent different
correlation coefficients (∗ P < 0.05,∗∗ P < 0.01, and ∗∗∗ P < 0.001).
database and the top 100 PBK/TOPK-correlated genes in the and S12). In KRIC, the PBK/TOPK-related differentially
pan-cancer dataset of GEPIA2. The correlations of PBK/ genes were enriched not only in cell cycle-related pathways
TOPK with the top 5 correlated genes are shown in but also in metabolism-related pathways such as “Alco-
Figure 8(b), including ESCO2 (R � 0.74, P < 0.001), KIF4A holism,” “Collecting Duct Acid secretion,” “Bicarbonate
(R � 0.7, P < 0.001), RACGAP1 (R � 0.69, P < 0.001), Transmembrane Transporter Activity,” and other processes
NUSAP1 (R � 0.68, P < 0.001), and MAD2L1 (R � 0.68, such as “Serine-Type Endopeptidase Activity” which may be
P < 0.001). As shown in the heatmap (see Figure 8(c); for associated with the complement system (see in Figure 8(f );
additional details, see Table S9), PBK/TOPK also showed a for detailed data, see Table S11).
positive correlation with these 5 genes in the majority of
detailed cancer types. Then, we intersected 50 PBK/TOPK- 4. Discussion
associated proteins and 100 PBK/TOPK-correlated genes
using the Venn diagram and obtained 2 coincident genes, Although previous studies [1, 26, 27] have reported higher
CDK1 and CCNB1 (see Figure 8(d); for additional details, expression of the PBK/TOPK mRNA and protein in tumor
see Table S10). We further performed GO and KEGG tissues than in adjacent noncancerous tissues from different
pathway enrichment analyses for the above two datasets and tumors, this study was the first pan-cancer analysis of PBK/
found that PBK/TOPK was involved in cell cycle regulation TOPK and enabled us to observe the expression across all
such as “Cell Cycle,” “Oocyte Meiosis,” “Tubulin Binding,” cancers. We only detected lower PBK/TOPK mRNA ex-
“Microtubule Binding,” “Microtubule Motor Activity,” pression in LAML tissues than in normal tissues, which has
“Chromosomal Region,” “Spindle,” “Chromosome, Cen- not been reported in previous studies, although PBK/TOPK
tromeric Region,” “Nuclear Division,” “Mitotic Nuclear may mediate cell proliferation and viability in promyelocyte
Division,” “Chromosome Segregation,” and “Progesterone- cell lines [28]. In addition, PBK/TOPK is reported to be
Mediated Oocyte Maturation”. upregulated and phosphorylated in HTLV-1-transformed
We further performed GO and KEGG pathway en- T-cell lines and ATLL-derived T-cell lines [8]. Based on the
richment analyses of PBK/TOPK-related differentially genes complex classification of leukemia, the expression and role
in KIRC, LGG, and LIHC. Similar to the results of the pan- of PBK in each type of leukemia must be further studied.
cancer analysis, PBK/TOPK-related differentially expressed Images of immunohistochemical staining for PBK in various
genes were enriched in cell cycle regulation. In addition, cancers obtained from the HPA database revealed the low to
PBK/TOPK was involved in immune regulation processes moderate expression of the PBK protein in many tumors. In
such as “Antigen Binding,” “Immunoglobulin Receptor previous studies, PBK was expressed at high levels in both
Binding,” and “Immunoglobulin Complex” in both LGG tumors in which PBK was positively stained in the HPA
and LIHC. Moreover, PBK/TOPK-related differential genes database and in the negatively stained tumors in the HPA
of LIHC were also enriched in immune processes such as database [29, 30], such as CCA, ESCC, and GBM. Notably,
“humoral immune response mediated by circulation” and the expression of the PBK protein in melanoma has not been
“complement Activation classic pathway” in LIHC (see in reported; however, moderate nuclear and cytoplasmic
Figures 8(g) and 8(i), for additional details, see Tables S13 positivity was observed in the melanoma IHC images weJournal of Oncology 13
RACGAP1
6 p–value = 0
MAD2L1
NUSAP1
R = 0.74
log2(ESCO2 TPM)
5
ESCO2
KIF4A
4
3
2 ACC (n = 79)
1 BLCA (n = 408)
0 BRCA (n = 1100)
0 1 2 3 4 5 6 7
log2(PBK TPM) BRCA-Basal (n = 191)
BRCA-Her2 (n = 82)
6 p–value = 0
R = 0.7 BRCA-LumA (n = 568)
log2(KIF 4A TPM)
5
BRCA-LumB (n = 219)
4
CESC (n = 306)
3
CHOL (n = 36)
2
COAD (n = 458)
1
DLBC (n = 48)
0
0 1 2 3 4 5 6 7 ESCA (n = 185)
log2(PBK TPM) GBM (n = 153)
8 HNS1C (n = 522)
p–value = 0
R = 0.69 HNSC-HPV- (n = 422)
log2(RACGAP1 TPM)
6
HNSC-HPV+ (n = 98)
4 KICH (n = 66)
p > 005 KIRC (n = 533)
2 p 005 KIRP (n = 290)
0 LGG (n = 516)
Spearman_Cor
0 1 2 3 4 5 6 7 1 LIHC (n = 371)
log2(PBK TPM) 0 LUAD (n = 515)
-1
8 p–value = 0 LUSC (n = 501)
R = 0.68 MESO (n = 87)
log2(NUSAP1 TPM)
6
OV (n = 303)
4 PAAD (n = 179)
PCPG (n = 181)
2
PRAD (n = 498)
0 READ (n = 166)
0 1 2 3 4 5 6 7 SARC (n = 260)
log2(PBK TPM)
SKCM (n = 471)
8 p–value = 0 SKCM-Metastasis (n = 368)
R = 0.68 SKCM-Primary (n = 103)
log2(MAD2L1 TPM)
6
STAD (n = 415)
4 TGCT (n = 150)
THCA (n = 509)
2
THYM (n = 120)
0 UCEC (n = 545)
0 1 2 3 4 5 6 7 UCS (n = 57)
log2(PBK TPM)
UVM (n = 80)
(a) (b) (c)
KIRC
PBK Cell Cycle
Oocyte Meiosis Alcoholism
Interacted correlated Progesterone-Mediated
Oocyte Maturation p.adjust Cell Cycle
6e–00
Tubulin Binding
4e–00 Collecting Duct Acid
Microtubule Binding Secretion p.adjust
2e–00
Microtubule Motor Serine-Type Endopeptidase
Activity 0.010
48 2 98
Activity
Counts
Chromosomal Region
11 Pre-mRNA 5'-Splice Site
Binding 0.005
28
Spindle
Bicarbonate T ransmembrane
Chromosome, Centromeric 44
Region Transporter Activity Counts
Nuclear Division Chromosomal Region 5
CDK1, CCNB1 Mitotic Nuclear Division
DNA Packaging Complex
19
Chromosome Segregation 33
Nucleosome
0.10 0.15 0.20 0.25 0.30
GeneRatio
Mitotic Nuclear Division
Sister Chromatid
Segregation
Mitotic Sister Chromatid
Segregation
0.01 0.02 0.03 0.04 0.05 0.06 0.07 0.08
GeneRatio
(d) (e) (f )
Figure 8: Continued.14 Journal of Oncology
LGG LIHC
Neuroactive Ligand- Neuroactive Ligand-
Receptor Interaction Receptor Interaction
Cell Cycle Cell Cycle
Drug Metabolism -
Nicotine Addiction p.adjust p.adjust
Cytochrome P450
6e-06 8e-05
Antigen Binding Antigen Binding
6e-05
4e-06
Ligand-Gated Ion Channel lmmunoglobulin Receptor 4e-05
Activity 2e-06 Binding
2e-05
lmmunoglobulin Receptor Transmitter-Gated Ion
Binding Counts Channel Activity Counts
Chromosome, Centromeric 11 19
Condensed Chromosome
Region
39 40
lmmunoglobulin Complex lmmunoglobulin Complex
67 62
Condensed Chromosome, Condensed Chromosome,
Centromeric Region Centromeric Region
Protein Activation
Nuclear Division
Cascade
Humoral Immune Response
Chromosome Segregation Mediated by Circulating
lmmunoglobulin
Complement Activation,
Mitotic Nuclear Division
Classical Pathway
0.04 0.06 0.08 0.10 0.12 0.02 0.04 0.06 0.08 0.10
GeneRatio GeneRatio
(g) (h)
Figure 8: PBK-related pathway enrichment analysis. (a) The available experimentally determined PBK-binding proteins obtained using the
STRING tool. (b) The top 100 PBK-correlated genes were obtained from GEPIA2. Scatter plots of the PBK mRNA expression with the
selected targeting genes, including ESCO2, KIF4A, RACGAP1, NUSAP1, and MAD2L1. (c) Heatmap of PBK expression with the selected 5
genes in the specific cancers (N � 12159). (d) Venn diagram of the intersection analyses of 50 PBK-associated proteins and 100 PBK-
correlated genes. (e) GO and KEGG pathway analyses of the PBK-binding and interacting genes. (f–h) GO and KEGG pathway analyses of
PBK-related differentially genes in KIRC (f ) (N � 288), LGG (g) (N � 510), and LIHC (h) (N � 371).
obtained from the HPA database but requires further Cancer immunity cycle can be divided into three stages:
confirmation in the future. elimination, equilibrium, and escape. Cancer cells can escape
As a mitotic kinase, PBK plays an important role in the the monitoring, recognition, and attack of the immune
process of tumorigenesis and tumor progression. Not sur- system and continue to proliferate by modifying their own
prisingly, PBK expression was positively correlated with a surface antigens, recruiting inhibitory immune cells and
more advanced pathological stage or differentiation grade of molecules, and modifying the tumor microenvironment
tumors, with the exception of COAD. The correlation of PBK/ [33]. In this study, PBK expression was found closely related
TOPK protein expression with the tumor stage in COAD to immune infiltration cells in various cancers, especially in
remains unclear. No correlation was reported in the study by KIRC, LGG, and LIHC. PBK expression was positively
Su [31], while Zlobec et al. reported that diffuse TOPK was correlated not only with immune infiltration cells including
linked to an advanced pT stage only in patients with he- M2 macrophage, Tregs, CAFs, and MDSCs but also with
reditary colorectal cancer but not in patients with sporadic T-cell exhaustion, which are involved in tumor immune
colorectal cancer [32], which should be explored in further escape [24, 34]. Similarly, Wang et al. suggested PBK/MSL1/
studies. Furthermore, we confirmed that PBK was associated CD276 signaling axis, which may play an important role in
with a poor prognosis in many solid tumor patients although immune evasion of nasopharyngeal carcinoma and may be
high expression of PBK seems to be a good prognostic factor targeted for cancer immunotherapy [12]. Huang et al.
for THYM. It is noteworthy that PBK/TOPK expression was identified PBK as one of the 14 hub genes correlated with
significantly negatively correlated with TMB in THYM which immune cell infiltration in LIHC [11]. They found that the
is also in contrast to other cancers. Integrated proteomics expression of these hub genes was significantly positively
result of PBK based on ProteomicsDB, MaxQB, and MOPED correlated with Tregs, TFH cells, and M0 macrophages,
obtained from the GENECARD website (https://www. consistent with our results, but negatively correlated with
genecards.org/cgi-bin/carddisp.pl?gene�PBK) suggests that monocytes, which is different from our results. This dif-
PBK is likely expressed in immune cells. Because the thymus ference may be due to the weight of PBK in the hub genes.
is an immune organ, the role of PBK in THYM may be Moreover, PBK expression was negatively correlated with
different from other cancers and it deserves further explo- NK cells in LGG and LIHC. However, we did not find a
ration. PBK/TOPK expression was positively correlated with consistent result of the correlation between PBK and CD8+
the expression of DNA mismatch genes and methyl- T cell in KIRC and LGG based on the TIMER and
transferase expression, in the majority of cancers except QUANTISEQ algorithm of TIMER2.0. On the one hand, the
CHOL and UCS. This difference may be due to different correlations were too weak to reach statistical differences; on
genetic backgrounds of different cancers. Current studies of the other hand, it also suggests that we should perform
PBK in CHOL and UCS are limited, and further studies are different bioinformatics algorithms to improve the de-
needed. Overall, we propose that PBK represents a potential pendability of analyzed results. This result suggested a very
therapeutic target in cancer therapy. interesting phenomenon in which PBK, a mitotic kinase,Journal of Oncology 15
may promote the proliferation of immune infiltration cells to Conflicts of Interest
potentially enhance immune escape. Moreover, although, in
LIHC, PBK showed a positive correlation with CD8+ T cells, The authors declare that there are no conflicts of interest
it still cannot be excluded that these cells may contain by- regarding the publication of this paper.
stander CD8+ T cells that are not tumor killing [35], which
remains to be verified by further experiments. We observed Authors’ Contributions
significant positive correlations between PBK expression
and the TMB in KIRC and LGG, as well as MSI in LIHC. Tingting Feng and Yan Zhang contributed equally to this
PBK expression was positively correlated with the expression work.
of immune checkpoint genes in all 3 tumors. Given the
complexity of effectors of immune efficacy, the efficacy of Acknowledgments
immune checkpoint inhibitor treatment cannot be effec-
tively predicted by a single biomarker. We used the TIDE This work was supported by the Medical Health Science and
algorithm to evaluate the association of the immune re- Technology Project of Zhejiang Province Grant (Grant no.
sponse with PBK expression in the 3 cancers. TIDE is a 2019RC130, to Tingting Feng), National Natural Science
bioinformatic algorithm to model 2 distinct mechanisms of Foundation of China Grant (Grant no. 82003188, to Lisha
tumor immune escape. PBK overexpression groups pre- Ying), and Hangzhou Municipal Social Development In-
sented a higher TIDE score, suggesting more T-cell dys- dependent Declaration Project (Grant no. 20180533B34, to
function and elimination characteristics in the 3 tumors, Yafeng Wan).
which again suggested the important role of PBK in tumor
immune escape. Supplementary Materials
In addition to the important role of PBK in cell cycle
regulation, we confirmed that PBK was closely related to Table S1: expression comparison of PBK/TOPK expression
immune regulation especially in LIHC and LGG via the in tumor and normal tissues across cancers from TCGA
enrichment analysis. In fact, it has been reported that potent and GTEx. Table S2: the correlation of PBK/TOPK ex-
kinase inhibitors of CDK4/6 with the goal of slowing tumor pression with immune cells in TIMER2.0. Table S3: the
growth have been observed as a secondary unanticipated correlation of PBK/TOPK expression with TMB across
effect: exhibited a change in the TME, and increased sensi- cancers from TCGA. Table S4: the correlation of PBK/
tivity to ICI relative to controls in certain tumors including TOPK expression with MSI across cancers from TCGA.
breast cancer, pancreatic cancer, and melanoma in preclinical Table S5: the correlation of PBK/TOPK expression with the
studies [33]. Moreover, enhanced cell cycle progression sig- expression of immune checkpoints genes across cancers
natures were significantly enriched in immunologically “cold” from TCGA. Table S6: analysis of the correlation between
tumors compared with “hot” tumors [33, 36]. Due to the PBK/TOPK expression and the immune response based on
oncogenic role of PBK to promote the cell cycle in most TIDE in KRIC, LGG, and LIHC. Table S7: the correlations
tumors and its possible role in promoting immune escape, of PBK/TOPK with DNA mismatch genes and methyl-
especially in KIRC, LGG, and LIHC, this study provides broad transferases. Table S8: similar genes of PBK/TOPK from
research space and clinical application prospects for PBK GEPIA2. Table S9: the correlation of PBK/TOPK with top 5
inhibitors combined with immunotherapy. similar genes from GEPIA2. Table S10: the result of Venn.
This study is a bioinformatics and computational biology Table S11: the GO and KEGG enrichment analysis of PBK/
analysis based on multiple databases and TCGA data that TOPK-related differentially genes in KIRC. Table S12: the
provides a new perspective on immune combination therapy GO and KEGG enrichment analysis of PBK/TOPK-related
but requires extensive validation in the future. differentially genes in LGG. Table S13: the GO and KEGG
enrichment analysis of PBK/TOPK-related differentially
genes in LIHC. Table S14: Gene_outcome of PBK in the
5. Conclusion TIMER2.0 database. Figure S1: PBK mRNA expression
This study analysis revealed that PBK plays not only the based on the pathological stage and tumor grade of other
oncogenic role in most solid tumors but also the role in cancers in TCGA. Click the link to download the sup-
promoting immune escape especially in KIRC, LGG, and plements: (https://pan.baidu.com/s/1GFqYHhkAK0Y_34
LIHC. This study provides a potential for PBK inhibitors zLnH049g) (password 1234). (Supplementary Materials)
combined with immunotherapy.
References
Data Availability [1] Z. Han, L. Li, Y. Huang, H. Zhao, and Y. Luo, “PBK/TOPK: a
therapeutic target worthy of attention,” Cells, vol. 10, no. 2,
The generated and analyzed datasets of the current research are
2021.
available in UCSC XENA (https://xenabrowser.net/datapages/), [2] Y. Abe, S. Matsumoto, K. Kito, and N. Ueda, “Cloning and
Oncomine (https://www.oncomine.org/), Human Protein Atlas expression of a novel MAPKK-like protein kinase, lymphokine-
database (https://www.proteinatlas.org/), Timer2.0 database activated killer T-cell-originated protein kinase, specifically
(http://timer.comp-genomics.org/), STRING (https://www. expressed in the testis and activated lymphoid cells,” Journal of
string-db.org), and GEPIA2 (http://gepia2.cancer-pku.cn/). Biological Chemistry, vol. 275, no. 28, pp. 21525–21531, 2000.You can also read