The Influence of Fungicide Treatments on Mycobiota of Grapes and Its Evolution During Fermentation Evaluated by Metagenomic and Culture-Dependent ...
←
→
Page content transcription
If your browser does not render page correctly, please read the page content below
microorganisms
Article
The Influence of Fungicide Treatments on Mycobiota
of Grapes and Its Evolution During Fermentation
Evaluated by Metagenomic and
Culture-Dependent Methods
Alice Agarbati 1 , Laura Canonico 1 , Leonardo Mancabelli 2 , Christian Milani 2 , Marco Ventura 2 ,
Maurizio Ciani 1, * and Francesca Comitini 1, *
 1   Department of Life and Environmental Sciences, Polytechnic University of Marche, Via Brecce Bianche,
     60121 Ancona, Italy; alice.aga@libero.it (A.A.); l.canonico@univpm.it (L.C.)
 2   Laboratory of Probiogenomics, Department of Genetics, Biology of Microorganisms, Anthropology and
     Evolution, University of Parma, 43100 Parma, Italy; leonardo.mancabelli@studenti.unipr.it (L.M.);
     christian.milani@unipr.it (C.M.); marco.ventura@unipr.it (M.V.)
 *   Correspondence: m.ciani@univpm.it (M.C.); f.comitini@univpm.it (F.C.);
     Tel.: +39-071-220-4987 (M.C.); +39-071-220-4150 (F.C.)

 Received: 1 April 2019; Accepted: 24 April 2019; Published: 26 April 2019

 Abstract: The present study evaluated the impact of organic and conventional fungicide treatments
 compared with untreated samples (no fungicides were used) on the grape berry yeast community
 of the Montepulciano variety. The yeast dynamics during the spontaneous fermentation using
 culture-dependent and -independent methods was also evaluated. Results showed a reduction of
 yeast biodiversity by conventional treatments determining a negative influence on fermenting yeasts
 in favor of oxidative yeasts such as Aerobasidium pullulans. Starmerella bacillaris was significantly more
 present in organic samples (detected by next generation sequencing (NGS)), while Hanseniaspopa
 uvarum was significantly less present in untreated samples (detected by the culture-dependent method).
 The fermenting yeasts, developed during the spontaneous fermentation, were differently present
 depending on the fungicide treatments used. Culture-dependent and -independent methods exhibited
 the same most abundant yeast species during the spontaneous fermentation but a different relative
 abundance. Differently, the NGS method was able to detect a greater biodiversity (lower abundant
 species) in comparison with the culture-dependent method. In this regard, the methodologies used
 gave a different picture of yeast dynamics during the fermentation process. The results indicated that
 the fungal treatments can influence the yeast community of grapes leading must fermentation and
 the final composition of wine.

 Keywords: mycobiota of grapes; organic treatment; conventional treatment; Next Generation
 Sequencing; culture-dependent method

1. Introduction
     The fruit surface, and specifically grape berries, is a complex and specific ecologic niche colonized
by different microorganisms such as filamentous fungi, yeasts and bacteria with different physiological
characteristics [1–3]. Several environmental factors such as geographical region, climatic condition
(temperature, humidity, UV radiation, etc.), availability of nutrients and farming treatments could
influence the composition of microbiota [4–9]. The possible interactions among the factors could
also affect biodiversity and stability of microbiota, grapevine health and as final consequence,
the quality of wines [1,10]. Furthermore, bees and wasps can play an important role on the

Microorganisms 2019, 7, 114; doi:10.3390/microorganisms7050114               www.mdpi.com/journal/microorganisms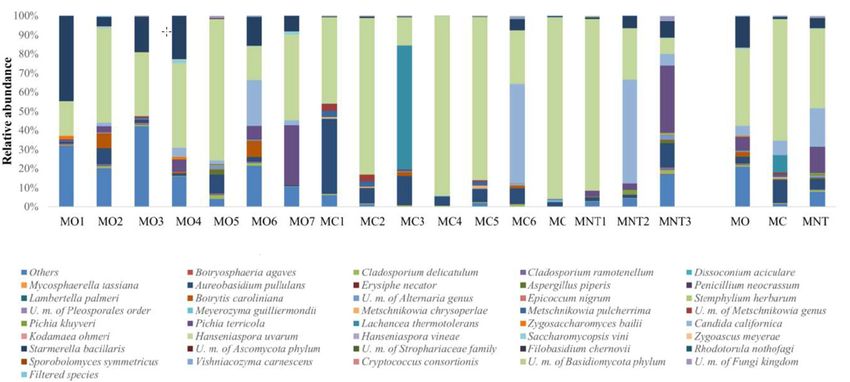
Microorganisms 2019, 7, 114                                                                           2 of 15

occurrence of microorganisms, influencing the transfer from one side to the other, including
grape surfaces [11,12]. The fungi species often found on grapes are saprophytic molds such as
Cladosporium spp., Penicillium spp., Aspergillus spp., that do not have the ability to grow in wine and
have no direct influence on winemaking. Instead, there are other microorganisms, such as yeasts, acetic
acid bacteria and lactic acid bacteria that are part of the so-called wine microbial consortium (WMC)
because they are able to survive or grow in grape juice and wine [1] and could influence its final quality.
Concerning yeasts, they could be grouped in: species easily controllable or technologically irrelevant,
oxidative or weakly fermenting species present at pre-fermentation stages and/or at the beginning
of fermentation (such as Hanseniaspora spp., Candida spp., Pichia spp., Metschnikowia spp.), strong
fermenting yeasts liable for wine fermentation (belonging to Saccharomyces spp.) [1,13], and spoilage
yeasts (such as Dekkera bruxellensis, Zygosaccharomyces bailii) responsible for wine alterations [14,15].
Several studies reported that one of the most important factors that influences microbial community
composition associated with grape berries are the vineyard agronomic practices [5,16–23]. Indeed,
Cordero-Bueso and co-workers [20] showed a greater biodiversity of yeast species when the vineyard
was treated with organic practices instead conventional ones. On the contrary, Comitini and Ciani [5]
found a reduction in the yeast diversity when organic fungicides were applied. More recently,
Escribano-Viana et al. [23] found that the bio-fungicide did not show significant impact on the wine
microbiota whereas the chemical fungicide caused a reduction of microbial community richness
and diversity.
      Regarding S. cerevisiae presence, Ganga and Martinez [18] showed no effect on the enumeration of
this fermenting yeast after fungicide application. Tello et al. [21] described beneficial effect of organic
farming system in terms of diversity and abundance as well as on S. cerevisiae strains’ biodiversity.
Milanović and co-workers [22] found greater S. cerevisiae strain biodiversity in conventional samples
than organic ones.
      To investigate the microbial composition of grape berries and to monitor their evolution during
must fermentation, it is relevant to understand the relationship among the different microorganisms
that cohabit during the winemaking process [7,24]. The use of culture-dependent techniques allow
the detection of the more abundant culturable microorganisms associated with grape berries and
wine. However, there are many viable, but non-culturable wine microorganisms, that could not be
analyzed using conventional techniques. Therefore, these techniques lead to incomplete knowledge
about the composition and dynamics of the microbial community involved in winemaking [24–26].
Recent advances in sequencing technologies based on culture-independent techniques allow to capture
a large proportion of microbes using high-throughput next generation sequencing obtaining a more
complete microbial ecology picture, even if the methodology and the interpretation of data should be
set up [2,27–29].
      In this study, we investigated the yeast community of the grape berry surface of the Montepulciano
variety, subjected to different fungicide treatments using both culture-dependent and -independent
approaches. The yeasts’ dynamic composition during the spontaneous fermentation carried out in
sterile conditions was also evaluated.

2. Materials and Methods

2.1. Vineyard Treatments and Grape Sampling
      The grapes used in this study were obtained from the Montepulciano vine, an autochthonous
vineyard of the center of Italy. In particular, these vines are situated in Sirolo locality (43◦ 310 2000 N,
13◦ 360 5300 E; 97 m altitude), in the Marche region and during the sampling time (October 2016) the
main climatic conditions were 14.9 ◦ C for air temperature, 82% humidity and there were 15 rainy days.
The vineyard included three blocks of rows and each block has employed different agronomic practices
like as organic, conventional and with no treatment. The distance between the blocks was about 1 km
to exclude cross-contaminations between the treatments.
Microorganisms 2019, 7, 114                                                                      3 of 15

     The organic treatment was performed in 15 consecutive applications from April 20 to August 17
and included a Bordeaux mixture (20 g L−1 of copper (II) sulfate + 13 g L−1 of calcium hydroxide with
pH 6.6) and sulfur (Microthiol disperss, UPL EUROPE Ltd., Warrington WA3 6YN, Great Britain).
     The conventional treatment was performed in nine consecutive applications from March 10
to July 17 and included chemical compounds such as spiroxamina (Prospher300 CS, Bayer Crop
Science, Monheim am Rein, Germany), copper-oxychloride (Coprantol, Sygenta Italia Spa,
Casalmorano, Cremona, Italy), sulfur (Tiovit jet, Sygenta Italia Spa, Casalmorano, Cremona, Italy),
fosetyl-Al+copper sulfate (R6 Erresei Bordeaux WG, Bayer Crop Science, Monheim am Rein, Germany),
Metalaxyl-M14+ copper-oxychloride (RidomilGold, Sygenta Italia Spa, Casalmorano, Cremona, Italy),
quinoxyfen + myclobutanil + coformulants (Arius System Plus, Dow AgroSciences, Indianapolis,
Indiana, USA), copper sulfate and sulfur.
     The grape samplings were collected in sterile plastic bags of about 1 kg of undamaged ripe grape
bunches for each sample and were immediately transported to the laboratory on ice for processing.
In particular, seven organic (MO), seven conventional (MC) and three not treated (MNT) samples
were collected.

2.2. Grape Juice Spontaneous Fermentations
     The grapes, as soon as they arrived in the laboratory, were crushed and shaken at 120 rpm for
30 min on a MAXQ 4450 shaker (Thermo Fisher Scientific, Waltham, Massachusetts, USA) under sterile
conditions. Part of each grape juice was used for yeast counts and total microbial DNA extraction while
the remaining fresh must (skin of grape included) was used for the set up of spontaneous fermentation.
The spontaneous fermentations were carried out in 250 mL sterile Erlenmeyer flasks closed with
Pasteur bungs to allow CO2 to escape and placed at 25 ◦ C under static conditions. Monitoring of the
microbial population composition at the beginning and their evolution at the 7th and 15th day from
the start to the fermentation was done through viable counts and high-throughput next generation
sequencing (NGS).

2.3. Viable Counts, Yeast Isolations and Analytical Procedures
      The total yeast enumeration was carried out by taking 1 mL of fresh musts and samples at
the 7th and 15th day of fermentation, serial decimal dilutions in sterile water were prepared and
spread on Wallerstein (WL) nutrient agar (Merck KGaA, Germany) supplemented with 0.02% biphenyl
(Sigma-Aldrich, Saint Louis, Missouri, USA) and 0.005% chloramphenicol (Thermo Fisher GmbH,
Germany) to prevent mold and bacteria growth respectively. The plates were incubated at 25 ◦ C
for five days and those that contained between 30 and 300 colonies were analyzed for cell counts,
macro- and micro-morphological characteristics and used for yeast isolation. The yeast isolation
was carried out on YPD agar (1% Yeast Extract, 2% Peptone, 2% d-glucose, and 2% Agar) collecting
approximately 10% of the colonies per plate [22,30]. These yeasts were maintained in 40% (v/v) glycerol
at −80 ◦ C. To determine the sugar concentrations, a specific enzyme kit (Megazyme International
Ireland, Wicklow, Ireland) was used. Ethanol content and volatile acidity were measured using the
current analytical methods according to the Official European Union Methods [31].

2.4. Yeasts Identification
     The 700 isolated strains were grouped based on the same macro- and micro-morphological
features and representative isolates were used for genomic DNA analysis according to the method
described by Stringini et al. [30]. The internal transcribed spacer ITS1-5.8S rRNA-ITS2 region
was amplified by PCR using the primer set ITS1 (5’-TCCGTAGGTGAACCTCGCG-3’) and ITS4
(5’-TCCTCCGCTTTATTGATATGC-3’) [32] as described by Esteve-Zarzoso and co-workers [33].
Horizontal electrophoresis (Bio-Rad, Hercules, USA) was used to analyze the PCR products using 1.5%
(w/v) agarose gel with ethidium bromide, in 0.5x TBE buffer. The representative yeast species were
identified by sequencing and through use of the BLAST program [34], the sequences provided were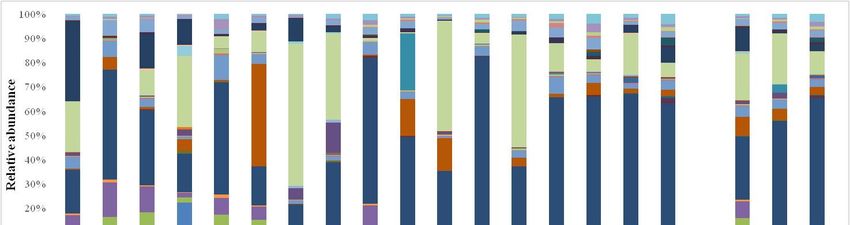
Microorganisms 2019, 7, 114                                                                       4 of 15

compared with those already present in the data library GenBank (http://www.ncbi.nlm.nih.gov/BLAST).
The inclusion of obtained sequences into the NCBI GenBank data library was completed under the
accession numbers from MK352017–MK352031 and from MK352058–MK352096.

2.5. Total DNA Extraction and Next Generation Sequencing (NGS) Analysis
     To obtain the total microbial DNA that represent well mixed microbial consortia of samples,
1 mL of each fresh juice and each sample at the 7th and 15th day of spontaneous fermentation was
taken. The total DNA extraction was carried out following the protocol of the Soil Kit DNA Extraction
(Qiagen, Hilde, Germany) and the extracts were stored at –20 ◦ C until further analysis.
     The presence of fungal genome was confirmed using primer set NL1 (50 -GCATATCAATAAG
CGGAGGAAAAG-30 ) and NL4 (50 -GGTCCGTGTTTCAAGACGG-30 ) to amplify the region 26S rDNA
D1/D2 as described by Kurtzman and Robnett [35].
     Next Generation Sequencing (NGS) analyses were performed using primers BITS (50 -GAG
ATCCRTTGYTRAAAGTT-30 ) and B58S3 (50 -ACCTGCGGARGGATCA-30 ) [36] to amplify the fungal
internal transcribed spacer (ITS) region. Library preparation of the samples was carried out using
Illumina paired-end kit, cluster generation, and 350-bp paired-end sequencing on an Illumina Miseq
(Illumina Inc., San Diego, CA, USA).

2.6. NGS Data Processing
      The fastq files obtained from sequencing were processed using a custom script based on the
QIIME software suite [37]. In detail, paired-end reads pairs were assembled to reconstruct the
complete BITS/B58S3 amplicons. Forward reads of unmerged pairs were also included in the analysis.
Quality control were retained sequences with a mean sequence quality score >15, while sequences
with mismatched primers were omitted. In order to calculate fungal taxonomy, ITS rRNA Operational
Taxonomic Units (OTUs) were defined at ≥99% sequence homology using uclust [38]. and OTUs with
less than 10 sequences were filtered. All reads were classified to the lowest possible taxonomic rank
using QIIME [37] and a reference dataset from the UNITE database [39].
      The microbial richness of the samples (alpha-diversity) were calculated with Shannon indexes
calculated for 10 sub-samplings of sequenced read pools and represented by rarefaction curves.
The alpha-diversity could also be represented by a box-and-whisker plot. In detail, the bottom and top
of the box were the first and the third quartiles, and the band inside the box was the median. Moreover,
the ends of the whiskers represented the minimum and maximum of all the data of the sample.
Similarities between samples (beta-diversity) were calculated by weighted uniFrac [40]. The range
of similarities was calculated between the values 0 and 1. PCoA (principal component analysis)
presentations of beta-diversity were performed using QIIME [37]. In the PCoA, each dot represented a
sample that is distributed in tridimensional space according to its own bacterial composition.

2.7. Statistical Analysis
     Comparisons between different groups were tested by ANOVA (Analysis of Variance) calculated
through SPSS software (www.ibm.com/software/it/analytics/spss/). Moreover, we also calculated the
post hoc analysis LSD (least significant difference) for multiple comparisons.

3. Results

3.1. Effects of Fungicide Treatments on Fungal Community at Harvest Time

3.1.1. Culture-Independent Analysis (NGS)
     The fungal population associated with the grape surface of the Montepulciano variety was
evaluated by the culture-independent method using Next Generation Sequencing (NGS). Samples MNT,
MO and MC were compared.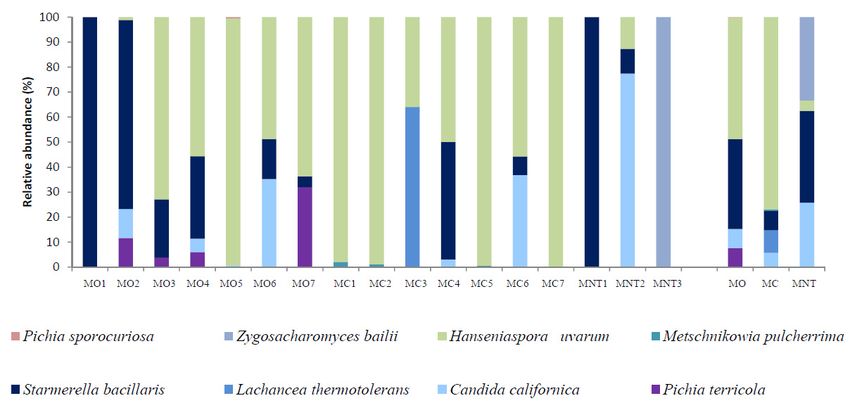
Microorganisms 2019, 7, 114
Microorganisms
Microorganisms 2019,
Microorganisms 7, 114
2019, 114 7, 114
7,2019, 5 of 16 16 5 of 15
5 of
7th day of spontaneous fermentatio
7 7day
th th of of
day spontaneous
spontaneous fermentation,
fermentation, thethe
biodiversity
biodiversity of of
MOMO andand MNT
MNT grapes
grapes was similar,
was similar,and it was
higher
and than conventional grapes (
it was
higher
higherthan
thanRarefaction
conventional
conventional curves
grapes of fungal
grapes (Figure population
(Figure 1b). AtAt
1b). characterizing
1515
th day
th dayof of MO, MC and
fermentation,
fermentation, thetheMNT
MOMO samples
samples
samples were
showed
the calculated
highest
showed biodiversity followed b
thethe through
highest
highest the Shannon
biodiversity
biodiversity index,
followed
followed byas showed
MNT
by MNT and inMC
and Figure
MC 1. In (Figure
samples
samples all(Figure
three1c).
sample times (harvest,
Significant
1c). Significant differences 7th were
found
differences and 15thatday
only
were the 15th day (betwe
found
found of
onlyspontaneous
only at at
thethe th fermentation)
1515dayth day(between
(between the
MO plateauing
MO and
and MC)of
MC) the three
forfor
thethe curves
higher
higher related to
homogeneity
homogeneity the diversity
of of
thethe indices
samples
comparison
samples indicated
in in with the others.
comparisonthat the
comparison with main
with part
Microorganisms
thethe of7,the
2019,
others.
others. 114 fungal diversity was detected. In detail, the MNT grapes displayed the
5 of 16 highest
biodiversity at the harvest time followed by MO and MC ones (Figure 1a). At 7th day of spontaneous
7th day of spontaneous
fermentation, the biodiversity fermentation,
of MO andthe biodiversity
MNT grapes of was
MO and MNTand
similar, grapes washigher
it was similar,than
and conventional
it was
higher than conventional grapes (Figure 1b). At 15th day of fermentation, the MO samples showed
grapes (Figure 1b). At 15th day of fermentation, the MO samples showed the highest biodiversity
the highest biodiversity followed by MNT and MC samples (Figure 1c). Significant differences were
followed
foundbyonly MNT and15MC
at the samples
th day (Figure
(between MO and1c). MC)
Significant
for the differences were found
higher homogeneity of theonly at thein15th day
samples
(between MO and MC)
comparison with the others. for the higher homogeneity of the samples in comparison with the others.
(a)(a)
(a)
(b)(b)
(b)
(c)(c) (c)
Figure 1. Rarefaction curves (on t
Figure 1.Figure
Figure Figure
Rarefaction 1. curves
Rarefaction
1. Rarefaction
1. Rarefaction curves(on curves
thethe
curves
(on (onand
left)
(on the
the
left) andleft)
left) and
andbox-and-whisker
box-and-whisker plots
box-and-whisker
box-and-whisker plotsplots
(on (on
the
plots
(on the
right)
the (on right) generated
generated
the
right) right)
generated forformean
generated
for mean
mean values
for meanof fungal internal transc
values ofvalues values
fungal of fungal
of internal
fungal internal
transcribed
internal transcribed
spacer
transcribed spacer
(ITS)
spacer (ITS)
sequences
(ITS) sequences obtained
obtained
sequences from
obtained from
MO
from MO
MO ( ((( ), ),),MC
MC( (( )) and MNT ( ) gra
values of fungal internal transcribed spacer (ITS) sequences obtained from MO ),MC
MC (
) and MNT ( ) grapes. The results were obtained using the Shannon index. (a), (b), (c)
and
) and
) andMNT
MNTMNT (( ) grapes.
) grapes. The
The results
results
The results were
were
were obtained
obtained
obtained using the
using the ShannonShannon
Shannon index.
index.
index. (a–c)
(a),(a),
(b),(b), represent rarefaction curves and
represent
(c)(c)
represent rarefaction curves and box-and-whisker plots referred to harvest time and at the 7th and 15th
represent rarefaction
represent rarefaction
rarefactioncurves
curves and
curvesand box-and-whisker
andbox-and-whisker
box-and-whisker plots
plots referred
plotsreferred to
toharvest
referred harvest
to harvesttime
time and
and
time at the
and at 77th
the and
th and
7 th and 15th
15 15 thday
th day ofofspontaneous fermentation
day of spontaneous fermentation, respectively.
day of of
day spontaneous
spontaneous
spontaneous fermentation,
fermentation,
fermentation, respectively.
respectively.
respectively.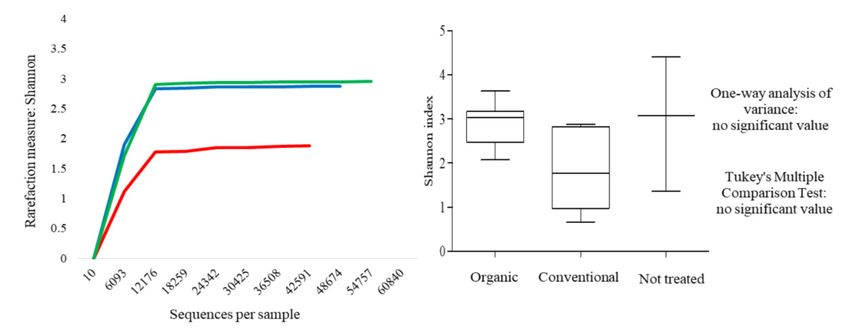
Microorganisms 2019, 7, 114 6 of 15
Microorganisms 2019, 7, 114 6 of 16
At harvest time the high-throughput sequencing technology allowed to clearly identify 164 species
(yeastsAt andharvest time thefungi).
filamentous high-throughput
Other fungi sequencing technology
were classified onlyallowed to clearly
at higher identify 164
taxonomical level.
species (yeasts
Unknown fungi andwerefilamentous fungi).
also detected Other2).
(Figure fungi werevalues
Mean classified only at higher
of relative taxonomical
abundance revealed level.
that
theUnknown
population fungi
waswere alsorepresented
mainly detected (Figure
by the2).oxidative
Mean values of relative
yeast-like abundance
Aerobasidium revealed
pullulans that theby
followed
thepopulation
fermentative wasHanseniaspora
mainly represented
uvarumby the oxidative
species. yeast-like
The relative Aerobasidium
abundance of the pullulans
two species followed by thein
was similar
fermentative Hanseniaspora uvarum species. The relative abundance of the two
the MO samples (26.09% of A. pullulans, 19.10% of H. uvarum), while in MC samples A. pullulans (45.12%)species was similar in
the MO samples (26.09% of A. pullulans, 19.10% of H. uvarum), while in MC
predominated over H. uvarum (20.81%). A. pullulans represented more than 50% of the total fungal samples A. pullulans (45.12
%) predominated
population of MNTover H. uvarum
grapes, while (20.81%).
only 9.30% A. pullulans represented
of H. uvarum more than
was detected. 50% of the total
Conventional fungal
treatments
population of MNT grapes, while only 9.30% of H. uvarum was detected. Conventional
affected the presence of A. pullulans since significant enhancement of the relative abundance was found treatments
in affected
MC samples the presence
while H. of A. pullulans
uvarum did notsince
seemsignificant
influencedenhancement
by treatmentsof(Tablethe relative abundance
S1). Starmerella was
bacillaris
found in MC samples while H. uvarum did not seem influenced by treatments (Table S1). Starmerella
fermentative yeast was positively influenced by organic treatments (9.96%, 0.53% and 2.99% in MO,
bacillaris fermentative yeast was positively influenced by organic treatments (9.96%, 0.53% and 2.99%
MC and MNT respectively), while Lachancea thermotolerans was found only in MC samples (3.35%).
in MO, MC and MNT respectively), while Lachancea thermotolerans was found only in MC samples
Zygoascus meyerae was found in MO and MNT samples (0.23% and 0.17% respectively) and it was
(3.35%). Zygoascus meyerae was found in MO and MNT samples (0.23% and 0.17% respectively) and
not detected in MC samples. Rhodotorula nothofagi and Metschnikowia pulcherrima were found in
it was not detected in MC samples. Rhodotorula nothofagi and Metschnikowia pulcherrima were found
MNT samples (1.64% and 0.87%, respectively), while Pichia terricola was detected in MO (1.34%) and
in MNT samples (1.64% and 0.87 %, respectively), while Pichia terricola was detected in MO (1.34%)
MC (1.89%) samples. Filamentous fungi such as Botrytis caroliniana, Alternaria genus, Cladosporium
and MC (1.89%) samples. Filamentous fungi such as Botrytis caroliniana, Alternaria genus,
ramotenellum
Cladosporium and Cladosporium
ramotenellum anddelicatulum
Cladosporium showed a relevant
delicatulum showedpresence in allpresence
a relevant samples.inAnalyzing
all samples. the
mean values of relative abundance, these species exhibited the same trend:
Analyzing the mean values of relative abundance, these species exhibited the same trend: they they appeared more
abundant
appearedinmore MO abundant
samples, in followed by MC
MO samples, and MNT
followed by MCones (B.
and MNTcaroliniana: 7.87%, 4.89%
ones (B. caroliniana: and4.89%
7.87%, 3.10%;
Alternaria genus: 4.41%, 3.38% and 2.86%; C. ramotenellum: 6.93%, 2.46% and
and 3.10%; Alternaria genus: 4.41%, 3.38% and 2.86%; C. ramotenellum: 6.93%, 2.46% and 1.55%; C. 1.55%; C. delicatulum:
9.43%, 6.78% and
delicatulum: 5.78%
9.43%, in MO,
6.78% andMC and MNT
5.78% in MO, samples
MC and respectively).
MNT samples C. ramotenellum
Only respectively). showed
Only C.
a significant
ramotenellum increase
showedinarelative abundance
significant increase in in MO samples
relative (Table in
abundance S1).MO The relative(Table
samples abundances
S1). Theof
filamentous fungi found
relative abundances suggest, andfungi
of filamentous confirm,
found healthy harvested
suggest, grapes
and confirm, and their
healthy low propensity
harvested grapes andfor
postharvest spoilage grapes.
their low propensity for postharvest spoilage grapes.
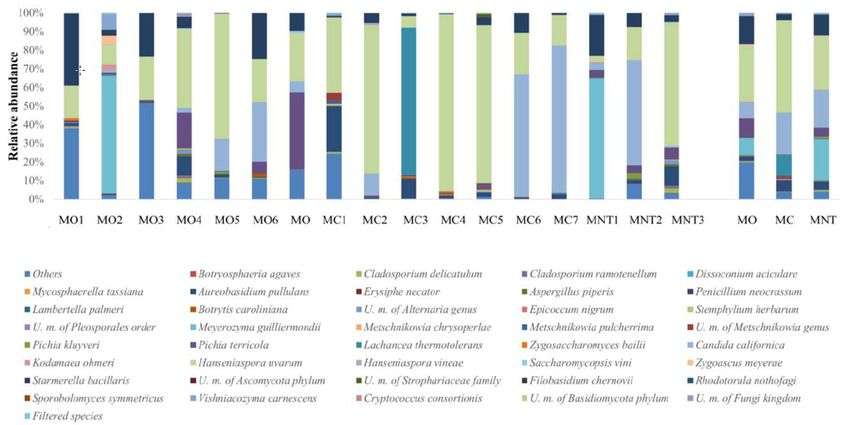
Figure
Figure2. 2.Relative
Relativeabundance
abundanceof ofgrape
grape fungal
fungal community detected by
community detected by next
nextgeneration
generationsequencing
sequencing
(NGS) at harvest time in organic (MO), conventional (MC) and not treated (MNT)
(NGS) at harvest time in organic (MO), conventional (MC) and not treated (MNT) samples. samples. The number
The
associated to the samples
number associated to therepresent the replicates
samples represent for each for
the replicates treatment. In the microorganisms
each treatment. legend,
In the microorganisms
U.m. abbreviation
legend, means undefined
U.m. abbreviation microorganism.
means undefined microorganism. Only>0.5%
Only the taxa are>0.5%
the taxa shownare and and≤0.5%
the taxa
shown the
aretaxa
grouped
≤0.5%under the heading
are grouped underFiltered species
the heading of the species
Filtered legend.ofTothe
thelegend.
right ofTo
thethe
graph,
right mean
of thevalues
graph,of
each treatment
mean values of areeach
represented
treatment(MO, MC and MNT).
are represented (MO, MC and MNT).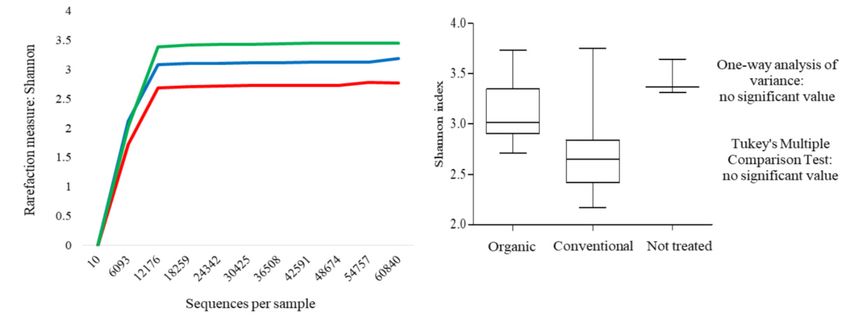
Microorganisms 2019, 7, 114 7 of 16
Microorganisms 2019, 7, 114 7 of 15
3.1.2. Culture-Dependent Analysis
3.1.2. The
Culture-Dependent Analysis
results of the culture-dependent method are shown in Figure 3. The culture-dependent
method allowed to detect only 12 yeast
The results of the culture-dependent method species and another twoinidentified
are shown Figure 3.at The
genus level. As showed
culture-dependent
by NGS analysis, A. pullulans and H. uvarum were confirmed to be the yeasts
method allowed to detect only 12 yeast species and another two identified at genus level. mainly detected also in
As showed
theNGS
by culture-dependent approach.
analysis, A. pullulans and Likewise,
H. uvarumto NGS
were analysis, to
confirmed MCbe samples
the yeastsshowed
mainlyhigher
detectedrelative
also
abundance of A. pullulans than that showed by MB and MNT samples but not
in the culture-dependent approach. Likewise, to NGS analysis, MC samples showed higher relative statistically significant
(Figure 3 and
abundance Table
of A. S2). H.than
pullulans uvarum
that was the more
showed by MB abundant
and MNT species
samples isolated from
but not all samples
statistically without
significant
significant
(Figure 3 anddifferences
Table S2). among
H. uvarumthe was
MO,theMC andabundant
more MNT samples.
speciesAs NGS from
isolated analysis, S. bacillaris
all samples was
without
mainly found in MO samples (20.94%) and L. thermotolerans was found only
significant differences among the MO, MC and MNT samples. As NGS analysis, S. bacillaris was in MC samples (7.84%).
Differently
mainly found to in
NGS,MOP.samples
terricola(20.94%)
was found inL.
and MO, MC and MNT
thermotolerans wassamples.
found onlyZ. meyerae was not detected
in MC samples (7.84%).
in MC samples (0.01% of relative abundance with NGS) while it was found in
Differently to NGS, P. terricola was found in MO, MC and MNT samples. Z. meyerae was not detected in MO and MNT as
showed by NGS analysis. By the culture-dependent method, Rhodotorula genus
MC samples (0.01% of relative abundance with NGS) while it was found in MO and MNT as showed was found only in
MC
by NGSsamples (1.13%)
analysis. By thewhile M. pulcherrima
culture-dependent characterized
method, MNT
Rhodotorula samples
genus showing
was found onlythe same
in MC trend
samples
described by NGS.
(1.13%) while M. pulcherrima characterized MNT samples showing the same trend described by NGS.
Figure 3. Relative abundance of the grape yeast community detected by the culture-dependent method
Figure 3. Relative abundance of the grape yeast community detected by the culture-dependent
at harvest time in organic (MO), conventional (MC) and not treated (MNT) samples. The number
method at harvest time in organic (MO), conventional (MC) and not treated (MNT) samples. The
associated to the samples represent the replicates for each treatment. To the right of the graph, mean
number associated to the samples represent the replicates for each treatment. To the right of the graph,
values of each treatment are represented (MO, MC and MNT).
mean values of each treatment are represented (MO, MC and MNT).
3.2. Effects of Fungicide Treatments on Fungal Community at 7th Day of Spontaneous Fermentation
3.2. Effects of Fungicide Treatments on Fungal Community at 7th Day of Spontaneous Fermentation
3.2.1. Culture-Independent Analysis (NGS)
3.2.1. Culture-Independent Analysis (NGS)
The population dynamic at the 7th day of spontaneous fermentation evaluated by NGS revealed
71 fungal species (Figure
The population 4). Other
dynamic at thefungi were
7th day classified at fermentation
of spontaneous higher taxonomical
evaluatedlevels. At this
by NGS stage
revealed
of
71 fermentation,
fungal species as expected,
(Figure H. uvarum
4). Other represented
fungi were classifiedthe most abundant
at higher taxonomical specie in At
levels. MO,thisMC and
stage of
MNT samples as
fermentation, (40.30%,
expected,63.61% and 41.71%
H. uvarum respectively)
represented while
the most the oxidative
abundant specie yeast-like
in MO, MC A.and
pullulans
MNT
decreased in all samples.
samples (40.30%, 63.61%The same
and trend respectively)
41.71% was observed while
for molds,
the which found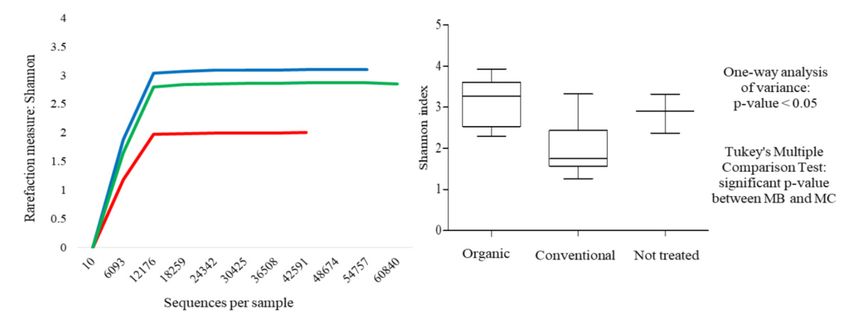
Microorganisms 2019, 7, 114 8 of 16
Microorganisms 2019, 7, 114 8 of 15
Microorganisms 2019, 7, 114 8 of 16
Figure 4. Relative abundance of fungal community detected by NGS at the 7th day of spontaneous
fermentation in organic (MO), conventional (MC) and not treated (MNT) samples. The number
Figure4.4.Relative
Figure Relativeabundance
abundanceofoffungal
fungalcommunity
communitydetected
detectedby byNGS
NGSatatthe
the7th
7thday
dayofofspontaneous
spontaneous
associated to the samples represent the replicates for each treatment. In the microorganism legend,
fermentation in organic (MO), conventional (MC) and not treated (MNT)
fermentation in organic (MO), conventional (MC) and not treated (MNT) samples. The number samples. The number
U.m. abbreviation means undefined microorganism. Only the taxa >0.5% are shown, and the taxa
associatedtotothe
associated the samples
samples represent
represent thethe replicates
replicates for each
for each treatment.
treatment. In theInmicroorganism
the microorganism legend,
legend, U.m.
≤0.5% are grouped under heading Filtered species of the legend. To the right of the graph, mean
U.m. abbreviation
abbreviation means undefined
means undefined microorganism.
microorganism. taxa >0.5%
Only theOnly the taxa
are>0.5%
shown,are andshown, and
the taxa the taxa
≤0.5% are
values of each treatment are represented (MO, MC and MNT).
≤0.5% are
grouped grouped
under under
heading heading
Filtered Filtered
species of thespecies
legend.ofTothe
thelegend.
right ofTo
thethe rightmean
graph, of the graph,
values of mean
each
values of are
treatment each treatment are
represented (MO,represented
MC and MNT).(MO, MC and MNT).
3.2.2. Culture-Dependent Analysis
3.2.2.
3.2.2. Culture-Dependent
The results obtained Analysis
Culture-Dependent Analysis
by culture-dependent method after the 7th day are shown in Figure 5. As
observed
The through
Theresults NGS, H. by
results obtained
obtained uvarum
by was the most abundant
culture-dependent
culture-dependent method after
method species
after the7in7th
the th MO day
day and MC
areare samples
shown
shown in in (48.69%
Figure
Figure 5.
5. As
and
As 76.86%
observed respectively)
through NGS, while
H. its
uvarum presence
was thewas
mostlower in
abundant MNT samples
species
observed through NGS, H. uvarum was the most abundant species in MO and MC samples (48.69% in MO (4.21%)
and MCwhere the
samples species
(48.69%
mainly
and
and76.86%detected
76.86% were S. bacillaris,
respectively)
respectively) while
whileitsitsC. californica
presence
presence wasand
was lowerZygosaccharomyces
lower ininMNT
MNTsamples
samples bailii (undetected
(4.21%)
(4.21%) wherewith
where the NGS)
thespecies
species
(36.64%,
mainly 25.81%
mainlydetected and
detectedwere 33.33%, respectively).
wereS.S.bacillaris,
bacillaris,C. S.
C.californicabacillaris and C.
andZygosaccharomyces
californicaand californica
Zygosaccharomycesbailii were also found
bailii(undetected in
(undetectedwith MO
withNGS)and
NGS)
MC samples
(36.64%,
(36.64%, 25.81%withand
25.81% a relative
and 33.33%, abundance
33.33%,respectively).comparable
respectively). S. to the
S.bacillaris
bacillaris and
andNGS
C. results. The
C.californica
californica were
wereresults
also of NGSin
alsofound
found were
inMOMOalso
and
and
confirmed
MC
MCsamples for
sampleswith L. thermotolerans
withaarelative and
relativeabundance M. pulcherrima
abundancecomparable in
comparabletototheMC samples
theNGS by
NGSresults. the
results.The culture-dependent
Theresults
resultsofofNGS
NGSweremethod.
werealso
also
Differently,
confirmed
confirmedfor using
for the culture-dependent
L.L.thermotolerans
thermotolerans andM.
and methodin
M.pulcherrima
pulcherrima P.MC
in MCterricola
samples
sampleswas byonly
by the detected in MO samples
theculture-dependent
culture-dependent method.
method.
(7.63%).
Differently, method P. terricola
Differently, using the culture-dependent method P. terricola was only detected in MO (7.63%).
using the culture-dependent was only detected in MO samples samples
(7.63%).
Figure 5.
Figure Relativeabundance
5. Relative abundanceofofyeast
yeast species
species detected
detected bybythethe culture-dependent
culture-dependent method
method at the
at the 7th
7th day
day
of of spontaneous
spontaneous fermentation
fermentation in organic
in organic (MO),
(MO), conventional
conventional (MC)
(MC) andnot
and nottreated
treated(MNT)
(MNT)samples.
samples.
Figure 5. Relative abundance of yeast species detected by the culture-dependent method at the 7th day
The number
The number associated
associated to
to the
the samples
samples represent
represent the
the replicates
replicates for
for each
each treatment.
treatment. To To the
the right
right of
of the
the
of spontaneous fermentation in organic (MO), conventional (MC) and not treated (MNT) samples.
graph, mean values of each treatment are represented (MO, MC
graph, mean values of each treatment are represented (MO, MC and MNT). and MNT).
The number associated to the samples represent the replicates for each treatment. To the right of the
graph, mean values of each treatment are represented (MO, MC and MNT).Microorganisms 2019, 7, 114 9 of 16
Microorganisms 2019, 7, 114 9 of 15
3.3. Effects of Fungicide Treatments on Fungal Community at 15th Day of Spontaneous Fermentation
3.3. Effects of Fungicide Treatments on Fungal Community at 15th Day of Spontaneous Fermentation
3.3.1. Culture-Independent Analysis (NGS)
3.3.1.NGS
Culture-Independent
results of the fungal Analysis (NGS) composition at the 15th day of spontaneous fermentation
community
are shown in Figure
NGS results 6. The
of the fungalfungal community
community found was
composition at very similar
the 15th day to
of that found at fermentation
spontaneous the 7th day of
fermentation.
are shown in FigureIndeed,6. atThe
thisfungal
stage community
of fermentationfound 74wasspecies
verywere identified,
similar and H.
to that found at uvarum
the 7th was
day
confirmed to be the most abundant species detected in all samples,
of fermentation. Indeed, at this stage of fermentation 74 species were identified, and H. from 29% to 50% of uvarum
relative
abundance.
was confirmed At to
lower relative
be the abundance,
most abundant S. bacillaris
species detected(significant higherfrom
in all samples, in MO
29%samples;
to 50% ofTable S1)
relative
and C. californica were present in all samples. L. thermotolerans and M. pulcherrima
abundance. At lower relative abundance, S. bacillaris (significant higher in MO samples; Table S1) and confirmed their
presence
C. only
californica in MC
were samples,
present in allP. kluyveri L.
samples. was confirmed to
thermotolerans be M.
and present in MNT
pulcherrima samples and
confirmed theirP.presence
terricola
was found in MO and MNT samples (10.17% and 5.01%, respectively). An
only in MC samples, P. kluyveri was confirmed to be present in MNT samples and P. terricola was foundemerging fermenting
species,
in MO and not MNT
detected before,
samples was Meyerozyma
(10.17% and 5.01%,guillermondii
respectively). thatAn
characterized MO and MNT
emerging fermenting samples
species, not
(8.99% and 21.47%, respectively) but was absent in MC samples. High-fermentative
detected before, was Meyerozyma guillermondii that characterized MO and MNT samples (8.99% and yeasts were
poorly found
21.47%, (≤0.5%) but
respectively) at this
wasstage
absentof in
fermentation.
MC samples.InHigh-fermentative
particular, Torulaspora delbrueckii
yeasts in MO
were poorly and
found
MNT samples and Z. bailii in MO and MC samples. Z. meyerae remained detectable
(≤0.5%) at this stage of fermentation. In particular, Torulaspora delbrueckii in MO and MNT samples and only in MO
samples
Z. bailii in(0.72%).
MO and MC samples. Z. meyerae remained detectable only in MO samples (0.72%).
Figure 6. Relative
Figure 6. Relative abundance
abundance of of fungal
fungal community
community detected
detected by
byNGS
NGSat atthe
the15th
15th day
day of
of spontaneous
spontaneous
fermentation
fermentation in organic (MO), conventional (MC) and not treated (MNT) samples. The
in organic (MO), conventional (MC) and not treated (MNT) samples. The number
number
associated
associated to
to the
the samples
samples represents
represents the
the replicates
replicates for
for each
each treatment.
treatment. InIn the
the microorganism
microorganism legend,
legend,
U.m.
U.m. abbreviation
abbreviationmeans
meansundefined
undefined microorganism.
microorganism. Only the the
Only >0.5%
taxataxa are shown
>0.5% and the
are shown the≤0.5%
taxa
and taxa
were grouped under the heading Filtered species of the legend. To the right of the graph, mean
≤0.5% were grouped under the heading Filtered species of the legend. To the right of the graph, mean values
of each of
values treatment are represented
each treatment (MO, MC
are represented andMC
(MO, MNT).
and MNT).
3.3.2. Culture-Dependent Analysis
3.3.2. Culture-Dependent Analysis
The relative abundances of yeasts by culture-dependent method are shown in Figure 7.
The relative abundances of yeasts by culture-dependent method are shown in Figure 7. The
The comparison between NGS and conventional methods showed, at this stage of fermentation,
comparison between NGS and conventional methods showed, at this stage of fermentation, some
some differences in relative abundance since some low fermenting yeasts could be dead or present at a
differences in relative abundance since some low fermenting yeasts could be dead or present at a
viable but not cultivable condition. Indeed, different to the NGS results, using the culture-dependent
viable but not cultivable condition. Indeed, different to the NGS results, using the culture-dependent
method, H. uvarum was found at lower relative abundance in all samples (8.18%, 15.06% and not
method, H. uvarum was found at lower relative abundance in all samples (8.18%, 15.06% and not
detected in MO, MC and MNT samples respectively). The MNT samples were dominated by
detected in MO, MC and MNT samples respectively). The MNT samples were dominated by two
two highly fermenting species: Z. bailii (55.71%) (just detected by NGS; 0.02%) and C. californica
highly fermenting species: Z. bailii (55.71%) (just detected by NGS; 0.02%) and C. californica (44.30%).
(44.30%). The relative abundance of C. californica in MO and MC samples was comparable to NGS
The relative abundance of C. californica in MO and MC samples was comparable to NGS results. MO
results. MO samples were dominated by S. bacillaris (41.00%) and Debaryomyces hansenii, (15.27%)
samples were dominated by S. bacillaris (41.00%) and Debaryomyces hansenii, (15.27%) (not detected
(not detected by NGS). In MC samples, the presence of L. thermotolerans was confirmed using both
by NGS). In MC samples, the presence of L. thermotolerans was confirmed using both culture-Microorganisms 2019, 7, 114 10 of 15
Microorganisms 2019, 7, 114 10 of 16
independent and -dependent
culture-independent methods,
and -dependent while while
methods, the presence of theoffermentative
the presence yeastyeast
the fermentative D. hansenii, not
D. hansenii,
detected by NGS, arose.
not detected by NGS, arose.
Figure 7. Relative abundance of yeast species detected by culture-dependent method at the 15th day
Figure 7. Relative abundance of yeast species detected by culture-dependent method at the 15th day
of spontaneous fermentation in organic (MO), conventional (MC) and not treated (MNT) samples.
of spontaneous fermentation in organic (MO), conventional (MC) and not treated (MNT) samples.
The number associated to the samples represent the replicates for each treatment. To the right of the
The number associated to the samples represent the replicates for each treatment. To the right of the
graph, mean values of each treatment are represented (MO, MC and MNT).
graph, mean values of each treatment are represented (MO, MC and MNT).
3.4. Principal Component Analysis
3.4. Principal Component Analysis
The fungal community was also subjected to Principal Component Analysis (PCoA) and the
The fungal
distribution of thecommunity
samples in was also subjected to Principal
the three-dimensional Component
plot graphic, at harvestAnalysis (PCoA)
time, at the 7th andand15th
the
distribution of the samples in the three-dimensional plot graphic, at harvest time, at the
day of fermentation, is shown in Figure 8. At harvest time (Figure 8a) the total variance explained was 7 th and 15th
day of (PC
63.87% fermentation,
1 35.82%, PC is shown in PC
2 17.68%, Figure 8. At harvest
3 10.37%). time distribution
The graphic (Figure 8a) the total
of the variance
samples explained
highlighted a
was 63.87%
clear (PCbetween
distinction 1 35.82%, MO PC 2 17.68%,
and PC 3 while
MC samples, 10.37%). The graphic
the MNT samplesdistribution
were closelyofrelated
the samples
to the
highlighted
MO ones. a clear distinction between MO and MC samples, while the MNT samples were closely
related
At to
thethe MO
7th dayones.
of spontaneous fermentation, Figure 8b shows a clear distinction in fungal
At the composition
community 7th day of spontaneous fermentation,
among the three Figure
treatments. At the8b15th
shows a clear
day of distinction
spontaneous in fungal
fermentation
community
MC samples composition
Microorganismsgrouped among while
separately,
2019, 7, 114 the three
MO treatments. At the 15
and MNT samples th day some
showed of spontaneous fermentation
overlaps (Figure 8c).
11 of 16
MC samples grouped separately, while MO and MNT samples showed some overlaps (Figure 8c).
(a)
(b) Figure 8. Cont.Microorganisms 2019, 7, 114 11 of 15
(b)
(b)
(b)
(b)
(c)
(c)
(c)
(c)
FigureFigure
Figure
Figure
Figure
8.8.8.Principal
Principal 8. Coordinate
Principal
Principal
8. Principal
Coordinate
Coordinate
Coordinate
Coordinate
Analysis
Analysis
Analysis
Analysis
Analysis
(PCoA)
(PCoA) (PCoA)
based
(PCoA)based
(PCoA)
basedon onbased
on the
the
based
on
fungal
thefungal
fungal
on
theITS
ITS the
fungal fungal
ITS
sequences
ITSsequences
sequences
ITS sequences
sequences
identified
identified identified
identified inin
in
identified
in organic in
organic
organic
organic(MO) organic
(MO)
(MO) (MO)
;; conventional
;conventional ;
conventional(MC)conventional
(MC)
(MC) and(MC)
and not
andnot treated
nottreated and not
(MNT)
treated(MNT)
(MNT) treated (MNT)
samples
samples
samplesatatatthe
the samples
harvest
theharvest time
harvesttime
timeat the harvest time
(MO) ;thconventional (MC)th and not treated (MNT) samples at the harvest time (a), at 7th day
(a),
(a),
(a),at th (a),
dayat
day
atat77th7thday (b)
(b) 7and
(b) and
andday
at (b)
atat15
15
15th and
day
day
th th at
(c)
day(c) 15
(c)of day (c) of fermentation.
ofofspontaneous
spontaneous
spontaneous spontaneous
fermentation. fermentation.
Percentages
fermentation.Percentages shown
Percentagesshown Percentages
shown along
along the
alongthe shown
axes along the axes
axes
theaxes
(b) and at 15th day (c) of spontaneous fermentation. Percentages shown along the axes represent the
represent
represent
represent the
the proportion
represent
theproportion
proportion ofofdissimilarities
of dissimilarities
the proportiondissimilarities captured
of dissimilarities
captured by
capturedby the
bythe
the axes.
captured
axes. by the axes.
axes.
proportion of dissimilarities captured by the axes.
4. Discussion
Knowledge of the complex dynamic microbial ecosystem associated with grape berry surfaces,
represented by yeasts, filamentous fungi and bacteria [1], is crucial to better understand their
involvement during the winemaking process, with consequent repercussions on wine quality [7,41–43].
The study of fungal diversity during the winemaking process using culture-dependent methods can
lead to risks such as an incomplete microbial detection and identification, linked to different microbial
kinetics or VBNC state of such species or for low abundant strains [44]. Recently, the development
of NGS technology allowed to obtain more exhaustive information about microbial communities
associated with grape berries, fresh must and wineries [7,29,45,46].
In the present study, the impact of organic and conventional treatments on the occurrence
of the fungal community in the Montepulciano variety was evaluated by NGS technology and
culture-dependent methods, comparing the overall results obtained. As expected, at the harvest
time, 164 fungal species were identified by NGS, while only 14 yeast species were identified by
culture-dependent methods. However, both methodologies detected A. pullulans and H. uvarum as the
most abundant species found in all samples at the harvest time. The occurrence of A. pullulans seemsMicroorganisms 2019, 7, 114 12 of 15
to be influenced by treatments: indeed, it was the most abundant species detected in conventional
samples. These data confirmed the results of previous studies [5,47,48] that found A. pullulans as
the most abundant species on the grape surface at harvest time. Although this yeast is considered
irrelevant in the fermentation process for its inability to ferment sugars, it represents a common resident
of grape berries [1]. Regarding H. uvarum, no relevant differences at harvest time among the treatments
was found using both methodologies.
The presence of S. bacillaris characterized MO samples, while L. thermotolerans was only found in
MC samples. These data are in agreement with those of Ghosh et al. [49] that described S. bacillaris as
the dominant yeast species in biodynamic Cabernet Sauvignon fresh must and Cordero-Bueso and
co-workers [20] that described L. thermotolerans as predominant non-Saccharomyces yeast found in
organic and conventional samples. M. pulcherrima was only found in MC and MNT samples using
both technologies, confirming the results obtained by Milanović et al. [22] that showed the negative
effect of the organic treatments on this species. The fungal dynamic at the 7th day of spontaneous
fermentation showed, as expected, a reduction of species and the predominance of H. uvarum using
both methodologies [4,29,50,51]. However, an overestimation of this yeast using NGS methodology at
the 15th day of fermentation was found since the culture-dependent method detected absence or limited
presence in all samples. This result could be due to the detection by NGS method of dead and/or viable
but non culturable cells showing, at this time, a warped picture of the fermentative yeast population.
Indeed, at this time, using the culture-dependent method, a predominance of S. bacillaris, C. californica
and Z. bailii in MNT samples was found. The fermenting yeasts C. californica and P. kluyveri, seemed to
be negatively influenced by treatments. Other fermenting yeasts (M. guillermondii, T. delbrueckii and
Z. meyerae) were detected in MO and/or in MNT samples only by NGS analysis. D. hansenii (MO and
MC samples) and Z. bailii (MNT samples) were detected only by the culture-dependent method. It is
necessary underline that the failure in some species identification by NGS, could be due to a significant
portion of relative abundance described as unidentified yeasts or fungi. In this regard, the choice of the
target used during microbial metabarcoding and the availability of an exhaustive reference database for
the target chosen becomes very important. To date, only few fungal databases are available, therefore
more exhaustive database information of bioinformatics packages could be necessary to improve the
sensitivity of the method [52,53]. In the condition tested, S. cerevisiae was very poorly detected and
only using the NGS method (about 0.003% at the 7th and 15th day of spontaneous fermentation) in
agreement with previous works [54–56]. Similar to previous investigations [22–55]. , carried out in the
same conditions (aseptically microfermentations), relevant residual sugars and high volatile acidity
were found, probably influencing the poor finding of S. cerevisiae (Tables S3 and S4).
The two methods used in the present study revealed the same species concerning the dominant
yeast species even if with different relative abundances (overestimation of H. uvarum at the 7th and
15th day of fermentation). This result highlights some limitations of NGS methodology regarding its
application in the monitoring of the yeast dynamic during the fermentation process. On the other hand,
the NGS method was able to identify a great biodiversity in comparison with the culture-dependent
method, particularly regarding the lower abundant species.
The influence of fungicide treatments on the grape yeast community composition highlighted
the loss of yeast biodiversity with conventional treatments in agreement with the results of
Cordero-Bueso et al. [20] and Escribano-Viana et al. [23]. Chemical compounds (conventional treatments)
seem to adversely affect the fermenting yeasts in favor of oxidative yeasts such as A. pullulans.
Moreover, S. bacillaris was more present in MO samples (detected by NGS method) while H. uvarum
was significantly lower in MNT samples (culture-dependent method). In this regard, the fermenting
yeast species, often undetected at harvest time, become detectable during the fermentation process
and are, as a result, different as a function of the fungicide treatments (MC, MO or MNT) applied.
Considering the evidence that the yeast community of grape berries plays an important role in
the winemaking process, also determining an imprint in relation to geographic viticultural area,
the vineyard farming system affecting the mycobiota plays an indirect impact on wine fermentation.Microorganisms 2019, 7, 114 13 of 15
Supplementary Materials: The following are available online at http://www.mdpi.com/2076-2607/7/5/114/s1,
Table S1: Analysis of variance (ANOVA) of filamentous fungi detected by NGS in Montepulciano samples at
harvest time and at the 7th and 15th day of microfermentation carried out using aseptically pressed grapes.
Table S2: Analysis of variance (ANOVA) of yeast species detected by culture-dependent method in Montepulciano
samples at harvest time and at the 7th and 15th day of microfermentation carried out using aseptically pressed
grapes. Table S3: The main analytical compounds of Montepulciano microfermentations carried out using
aseptically pressed grapes. Table S4: Analytical results of organic (MO), conventional (MC) and not treated (MNT)
Montepulciano samples.
Author Contributions: A.A., L.C., M.C., F.C., participated in the design and discussion of the research. A.A.
and L.C., carried out the experimental part of the work while L.M., C.M. and M.V. carried out the NGS analysis
evaluating the metagenomic results. All authors contributed to writing the manuscript. All authors have read and
approved the final manuscript.
Conflicts of Interest: The authors declare that they have no conflict of interest.
References
1. Barata, A.; Malfeito-Ferreira, M.; Loureiro, V. The microbial ecology of wine grape berries. Int. J. Food Microbiol.
2012, 153, 243–259. [CrossRef] [PubMed]
2. Abdelfattah, A.; Wisniewski, M.; Nicosia, M.G.L.D.; Cacciola, S.O.; Schena, L. Metagenomic analysis of
fungal diversity on strawberry plants and the effect of management practices on the fungal community
structure of aerial organs. PLoS ONE 2016, 11, e0160470. [CrossRef] [PubMed]
3. Madden, A.A.; Epps, M.J.; Fukami, T.; Irwin, R.E.; Sheppard, J.; Sorger, D.M.; Dunn, R.R. The ecology of
insect–yeast relationships and its relevance to human industry. Proc. R. Soc. B Biol. Sci. 2018, 285, 20172733.
[CrossRef]
4. Pretorius, I.S. Tailoring wine yeast for the new millennium: novel approaches to the ancient art of winemaking.
Yeast 2000, 16, 675–729. [PubMed]
5. Comitini, F.; Ciani, M. Influence of fungicide treatments on the occurrence of yeast flora associated with
wine grapes. Ann. Microbiol. 2008, 58, 489–493. [CrossRef]
6. Chavan, P.; Mane, S.; Kulkarni, G.; Shaikh, S.; Ghormade, V.; Nerkar, D.P.; Shouche, Y.; Deshpande, M.V.
Natural yeast flora of different varieties of grapes used for wine making in India. Food Microbiol. 2009, 26,
801–808. [PubMed]
7. Bokulich, N.A.; Thorngate, J.H.; Richardson, P.M.; Mills, D.A. Microbial biogeography of wine grapes is
conditioned by cultivar, vintage, and climate. Proc. Natl. Acad. Sci. USA 2014, 111, E139–E148. [PubMed]
8. Taylor, M.W.; Tsai, P.; Anfang, N.; Ross, H.A.; Goddard, M.R. Pyrosequencing reveals regional differences in
fruit-associated fungal communities. Environ. Microbiol. 2014, 16, 2848–2858. [PubMed]
9. Zhang, J.; Wang, E.T.; Singh, R.P.; Guo, C.; Shang, Y.; Chen, J.; Liu, C. Grape berry surface bacterial microbiome:
impact from the varieties and clones in the same vineyard from central China. J. Appl. Microbiol. 2019, 126,
204–214.
10. Swiegers, J.H.; Pretorius, I.S. Yeast modulation of wine flavor. Adv. Appl. Microbiol. 2005, 57, 131–175.
11. Francesca, N.; Canale, D.E.; Settanni, L.; Moschetti, G. Dissemination of wine-related yeasts by migratory
birds. Environ. Microbiol. Rep. 2012, 4, 105–112. [CrossRef]
12. Stefanini, I.; Dapporto, L.; Legras, J.L.; Calabretta, A.; Di Paola, M.; De Filippo, C.; Viola, R.; Capretti, P.;
Polsinelli, M.; Tuillazzi, S.; et al. Role of social wasps in Saccharomyces cerevisiae ecology and evolution.
Proc. Natl. Acad. Sci. USA 2012, 109, 13398–13403. [CrossRef] [PubMed]
13. Arroyo-López, F.N.; Salvadó, Z.; Tronchoni, J.; Guillamón, J.M.; Barrio, E.; Querol, A. Susceptibility and
resistance to ethanol in Saccharomyces strains isolated from wild and fermentative environments. Yeast 2010,
27, 1005–1015. [CrossRef] [PubMed]
14. Loureiro, V.; Querol, A. The prevalence and control of spoilage yeasts in foods and beverages. Trends Food
Sci. Technol. 1999, 10, 356–365. [CrossRef]
15. Malfeito-Ferreira, M. Yeasts and wine off-flavours: A technological perspective. Ann. Microbiol. 2011, 61,
95–102. [CrossRef]
16. Regueiro, L.A.; Costas, C.L.; Rubio, J.E.L. Influence of viticultural and enological practices on the development
of yeast populations during winemaking. Am. J. Enol. Viticult. 1993, 44, 405–408.
17. Viviani-Nauer, A.; Hoffman-Boller, P.; Basler, P.; Gafner, J. Wild yeast flora on grapes of fungi disease resistant
cultivars and their dynamics during fermentation. Schweiz. Z. Obst-Weinbau 1995, 131, 390–393.Microorganisms 2019, 7, 114 14 of 15
18. Ganga, M.A.; Martinez, C. Effect of wine yeast monoculture practice on the biodiversity of non-Saccharomyces
yeasts. J. Appl. Microbiol. 2004, 96, 76–83. [CrossRef]
19. Valero, E.; Cambon, B.; Schuller, D.; Casal, M.; Dequin, S. Biodiversity of Saccharomyces yeast strains from
grape berries of wine-producing areas using starter commercial yeasts. FEMS Y. Res. 2007, 7, 317–329.
[CrossRef]
20. Cordero-Bueso, G.; Arroyo, T.; Serrano, A.; Tello, J.; Aporta, I.; Vélez, M.D.; Valero, E. Influence of the farming
system and vine variety on yeast communities associated with grape berries. Int. J. Food Microbiol. 2011, 145,
132–139. [CrossRef]
21. Tello, J.; Cordero-Bueso, G.; Aporta, I.; Cabellos, J.M.; Arroyo, T. Genetic diversity in commercial wineries:
Effects of the farming system and vinification management on wine yeasts. J. Appl. Microbiol. 2012, 112,
302–315. [CrossRef] [PubMed]
22. Milanović, V.; Comitini, F.; Ciani, M. Grape berry yeast communities: Influence of fungicide treatments. Int J.
Food Microbiol. 2013, 161, 240–246. [CrossRef]
23. Escribano-Viana, R.; López-Alfaro, I.; López, R.; Santamaría, P.; Gutiérrez, A.R.; González-Arenzana, L.
Impact of Chemical and Biological Fungicides Applied to Grapevine on Grape Biofilm, Must, and Wine
Microbial Diversity. Front. Microbiol. 2018, 9, 59. [CrossRef]
24. Piao, H.; Hawley, E.; Kopf, S.; De Scenzo, R.; Sealock, S.; Henick-Kling, T.; Hess, M. Insights into the bacterial
community and its temporal succession during the fermentation of wine grapes. Front. Microbiol. 2015,
6, 809. [CrossRef]
25. Cocolin, L.; Alessandria, V.; Dolci, P.; Gorra, R.; Rantsiou, K. Culture independent methods to assess the
diversity and dynamics of microbiota during food fermentation. Int. J. Food Microbiol. 2013, 167, 29–43.
[CrossRef]
26. Maturano, Y.P.; Mestre, M.V.; Combina, M.; Toro, M.E.; Vazquez, F.; Esteve-Zarzoso, B. Culture-dependent
and independent techniques to monitor yeast species during cold soak carried out at different temperatures
in winemaking. Int. J. Food Microbiol. 2016, 237, 142–149. [CrossRef]
27. Bokulich, N.A.; Joseph, C.M.L.; Allen, G.R.; Benson, A.K.; Mills, D.A. Next-generation sequencing reveals
significant bacterial diversity of botrytized wine. PLoS ONE 2012, 7, e36357. [CrossRef]
28. De Filippis, F.; La Storia, A.; Villani, F.; Ercolini, D. Exploring the sources of bacterial spoilers in beef steaks
by culture-independent high-throughput sequencing. PLoS ONE 2013, 8, e70222. [CrossRef] [PubMed]
29. Wang, C.; García-Fernández, D.; Mas, A.; Esteve-Zarzoso, B. Fungal diversity in grape must and wine
fermentation assessed by massive sequencing, quantitative PCR and DGGE. Front. Microbiol. 2015, 6, 1156.
[CrossRef] [PubMed]
30. Stringini, M.; Comitini, F.; Taccari, M.; Ciani, M. Yeast diversity in crop-growing environments in Cameroon.
Int. J. Food Microbiol. 2008, 127, 184–189. [CrossRef] [PubMed]
31. EEC. Council Regulation 2870/00 laying down Community reference methods for the analysis of spirit drinks.
Off. J. Eur. Comm. 2000, L333, 20–46.
32. White, T.J.; Bruns, T.; Lee, S.J.W.T.; Taylor, J.L. Amplification and direct sequencing of fungal ribosomal RNA
genes for phylogenetics. In PCR Protocols: A Guide to Methods and Applications; Academic Press: Cambridge,
MA, USA, 1990; pp. 315–322.
33. Esteve-Zarzoso, B.; Belloch, C.; Uruburu, F.; Querol, A. Identification of yeasts by RFLP analysis of the 5.8 S
rRNA gene and the two ribosomal internal transcribed spacers. Int. J. Syst. Evol. Microbiol. 1999, 49, 329–337.
[CrossRef] [PubMed]
34. Altschul, S.F.; Madden, T.L.; Schäffer, A.A.; Zhang, J.; Zhang, Z.; Miller, W.; Lipman, D.J. Gapped BLAST and
PSI-BLAST: A new generation of protein database search programs. Nucleic Acids Res. 1997, 25, 3389–3402.
[CrossRef] [PubMed]
35. Kurtzman, C.P.; Robnett, C.J. Identification and phylogeny of ascomycetous yeasts from analysis of nuclear
large subunit (26S) ribosomal DNA partial sequences. Antonie van Leeuwenhoek 1998, 73, 331–371. [CrossRef]
36. Bokulich, N.A.; Mills, D.A. Improved selection of internal transcribed spacer-specific primers enables
quantitative, ultra-high-throughput profiling of fungal communities. Appl. Envirol. Microbiol. 2013, 79,
2519–2526. [CrossRef] [PubMed]
37. Caporaso, J.G.; Kuczynski, J.; Stombaugh, J.; Bittinger, K.; Bushman, F.D.; Costello, E.K.; Fierer, N.; Peña, A.G.;
Goodrich, J.K.; Gordon, J.I.; et al. QIIME allows analysis of high-throughput community sequencing data.
Nat. Methods 2010, 7, 335. [CrossRef]You can also read