Changes in the density and distribution of birds following possum control on Otago Peninsula: Otago Peninsula Biodiversity Group
←
→
Page content transcription
If your browser does not render page correctly, please read the page content below
Changes in the density and distribution of
 birds following possum control on Otago
                 Peninsula:
 Community based monitoring of bird fauna outcomes
using the slow walk transect method between 2011-2017.

                  Prepared by Richard Ewans – Eco-South

             For the Otago Peninsula Biodiversity Group (OPBG)

                               21 June 2017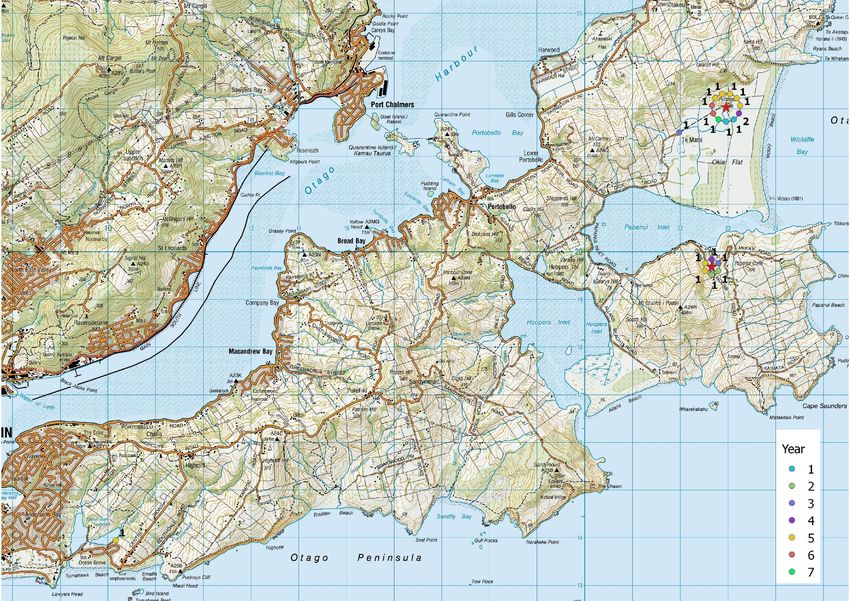
Changes in the density and distribution of
    birds following possum control on Otago
                    Peninsula:
  Community based monitoring of bird fauna outcomes
 using the slow walk transect method between 2011-2017.

Prepared by:

Richard Ewans - Eco-South

151 Belford Street, Waverley, Dunedin 9013

Prepared for:

Otago Peninsula Biodiversity Group (OPBG)

P O Box 11, Portobello, Dunedin 9048

21 June 2017

Cover image: Bellbird on Otago Peninsula (photo: C. Hewitt, supplied by Moira Parker)

© Eco-South 2017

This report has been produced by Eco-South for the Otago Peninsula Biodiversity Group. All copyright in this report is the
property of Eco-South and any unauthorised publication, reproduction, or adaptation of this report is a breach of that copyright.
Eco-South has prepared this report based on information available to it at the time of its preparation. Nothing in this report is or
shall be relied upon as a promise or representation of future events or results. Eco-South makes no representation or warranty,
expressed or implied, as to the accuracy or completeness of the information provided in this report or any other representation
or warranty whatsoever concerning this report. Eco-South expressly disclaims any and all liability arising out of or relating to the
use of this report.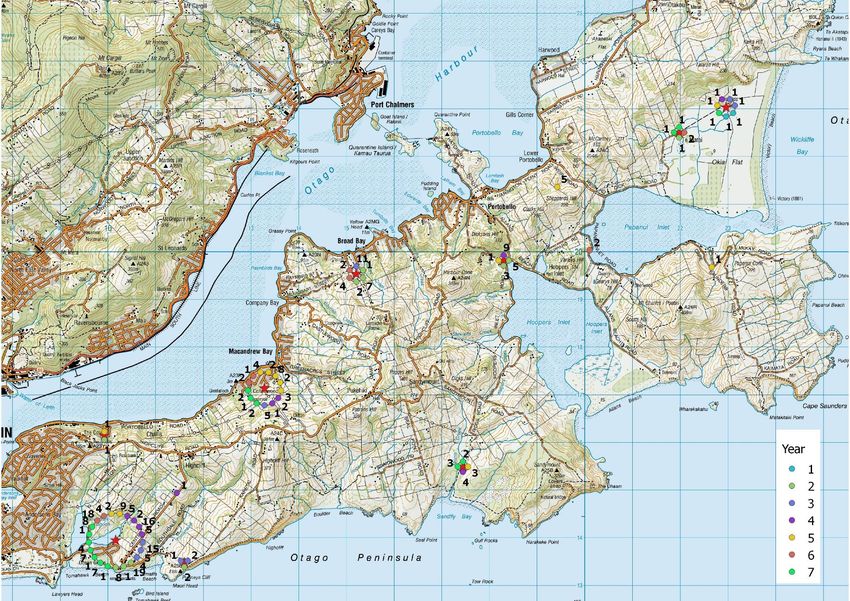
1

Contents

1.     Introduction and Objectives ....................................................................................................... 2

2.     Methodology ................................................................................................................................ 3
     2.1      Study area ...................................................................................................................................................... 3
     2.2      Slow walk bird count transect monitoring ........................................................................................................ 4
     2.3      Data analysis ................................................................................................................................................. 5

3.     Results .......................................................................................................................................... 6
     3.1      Overall bird abundance ................................................................................................................................... 6
     3.2      Bird distribution ............................................................................................................................................. 9
     3.3      Threatened or at risk species ........................................................................................................................... 9

4.     Discussion................................................................................................................................... 10
     4.1      Changes in bird abundance ........................................................................................................................... 10
     4.2      Changes in possum densities on Otago Peninsula........................................................................................... 11
     4.3      Implementation of slow walk transect methodology ......................................................................................... 11

5.     Conclusions and Recommendations ......................................................................................... 13

6.     Acknowledgements .................................................................................................................... 14

7.     References................................................................................................................................... 15

8.     Other Reading ............................................................................................................................ 16

Appendix 1. List of birds recorded on Otago Peninsula during slow walk transect counts. .......... 17

Appendix 2. List of slow walk transects ............................................................................................ 19

Appendix 3. Map of slow walk transects ...........................................................................................20

Appendix 4. Maps of common native forest bird species recorded ................................................. 21

Appendix 5. Maps of ‘at risk’ species recorded ................................................................................22

Otago Peninsula slow walk transect bird monitoring                                                                                   www.ecosouth.co.nz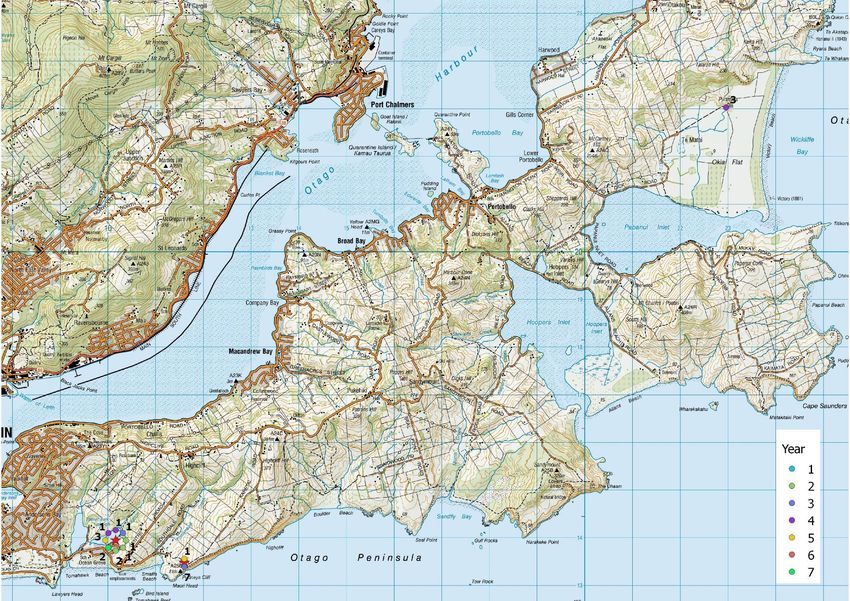
2

1.       Introduction and Objectives
The Otago Peninsula Biodiversity Group (OPBG) is a community trust which has been carrying out
intensive possum control on the Otago Peninsula since 2011. The aim of the trust is to enhance the
biodiversity of the Otago Peninsula by removing possums as a first step towards a long-term goal of
making the peninsula pest-free. As of March 2017, over 11,000 possums had been removed from the
9,500 hectare (ha) operational area.

The OPBG has implemented a range of biodiversity monitoring programmes to inform progress towards
this goal, including monitoring of bird abundance. The primary purpose of the bird monitoring is to
measure changes in the density and distribution of birds resulting from pest control operations.

Possums may impact on bird populations by both competing for resources and direct predation. Possums
are generalist and opportunistic feeders and although often primarily herbivorous, will consume
invertebrates and birds when available. Frugivorous, herbivorous, insectivorous and nectivorous birds,
such as kokako, kereru, tui or bellbird, may increase after control of omnivorous ship rats and brushtail
possums due to reduced predation, or increased food, or both (Innes et al, 2010).

Possums usually focus their herbivory on a small set of “key species”, and often only target particular
individuals of those species at a site which can cause the progressive reduction and elimination of
preferred food species (Sweetapple et al. 2004; Nugent et al., 2010, Duncan et al., 2011, Gormley et al.,
2012) and even lead or contribute to the collapse of forest canopies over large areas. Possums can also
consume large quantities of flowers and fruit.

Possums are significant predators of the eggs, nestlings and sometimes adults of a number of native bird
species including species present on Otago Peninsula such as harrier hawk, fantail and kereru/New
Zealand pigeon, as well species present elsewhere such as brown kiwi, kokako and saddleback (Innes,
1994). It is highly likely a range of other bird species are also subject to possum predation.

The slow walk transect bird count method (Greene, 2012) can help guide management by measuring
changes in bird density and distribution. The method uses repeated counts of birds on pre-determined
transect routes to determine trends (an increase or decrease) in the relative abundance of birds and their
distribution in the landscape. Combined with result monitoring data (i.e. indices of possum and other pest
abundance) outcome monitoring data can answer questions about the effectiveness of management.

The OPBG began establishment of slow walk transect bird count monitoring in 2010 with 20 transects
regularly measured since 2012. This report presents the results from the first 7 years of bird monitoring
and aims to answer the following question:

‘Has a reduction in possum densities coincided with an increase in bird abundance and
distribution?’

Otago Peninsula slow walk transect bird monitoring                              www.ecosouth.co.nz

3

2.       Methodology

2.1      Study area
Otago Peninsula lies to the east of the Dunedin City urban area and is approximately 9,500ha in size. The
landform is the eroded flank of an extinct volcano ranging in altitude from sea level to 408m. Originally
mostly forested in the recent pre-human era, the current vegetation is a mosaic of pasture with
native/exotic shrubland or scrub, remnant native forest patches, small pine plantations and hedgerows,
and other vegetation types such as those on wetlands and/or coastal dunes. Pastureland is currently the
predominant landcover type.

Map 1. Otago Peninsula landscape.

Approximately 5% of the land area on Otago Peninsula currently supports native forest or scrub. The
forest is remnant and regenerating podocarp-broadleaved forest with scattered podocarps, primarily Hall’s
totara (Podocarpus laetus) and matai (Prumnopitys taxifolia). Other trees characteristic of the forested areas
include broadleaf (Griselinia littoralis), ngaio (Myoporum laetum), kohuhu (Pittosporum tenuifolium), lemonwood
(Pittosporum eugenioides), narrow-leaved lacebark (Hoheria angustifolia), lowland ribbonwood (Plagianthus
regius), mahoe (Melicytus ramiflorus), tree fuchsia (Fuchsia excorticata) and kowhai (Sophora microphylla)
(Johnson, 2004).

Otago Peninsula contains a diversity of habitats and is well known for the range of bird species
(particularly seabirds and waders) able to be viewed within a relatively small area.

Slow walk bird count transects are located variously in a range of habitat types throughout the peninsula
and locations are shown in Map 2 below.

Otago Peninsula slow walk transect bird monitoring                                  www.ecosouth.co.nz

4

Map 2. Location of slow walk bird count monitoring transects on Otago Peninsula (blue arrows). Yellow diamonds show
non-operational transect locations.

2.2      Slow walk bird count transect monitoring
A total of 25 slow walk transects have been established since 2010. Of these; two transects were quickly
abandoned (6 & 15), one has been rarely measured (1) and another has never been measured (13). These
four transects are not included in this report.

A total of 21 transects are operational, although one is measured relatively infrequently (22) but still
included here. Of these; four are in bush habitat, nine in mixed bush and pasture habitat, four in pasture
habitat, two in wetland habitat and two in suburban areas.

Transects are planned to be monitored eight times per year (weeks 2 and 3 in September, October and
November, and week 4 of April and week 1 of May), however this is rarely the case and different
transects are monitored with varying frequencies in each year. Until 2013, transects were planned to be
monitored for a minimum of six times per year during between October and early December, and late
April/early May. Transects on farmland are not counted in September, due to restricted access during the
lambing season.

Transects are generally monitored between one hour after sunrise and 11am. Observers, who are
volunteer residents of Otago Peninsula, walk slowly recording all birds seen/heard of 10 main species up
to 100m away from the transect. The 10 main species monitored are bellbird, fantail, fernbird, grey
warbler, kereru/New Zealand pigeon, magpie, paradise duck, skylark, tomtit and tui. All observers can
confidently identify these species.

Otago Peninsula slow walk transect bird monitoring                                     www.ecosouth.co.nz
5
All other bird species are recorded although there is likely to be some inconsistency around observer
expertise for some other species. Each observer is affiliated with a particular transect, although different
observers occasionally fill in for regular observers when required. There are 12 observers who have
consistently measured their transects since the start of the monitoring. The same volunteer has also
coordinated the bird monitoring programme since its inception. New observers are given training on their
specific transect, and additional bird identification training and resources.
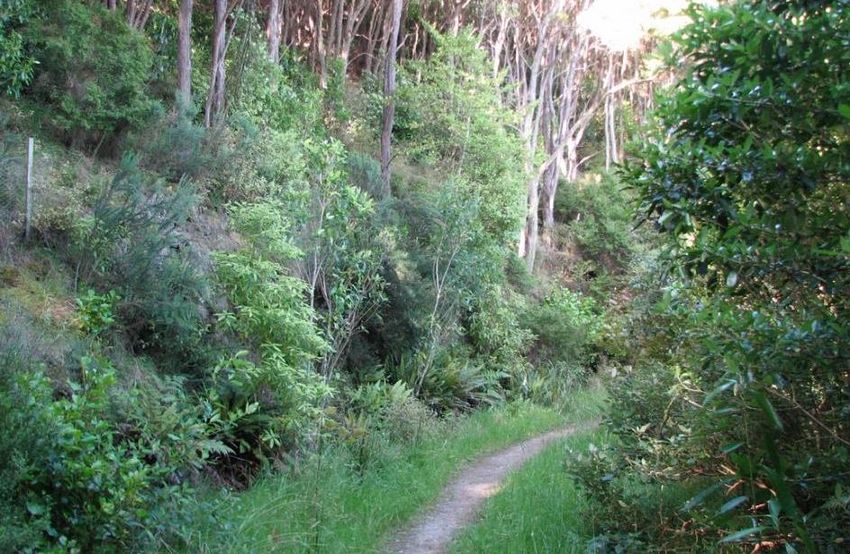
Leith walk transect/Transect 11 (photo supplied by Moira Parker).
2.3 Data analysis
For each year the number of birds of each species recorded on each transect was averaged across seasonal
observations to produce an annual figure. The annual number for each species on each transect was then
averaged across the site and plotted with 95% confidence intervals. Results are mapped for common
native forest birds and threatened or at risk species for each transect and each year.
A number of bird species recorded are not presented here as observations were either very few, clumped,
highly variable, and/or restricted to one or two transects. Species not included here are little owl, Canada
goose, rock pigeon, shoveler, black swan, little shag, white-faced heron and pied stilt.
Descriptive statistics were calculated in Microsoft Excel. Graphics work undertaken used the R statistical
computing environment (version 3.3.3; R Development Core Team, 2017). Mapping was done using
QGIS. Satellite imagery in Map 1 is derived from Google Earth.
Otago Peninsula slow walk transect bird monitoring www.ecosouth.co.nz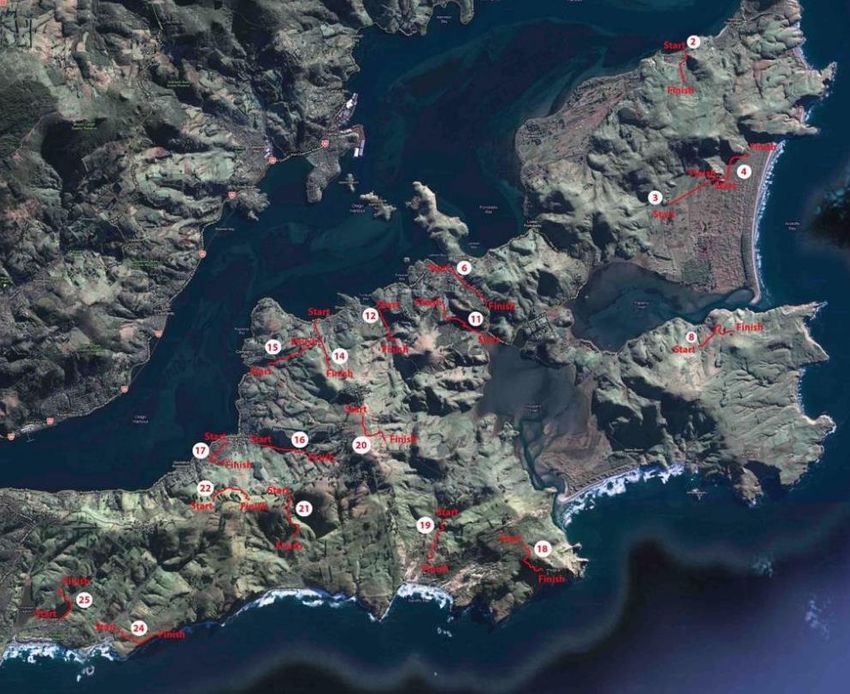
6

3.       Results

3.1      Overall bird abundance
A total of 46 bird species were recorded on transects during the survey period. Of these, 30 species were
native or endemic to New Zealand with 16 species introduced and naturalised. A total of 10,121
observations were made of 52,580 birds

Results are presented below in line graphs with the average count per transect for each year. Error bars
are 95% confidence intervals and y-axis scales differ between species. Year 1 = 1 July 2010 – 30 June
2011, Year 2 = 1 July 2011 – 30 June 2012, Year 3 = 1 July 2012 – 30 June 2013, Year 4 = 1 July 2013 –
30 June 2014, Year 5 = 1 July 2014 – 30 June 2015, Year 6 = 1 July 2015 – 30 June 2016, Year 7 = 1 July
2016 – 30 June 2017. * denotes introduced bird species.

Figure 1. Mean counts per transect of 9 native forest birds on Otago Peninsula 2010-2017.

Otago Peninsula slow walk transect bird monitoring                             www.ecosouth.co.nz
7

Several species of native bird (see Figures 1 & 3) appear to have increased over time e.g. bellbird (mean of
2.8 birds per transect in Year 1 to 4.7 birds per transect in Year 7), grey warbler (mean of 1.4 birds per
transect in Year 1 to 2.1 birds per transect in Year 7) and pukeko (mean of 0.6 birds per transect in Year 1
to 1.2 birds per transect in Year 7). Introduced birds (see Figure 2) such as blackbird (mean of 2.8 birds
per transect in Year 1 to 4.7 birds per transect in Year 7) and dunnock (mean of 1.6 birds per transect in
Year 1 to 3.4 birds per transect in Year 7) also appear to have increased during the survey period.

Species that appear to show a decrease include native species such as spur-winged plover (mean of 1.3
birds per transect in Year 1 to 0.4 birds per transect in Year 7, see Figure 3) and introduced species such
as redpoll (mean of 2.7 birds per transect in Year 1 to 1.4 birds per transect in Year 7, see Figure 2) and
magpie (mean of 1.3 birds per transect in Year 1 to 0.7 birds per transect in Year 7).

Figure 2. Mean counts per transect of 9 introduced birds on Otago Peninsula 2010-2017.

Otago Peninsula slow walk transect bird monitoring                               www.ecosouth.co.nz
8

Figure 3. Mean counts per transect of 6 larger birds on Otago Peninsula 2010-2017.

Figure 4. Mean counts per transect of 6 smaller birds on Otago Peninsula 2010-2017.

Otago Peninsula slow walk transect bird monitoring                            www.ecosouth.co.nz
9

Few consistent trends can be identified for other species which have either few observations (kingfisher,
shining cuckoo, brown creeper, tomtit), large confidence intervals (mallard, paradise duck, skylark,
silvereye), or small and/or inconsistent trends (black-backed gull, harrier hawk, welcome swallow, starling,
chaffinch, goldfinch, greenfinch, song thrush, house sparrow, yellow hammer, fantail, kereru, tui,
rifleman).

3.2      Bird distribution
Maps in Appendix 4 show the annual average number of birds on each transect in Years 2-7 for the
native forest bird species in Figure 1. Coloured dot size on the maps is proportional to the annual average
number of birds, yellow dots always represent 0 while transects that were not measured in any year are
not shown.

3.3      Threatened or at risk species
Numerous ‘threatened’ or ‘at risk’ (Robertson et al., 2012) bird species are present on Otago Peninsula
including high profile species such as royal albatross and yellow-eyed penguin.

Eight species with a conservation status other than ‘not threatened’ were recorded on the slow walk
transect monitoring. All of these species are classified as ‘at risk’ (see Table 1) below. The eight ‘at risk’
species recorded have relatively few observations or are patchily distributed and are shown on maps in
Appendix 5.

Table 1. Eight ‘at risk’ species recorded on OPBG slow walk bird count transects between 2010-2017.

            Common name                            New               Conservation status           Total number
                                                Zealand                                                  of
                                                  status                                           observations
black shag                                    native           At Risk - naturally uncommon              11
New Zealand falcon                            endemic          At Risk - recovering                      19
South Island fernbird                         endemic          At Risk - declining                       32
South Island pied oystercatcher               endemic          At Risk - declining                       56
New Zealand pipit                             endemic          At Risk - declining                        2
red-billed gull                               native           At Risk - declining                       71
royal spoonbill                               native           At Risk - naturally uncommon               7
variable oystercatcher                        endemic          At Risk - recovering                       5

Otago Peninsula slow walk transect bird monitoring                                    www.ecosouth.co.nz
10 4. Discussion 4.1 Changes in bird abundance Slow walk transect bird counts provide a measure of relative (rather than absolute) abundance. Methods such as slow walk transects and five-minute bird counts are called incomplete counts because of the difficulty of distinguishing between a bird being not present or present but not detected when a null observation is recorded. Bird density may increase and bird distribution expand after possum control due to release from both predation and food competition. However the effect is unlikely to be uniform for all species as different bird species differ in the extent they are vulnerable to the effects of possums. In addition, a range of other introduced predators are likely to be influencing the density and distribution of native birds on Otago Peninsula e.g. rodents (mice, rats), mustelids (weasels, stoats, ferrets), feral cats and hedgehogs. Several native bird species appear to have increased in abundance over the last few years such as bellbird, grey warbler and pukeko. OPBG receives many anecdotal reports, for example from a landowner seeing tui for the first time on their place in 50 years or a resident noticing that bellbirds seem more abundant over the past 4 years. Several introduced bird species also appear to have increased such as blackbird and dunnock. Other species appear to have declined including native birds such as spur-winged plover. Results presented here need to be interpreted with some caution. Averaging raw bird count data is not optimal as the data is not normally distributed and zero counts are commonly overrepresented in the data. No analysis has been undertaken to assess the statistical significance of the results as the data requires statistical modelling treatment that is beyond the scope of this report. Statistical modelling procedures are used to distinguish between variation in counts resulting from differing environmental or sampling conditions and variation in the actual number of birds observed to account for the fact that it is not possible to standardise all aspects of surveys between years (Greene, 2012). In addition, inconsistent data collection can exacerbate the effects of natural variability when averaging bird numbers for the annual transect count e.g. a large group of tui in a kowhai tree in spring on a transect measured only twice in a year will inflate the average for that year compared to a transect that has been measured eight times during the year but still only encounters the one large group of tui. Results from Year 1 in particular should be viewed with caution as many transects were only measured once in that year. Also, transects are located in a range of habitat types, therefore the site is somewhat stratified and sample numbers (i.e. number of transects) in some habitat types, e.g. wetland, may not be adequate to robustly detect changes across the site. Bird detectability is also different in different habitat types although provided all transects are consistently measured every year this should not influence the data which is relative abundance measure. The detection of a possum effect on native bird species abundance may not be straightforward. Measuring bird responses to the removal or reduction of a pest mammal can give some indication of the strength of interactions between the species involved (Innes et al., 2010). It is reasonable to propose that such an effect is present as possums are now well known to be opportunistic predators of native fauna and are competitors with many bird species for food. Increases in native bird species such as tui, bellbird, robin, whitehead, and kereru were measured on Kapiti Island after possum control and eventual eradication (Innes et al., 2010) in the presence of rats which were eventually eradicated too. Otago Peninsula slow walk transect bird monitoring www.ecosouth.co.nz
11

However, the effect of possums may be relatively small compared to the individual or combined effects
of the rest of the predator suite still present on Otago Peninsula such as feral cats, rats and mustelids. For
example, the eradications of possums and wallabies from Rangitoto Island were not followed by increases
in bird populations (with the possible exception of silvereyes). The remaining ship rats, stoats, cats and
commercial honeybees may have sustained predation and/or food shortage (Innes et al., 2010) which may
have continued the suppression of bird numbers.

The monitoring transects are split between the two main possum control operational areas and most of
the transects are in Sector 4 which has only had possum control since 2013 and therefore only three or
four years of low possum densities. Therefore, it is likely that the full effect of removing possums on the
bird population will take a longer time to detect.

Attributing trends in bird abundance to the removal of possums may also be complicated by other pest
control efforts that target other predators on Otago Peninsula. The extent of such operations is currently
unquantified although is unlikely to constitute more than small localised efforts at this stage.

4.2      Changes in possum densities on Otago Peninsula
Possum control operations in Sectors 1-3 (east of the Portobello-Hoopers Inlet Road) were carried out in
2011 and 2012. Possum control operations in Sector 4 (west of the Portobello-Hoopers Inlet Road) were
carried out between 2013 and 2015 (OPBG, 2013a). As of March 2017, over 11,000 possums had been
removed from the 9,500 hectare (ha) operational area.

Interpretation of trends is limited due to the lack of a non-treatment site and possum density data i.e. pre-
and post-control RTC data and history of possum control. Additionally, the relative effects of other
predators on the bird population is currently unknown and is likely to be significant. Changes in the
density of other predators after possum control is another factor that requires data to inform
interpretation of the results of the bird monitoring.

One possible consequence of removing possums is an increase in ship rat abundance, which may directly
increase predation on birds, and/or increase food resources to other predators such as stoats. Ship rats
compete with possums for food and research in North Island forests has shown that removing possums
may result in increased ship rat numbers (e.g. Griffiths & Barron, 2016). However, recent analysis of rat
abundance on Otago Peninsula concluded that there has been no detectable increase in rat abundance in
association with possum control operations since OPBG began rodent tracking over 5 years ago (Wilson,
2017).

The effect of removing possums on native bird fauna abundance is likely to be most noticeable if possum
densities shift from high to very low. Possum density data was unavailable for this report but would add
to future analysis and interpretation of results from the slow walk transect data.

4.3      Implementation of slow walk transect methodology
The current set up of the slow walk transects should be adequate to detect changes in native forest bird
density and distribution over time at the site. The monitoring project is entirely run by volunteers and
there are 12 observers who have consistently measured their transects since the start of the monitoring.

Otago Peninsula slow walk transect bird monitoring                                 www.ecosouth.co.nz
12

This is a remarkable achievement and is to be congratulated. As is the commitment of the volunteer who
has entered all the data since the monitoring began.

However, it is clear that on some transects there is a varying amount of application to collecting the data
and it is important to minimise the amount of inconsistency between transects (and years) as much as
possible. It is recognised that this can be understandably difficult for community groups and volunteers
however the monitoring here requires greater consistency to have the best opportunity to show that
controlling possums has benefitted native bird species.

There may be several ways to achieve this. Firstly, consider dropping transect 22 altogether, particularly if
it frees up a volunteer to help complete other sites. Secondly, a reminder system for observers and a team
of back up observers to substitute in for regular observers when they are unavailable. Thirdly, regularly re-
iterate the importance of consistency of data collection to observers. Lastly, discuss the current
commitment with observers and establish whether or not it is realistic for everyone. Most transects
appear to take less than an hour to complete, plus any travel so the annual commitment for volunteer
observers is likely to be around 10 hours per year. If observers can’t commit to at least 6 measurements
per year then consider replacement observers or shared transects. Rationalisation of transects in habitat
types such as pasture could also be considered if it frees up volunteer time elsewhere.

The line transect bird count method is most effective when transects are repeated annually over relatively
long time frames (> 10 years), when sample sizes (i.e. number of transects) are high, and when variation
in observers, times of day and conditions are minimised (Greene, 2012).

As discussed above the relative effect of possums compared to other predators may be small and difficult
to detect with certainty in the short term. However, the slow walk monitoring transects are still very
valuable for the project overall as the long term goal is to control other predators on Otago Peninsula, the
benefits of which to native birds can be demonstrated by continued monitoring of the transects.

The inherent and inherited nature of the line transect bird count data in this monitoring project requires a
more detailed statistical analysis that accounts for zero-inflated count data, inconsistent data collection
and natural variability, and utilises data on predator densities. It would be prudent for OPBG to seek
relationships over the next few years that may be able to provide such analysis at minimal cost in 2023 or
thereabouts. The most likely partners are Otago University teaching staff and/or their postgraduate
students in the ecological sciences or statistics departments. The data collected here provides an excellent
real-life teaching resource that demonstrates many of the challenges of ecological science and monitoring
generally. It also may provide an opportunity to publish results on the effect of removing only possums
on a mainland bird population.

Otago Peninsula slow walk transect bird monitoring                                www.ecosouth.co.nz
13

5.       Conclusions and Recommendations
Few strong trends are discernible from the slow walk bird count transects over the last few years,
although there are encouraging signs in the data and anecdotally that bird numbers are increasing for
some species.

In ecological terms, it is a relatively short time since possum control began and a number of other
predators remain uncontrolled, therefore large increases in bird populations would not be expected at this
stage of the programme.

However, it is reasonable to assume that possums have been affecting native bird numbers, although the
effects are likely to have varied for different species. A more detailed analysis of the bird count data which
accounts for non-normally distributed and inconsistency collected data, and includes pest abundance data
would be required to fully investigate the benefits of removing possums for native bird species on Otago
Peninsula.

The following recommendations are made to promote the best opportunity to demonstrate that
controlling possums has benefitted native bird species:

     1. Continue monitoring birds on the slow walk transects but reiterate to volunteers the importance
        of consistency and ask for a firm commitment to the plan.
     2. Remove transects 1, 6, 13, 15 from the programme.
     3. After 10 years of possum control across the peninsula e.g. in 2023, undertake detailed analysis
        using statistical modelling approaches to investigate trends in bird density and distribution.

Otago Peninsula slow walk transect bird monitoring                                 www.ecosouth.co.nz
14
6. Acknowledgements
The OPBG wish to thank members of the Dunedin Branch of BirdsNZ for their expert advice on a
suitable monitoring method, and ecologist Marcia Dale for walking many of the proposed 1k transects
and undertaking the mapping.
OPBG are most grateful to Derek Onley for his enjoyable and instructive training sessions and providing
the recording sheet and CD of bird calls and songs. Derek kindly reviewed the monitoring data collected
from Nov 2011 to Sept 2013 and suggested improvements to the counting procedure.
On the first training day in 2010, Sharyn Broni generously offered to enter all the bird data and has
continued ever since. Sharyn has made a huge contribution over the past 6 years, in addition to her own
Cape Saunders transect, and OPBG are greatly indebted to her.
And finally, thank you to all those wonderful volunteers who have done their birds counts year in, year
out. There are some very competent amateur ornithologists in the team, but mostly they are local
residents with a keen interest in birds and an appreciation of the importance of collecting the data.
The author would like to acknowledge and give thanks for the assistance of Sarah Irvine, Sharyn Broni
and in particular Moira Parker from OPBG. Colin MacLeod (Otago University Botany Department) also
provided assistance to the author.
OPBG bird count volunteers at a training session (photo supplied by Moira Parker).
Otago Peninsula slow walk transect bird monitoring www.ecosouth.co.nz15
7. References
Duncan R P, Holland E P, Pech R P, Barron M, Nugent G, Parkes J. 2011. The relationship between possum
density and browse damage on kamahi in New Zealand forests. Austral Ecology 36: 858 – 869.
Gormley A M, Holland E P, Pech R P, Thomson C, Reddiex B. 2012. Impacts of an invasive herbivore on
indigenous forests. Journal of Applied Ecology 49: 1296 – 1305.
Greene T. 2012. Birds: incomplete counts – line transect counts Version 1.0. Department of Conservation
Inventory and Monitoring Toolbox. http://www.doc.govt.nz/our-work/biodiversity-inventory-and-
monitoring/birds/ Accessed 24 November 2016.
Griffiths J W, Barron M C. 2016. Spatiotemporal changes in relative rat (Rattus rattus) abundance following large-
scale pest control. New Zealand Journal of Ecology 40: 371-380.
Innes J, Kelly D, Overton J McC, Gillies C. 2010. Predation and other factors currently limiting New Zealand forest
birds. New Zealand Journal of Ecology 34(1): 86-114.
Innes J. 1994. The impacts of possums on native fauna. In O’Donnell C F J (comp.). Proceedings of a Workshop on
Possums as Conservation Pests. Possum and Bovine Tuberculosis Control National Science Strategy
Committee 29-30 November 1994, Christchurch.
Johnson P. 2004. Otago Peninsula Plants: An annotated list of vascular plants growing in wild places. Save The
Otago Peninsula (STOP) Inc, Portobello, Dunedin. 94p.
Nugent G, Whitford J, Sweetapple P, Duncan R, Holland P. 2010. Effect of one-hit control on the density of
possums (Trichosurus vulpecula) and their impacts on native forest. Science for Conservation 304. 64p.
Otago Peninsula Biodiversity Group. 2013a. Operational Report May 2010 – June 2013. Otago Peninsula
Biodiversity Group, Portobello, Dunedin. 44p.
R Development Core Team. 2017. R: A language and environment for statistical computing. R Foundation for
Statistical Computing, Vienna, Austria.
Robertson, H A; Dowding, J E; Elliot, G P; Hitchmough, R A; Miskelly, C M; O’Donnell, C F J; Powlesland, R G;
Sagar, P M; Scofield, R P; Taylor, G A. 2013. Conservation status of New Zealand birds, 2012. New Zealand
Threat Classification Series 4. Department of Conservation, Wellington.
Sweetapple P J, Fraser K W, Knightbridge P I. 2004. Diet and impacts of brushtail possum populations across an
invasion front in South Westland, New Zealand. New Zealand Journal of Ecology 28(1): 19-33.
Wilson, D. 2017. Abundance of rats (Rattus species) following brushtail possum control operations on the Otago
Peninsula. Landcare Research Contract Report: LC2768, Landcare Research, Dunedin. 21p.
Otago Peninsula slow walk transect bird monitoring www.ecosouth.co.nz16
8. Other Reading
Greene T C, Pryde M A. 2012. Three population estimation methods compared for a known South Island robin
population in Fiordland, New Zealand. New Zealand Journal of Ecology 36(3): 340-352.
Greene T C, Dilks P J, Westbrooke I M, Pryde M A. 2013. Monitoring selected forest bird species through aerial
application of 1080 baits, Waitutu, New Zealand. New Zealand Journal of Ecology 37(1): 41-50.
Handford P. 2000. Native Forest Monitoring: A guide for forest owners and managers. Forme Consulting Group
Ltd. 183p.
Meadows S, Moller H, Weller F. 2012. Reduction of bias when estimating bird abundance within small habitat
fragments. New Zealand Journal of Ecology 36(3): 408-415.
Morgan D K J, Waas J R, Innes J, Arnold G. 2012. Native bird abundance after Australian magpie (Gymnorhina
tibicen) removal from localised areas of high resource availability. New Zealand Journal of Ecology (2012) 36(3):
333-339.
Otago Peninsula Biodiversity Group. 2013b. Otago Peninsula Biodiversity Trust Bird Monitoring Report December
2013. Otago Peninsula Biodiversity Group, Portobello, Dunedin. 7p.
Sullivan J J. 2012. Recording birds in real time: a convenient method for frequent bird recording. New Zealand Journal
of Ecology 36(3): 416-424.
van Heezik Y, Ludwig K, Whitwell S, McLean I G. 2008. Nest survival of birds in an urban environment in New
Zealand. New Zealand Journal of Ecology 32(2): 155-165.
Otago Peninsula slow walk transect bird monitoring www.ecosouth.co.nz17
Appendix 1. List of birds recorded on Otago Peninsula during
slow walk transect counts.
Common name Scientific name New Zealand status Conservation Total number
status of
observations
bellbird Anthornis melanura endemic not threatened 594
black shag Phalacrocorax carbo native naturally 11
novaehollandiae uncommon
black swan Cygnus atratus native not threatened 28
southern black-backed Larus dominicanus native not threatened 470
gull
blackbird Turdus merula introduced - naturalised 740
brown creeper Mohoua novaeseelandiae endemic not threatened 26
Canada goose Branta canadensis introduced - naturalised 1
chaffinch Fringilla coelebs introduced - naturalised 538
dunnock Prunella modularis introduced - naturalised 473
New Zealand falcon Falco novaeseelandiae endemic recovering 19
South Island fantail Rhipidura fuliginosa endemic not threatened 333
South Island fernbird Bowdleria punctata endemic declining 32
European goldfinch Carduelis britannica introduced - naturalised 302
European greenfinch Carduelis chloris introduced - naturalised 179
grey warbler Gerygone igata endemic not threatened 499
harrier hawk Circus approximans native not threatened 513
house sparrow Passer domesticus introduced - naturalised 337
kereru Hemiphaga novaeseelandiae endemic not threatened 101
New Zealand Todiramphus sanctus native not threatened 146
kingfisher vagans
little owl Athene noctua introduced - naturalised 10
little shag Phalacrocorax melanoleucos native not threatened 20
brevirostris
Australian magpie Gymnorhina tibicen introduced - naturalised 315
mallard Anas platyrhynchos introduced - naturalised 205
paradise duck Tadorna variegata endemic not threatened 519
South Island pied Haematopus finschi endemic declining 56
oystercatcher
pied stilt Himantopus leucocephalus native not threatened 18
New Zealand pipit Anthus novaeseelandiae endemic declining 2
pukeko Porphyrio melanotus native not threatened 214
red-billed gull Larus novaehollandiae native declining 71
scopulinus
redpoll Carduelis flammea cabaret introduced - naturalised 244
South Island rifleman Acanthisitta chloris chloris endemic not threatened 77
rock pigeon Columba livia introduced - naturalised 4
shining cuckoo Chrysococcyx lucidus native not threatened 79
Australasian shoveler Anas rhynchotis native not threatened 14
silvereye Zosterops lateralis native not threatened 576
Eurasian skylark Alauda arvensis introduced - naturalised 375
song thrush Turdus philomelos clarkei introduced - naturalised 451
royal spoonbill Platalea regia native naturally 7
uncommon
Otago Peninsula slow walk transect bird monitoring www.ecosouth.co.nz18
spur-winged plover Vanellus miles native not threatened 194
novaehollandiae
European starling Sturnus vulgaris vulgaris introduced - naturalised 572
South Island tomtit Petroica macrocephala endemic not threatened 12
macrocephala
tui Prosthemadera endemic not threatened 283
novaeseelandiae
novaeseelandiae
variable oystercatcher Haematopus unicolor endemic recovering 5
welcome swallow Hirundo neoxena neoxena native not threatened 166
white-faced heron Egretta novaehollandiae native not threatened 48
novaehollandiae
yellowhammer Emberiza citrinella introduced - naturalised 242
caliginosa
Otago Peninsula slow walk transect bird monitoring www.ecosouth.co.nz19
Appendix 2. List of slow walk transects
Transect Habitat Transect Total
number type* names number
of
transect
counts
1 M Pipikaretu 5
2 M Tamatea Rd 46
3 P Riddell Rd 76
4 W Okia Reserve 49
5 P Roselle Farm 27
6 Allans Beach 0
Rd
7 B Varleys Hill 58
8 P Cape 57
Saunders Rd
9 M Otapahi 23
10 B Dicksons 48
Hill
11 M Leith Walk 54
12 M Bacon St 40
13 Ara Kotare 0
14 P Camp Road 35
15 McTaggart 2
Street
16 M Greenacres 76
St
17 S/B Howard St 41
18 M Sandymount 29
19 P Ridge Road 33
20 M Peggy’s Hill 26
21 M Paradise 48
Track
22 M Centre Road 13
23 S Irvine Rd 35
24 P Karetai 20
Track
25 W/B Tomahawk 27
* B=bush, P=pasture, M=mixed bush and pasture, W=wetland, S=suburban.
Otago Peninsula slow walk transect bird monitoring www.ecosouth.co.nz20 Appendix 3. Map of slow walk transects Note transects 1, 5, 7, 9, 10, 13 and 23 are on private land and not shown on this map. Transects 6 and 15 are no longer monitored. Otago Peninsula slow walk transect bird monitoring www.ecosouth.co.nz
21

Appendix 4. Maps of common native forest bird species recorded

Maps of the density and distribution common native forest bird species are provided in a separate appendix booklet for Years 2-7. Observations are coloured
differently for each bird species with the annual average of the number of individuals counted on each transect represented by different sized dots. Yellow dots
always represent 0 while transects that were not measured are not shown.

Otago Peninsula slow walk transect bird monitoring                                                                                    www.ecosouth.co.nz
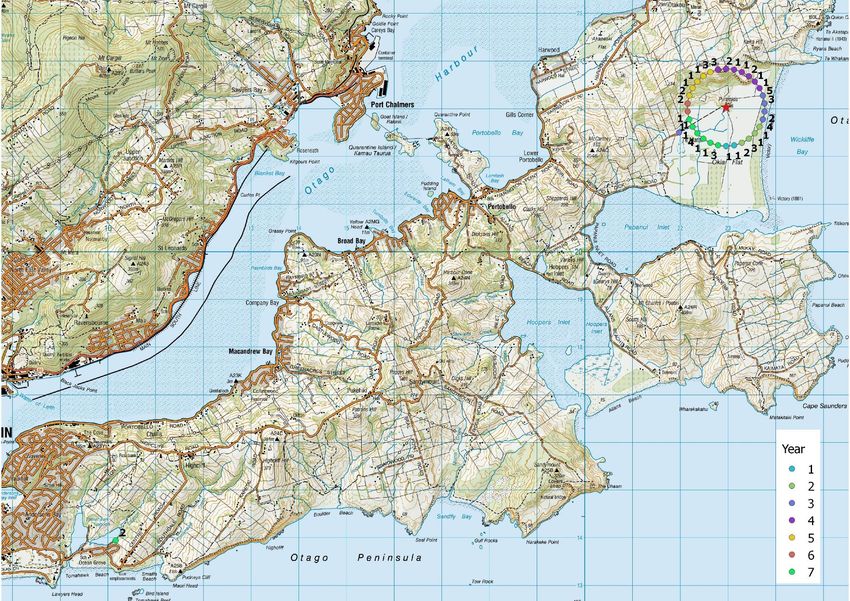
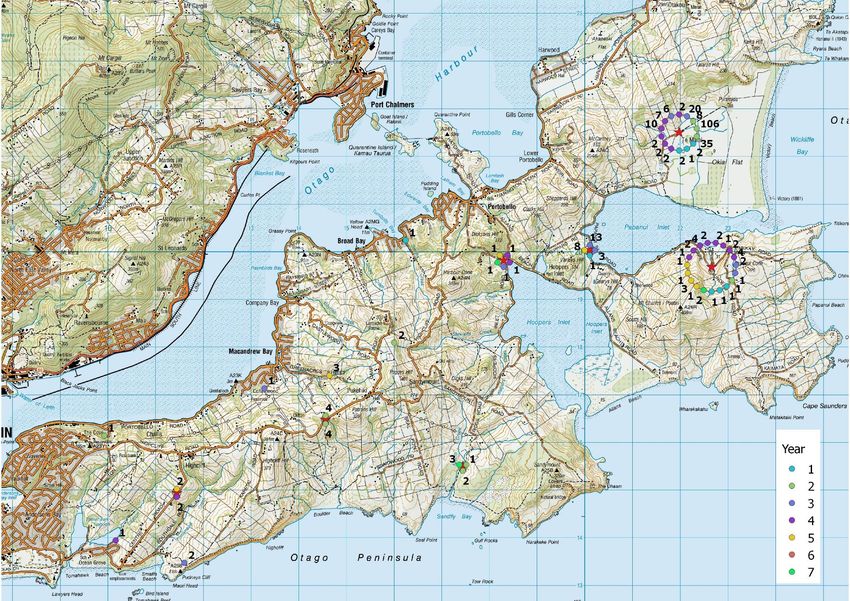
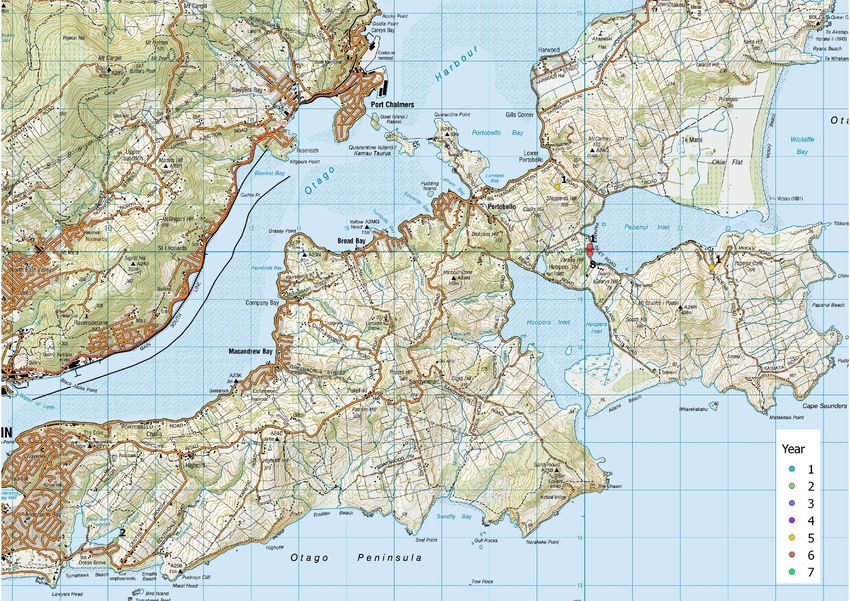
22

Appendix 5. Maps of ‘at risk’ species recorded

Maps of all observations of ‘at risk’ bird species are provided below. Observations are coloured differently for each year (see legend on each map) with the number
of individuals shown next to each observation point. Red stars show the location of the transect while the coloured dots represent the observations for each
transect.

Otago Peninsula slow walk transect bird monitoring                                                                                        www.ecosouth.co.nz
23

                                                          black shag

Otago Peninsula slow walk transect bird monitoring                www.ecosouth.co.nz
24
falcon
Otago Peninsula slow walk transect bird monitoring www.ecosouth.co.nz25
fernbird
Otago Peninsula slow walk transect bird monitoring www.ecosouth.co.nz26
pied oystercatcher
Otago Peninsula slow walk transect bird monitoring www.ecosouth.co.nz27
pipit
Otago Peninsula slow walk transect bird monitoring www.ecosouth.co.nz28
red-billed gull
Otago Peninsula slow walk transect bird monitoring www.ecosouth.co.nz29
spoonbill
Otago Peninsula slow walk transect bird monitoring www.ecosouth.co.nz30
variable oystercatcher
Otago Peninsula slow walk transect bird monitoring www.ecosouth.co.nzYou can also read