Convergent Evolution of Himalayan Marmot with Some High-Altitude Animals through ND3 Protein - MDPI
←
→
Page content transcription
If your browser does not render page correctly, please read the page content below
animals
Article
Convergent Evolution of Himalayan Marmot with Some
High-Altitude Animals through ND3 Protein
Ziqiang Bao, Cheng Li, Cheng Guo * and Zuofu Xiang *

                                          College of Life Science and Technology, Central South University of Forestry and Technology,
                                          Changsha 410004, China; bao_ziqiang@163.com (Z.B.); lslicheng@126.com (C.L.)
                                          * Correspondence: guocheng0310@csuft.edu.cn (C.G.); xiangzf@csuft.edu.cn (Z.X.);
                                            Tel.: +86-731-5623392 (C.G. & Z.X.); Fax: +86-731-5623498 (C.G. & Z.X.)

                                          Simple Summary: The Himalayan marmot (Marmota himalayana) lives on the Qinghai-Tibet Plateau
                                          and may display plateau-adapted traits similar to other high-altitude species according to the
                                          principle of convergent evolution. We assessed 20 species (marmot group (n = 11), plateau group
                                          (n = 8), and Himalayan marmot), and analyzed their sequence of CYTB gene, CYTB protein, and ND3
                                          protein. We found that the ND3 protein of Himalayan marmot plays an important role in adaptation
                                          to life on the plateau and would show a history of convergent evolution with other high-altitude
                                          animals at the molecular level.

                                          Abstract: The Himalayan marmot (Marmota himalayana) mainly lives on the Qinghai-Tibet Plateau
                                          and it adopts multiple strategies to adapt to high-altitude environments. According to the principle
                                          of convergent evolution as expressed in genes and traits, the Himalayan marmot might display
                                          similar changes to other local species at the molecular level. In this study, we obtained high-quality
                                          sequences of the CYTB gene, CYTB protein, ND3 gene, and ND3 protein of representative species
                                (n = 20) from NCBI, and divided them into the marmot group (n = 11), the plateau group (n = 8),

                                          and the Himalayan marmot (n = 1). To explore whether plateau species have convergent evolution
Citation: Bao, Z.; Li, C.; Guo, C.;       on the microscale level, we built a phylogenetic tree, calculated genetic distance, and analyzed
Xiang, Z. Convergent Evolution of
                                          the conservation and space structure of Himalayan marmot ND3 protein. The marmot group and
Himalayan Marmot with Some
                                          Himalayan marmots were in the same branch of the phylogenetic tree for the CYTB gene and CYTB
High-Altitude Animals through ND3
                                          protein, and mean genetic distance was 0.106 and 0.055, respectively, which was significantly lower
Protein. Animals 2021, 11, 251.
                                          than the plateau group. However, the plateau group and the Himalayan marmot were in the same
https://doi.org/10.3390/ani11020251
                                          branch of the phylogenetic tree, and the genetic distance was only 10% of the marmot group for the
Academic Editor: Zissis Mamuris           ND3 protein, except Marmota flaviventris. In addition, some sites of the ND3 amino acid sequence of
Received: 24 December 2020                Himalayan marmots were conserved from the plateau group, but not the marmot group. This could
Accepted: 16 January 2021                 lead to different structures and functional diversifications. These findings indicate that Himalayan
Published: 20 January 2021                marmots have adapted to the plateau environment partly through convergent evolution of the ND3
                                          protein with other plateau animals, however, this protein is not the only strategy to adapt to high
Publisher’s Note: MDPI stays neutral      altitudes, as there may have other methods to adapt to this environment.
with regard to jurisdictional claims in
published maps and institutional affil-   Keywords: convergent evolution; phylogenetic tree; genetic distances; Marmota himalayana; ND3
iations.

                                          1. Introduction
Copyright: © 2021 by the authors.              Convergent evolution describes a phenomenon where different species independently
Licensee MDPI, Basel, Switzerland.
                                          develop similar morphology, physiology, and behavior when they are living in similar en-
This article is an open access article
                                          vironments or under similar selective pressures [1,2]. For example, the yak (Bos mutus) and
distributed under the terms and
                                          Tibetan mastiff are both resistant to altitude sickness because they live on high plateaus [3,4].
conditions of the Creative Commons
                                          Since phenotypic traits are determined and regulated by genetic changes, genes will also
Attribution (CC BY) license (https://
                                          change to reflect environmental adaptation [2], meaning that microscale changes eventually
creativecommons.org/licenses/by/
                                          lead to ecological and morphological convergence.
4.0/).

Animals 2021, 11, 251. https://doi.org/10.3390/ani11020251                                                   https://www.mdpi.com/journal/animals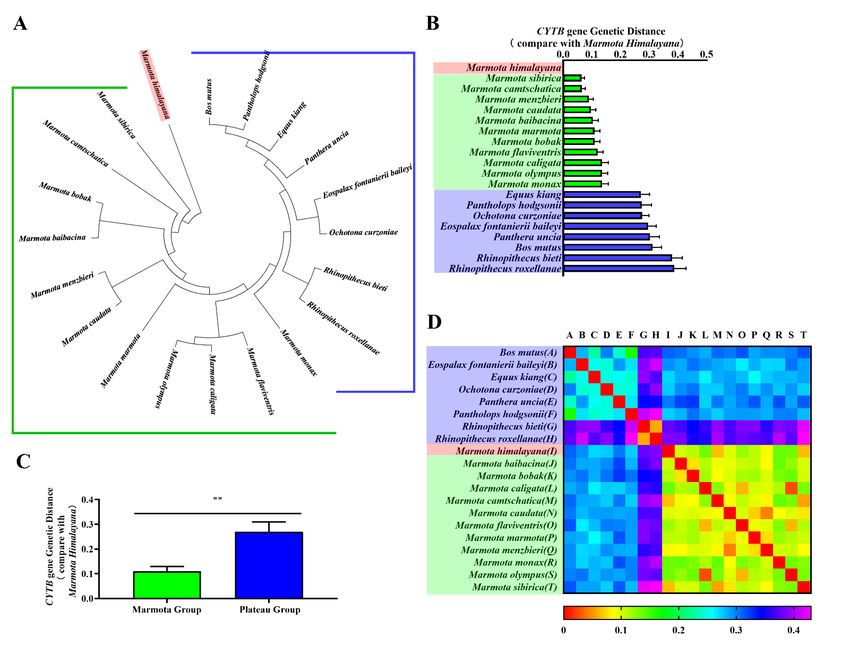
Animals 2021, 11, 251                                                                                             2 of 12

                             Himalayan marmots (Marmota himalayana) live between altitudes of 2900 and 5500 m
                        above sea level on the Qinghai-Tibet Plateau. This region is perennially cold, with low
                        atmospheric oxygen levels and constant exposure to strong ultraviolet radiation [5,6].
                        Adaptation to this extreme environment was facilitated by a series of genetic mutations in
                        the Himalayan marmot which produced advantageous physiological changes. Researchers
                        have found that the expression of the genes Slc25a14 and ψ Aamp differed when compared
                        with Himalayan marmots living at lower altitudes through genome analysis [7]. If living
                        at high altitudes drives convergent evolution, similar changes might be seen in other
                        local animals.
                             NADH (nicotinamide adenine dinucleotide hydride) dehydrogenase is an important
                        enzyme located on the inner membranes of mitochondria. It is involved in the NADH
                        oxidation respiration chain, mediating cyclic electron transfer from NADH to coenzyme
                        Q [8]. It plays a significant role in cell growth, differentiation, energy metabolism, and cell
                        protection. ND3 (NADH dehydrogenase III), one of the NADH dehydrogenase subunits,
                        also has a regulatory and protective effect in the oxidative respiration chain [9–11].
                             To explore whether plateau species have convergent evolution through the ND3
                        protein, the role of ND3 in energy metabolism and cellular respiration, and CYTB (cy-
                        tochrome b), frequently used to resolve relationships between species [12,13], we con-
                        structed a phylogenetic tree for selected animal species based on those sequences and
                        calculated genetic distances, paying particular attention to the ND3 protein in the Hi-
                        malayan marmot. Twenty species were used in the study to represent the variables of
                        living in a plateau environment (the plateau group) and relatedness to the focal marmot
                        species (the marmot group), as well as including the Himalayan marmots themselves.
                        The species forming the Qinghai-Tibet Plateau group included the yak (Bos mutus), the
                        plateau zokor (Eospalax fontanierii baileyi), the kiang (Equus kiang), the plateau pika (Ochotona
                        curzoniae), the snow leopard (Panthera uncia), the Tibetan antelope (Pantholops hodgsonii),
                        the Yunnan snub-nosed monkey (Rhinopithecus bieti), and the Sichuan snub-nosed mon-
                        key (Rhinopithecus roxellana). The marmot group included the gray marmot (Marmota
                        baibacina), the bobak marmot (Marmota bobak), the hoary marmot (Marmota caligata), the
                        black-capped marmot (Marmota camtschatica), the long-tailed marmot (Marmota caudata),
                        the yellow-bellied marmot (Marmota flaviventris), the alpine marmot (Marmota marmota),
                        Menzbier’s marmot (Marmota menzbieri), the groundhog (Marmota monax), the Olympic
                        marmot (Marmot olympus), and the Tarbigan marmot (Marmota sibirica). The Himalayan
                        marmot (Marmota himalayana) would be compared against both groups.
                             In this experiment, we hypothesized that the phylogenetic relationships of ND3 and
                        CYTB would differ between the two groups in reference to Himalayan marmots, and that
                        the ND3 protein of Himalayan marmots would show a history of convergent evolution at
                        the molecular level.

                        2. Materials and Methods
                        2.1. Species Geographic Distribution
                             In this study, the geographic distribution and elevation of each species is shown in
                        Figure 1A,C, and the twenty species under consideration were divided into the marmot
                        group (n = 11) and the plateau group (n = 8), with the Himalayan marmot analyzed in a
                        class by itself (Figure 1B). The members of the plateau group all live on the Qinghai-Tibet
                        Plateau [14–20]. In contrast, the marmot group is geographically diverse. The gray marmot,
                        bobak marmot, long-tailed marmot, and Menbzier’s marmot live in Central Asia [21–25].
                        The Tarbigan marmot lives across the Mongolian region [26,27]. The black-capped marmot
                        and the alpine marmot live in Europe, while the hoary marmot, the yellow-bellied marmot,
                        the Olympic marmot, and the groundhog are distributed across North America [28–35].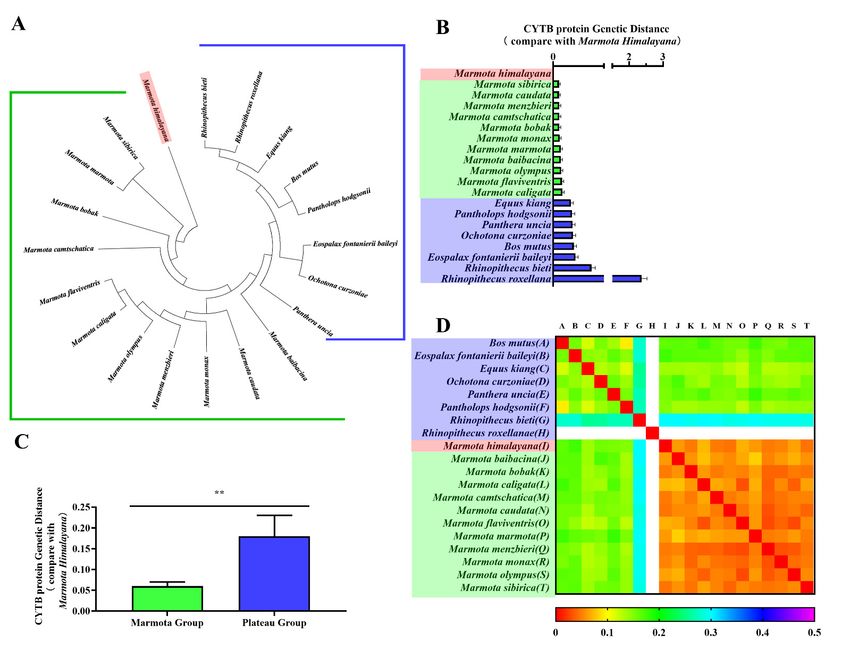
Animals
Animals 2021,
        2021, 11,
              11, x251
                    FOR PEER REVIEW                                                                                                  3 3ofof13
                                                                                                                                             12

     Figure 1. Relationship and geographic distribution of study species. The distribution of all study species is shown in map
     Figure 1. Relationship and geographic distribution of study species. The distribution of all study species is shown in map
     (A). The eleven members of the marmot group are highlighted in green, while the eight members of the plateau group are
     A. The eleven members of the marmot group are highlighted in green, while the eight members of the plateau group are
     highlightedin
     highlighted   in blue.
                      blue. The
                            Thefocal
                                 focalHimalayan
                                      Himalayanmarmot
                                                    marmotisisin inred.
                                                                    red. The
                                                                         Theanimals
                                                                              animalsof
                                                                                      ofthe
                                                                                         theplateau
                                                                                             plateaugroup
                                                                                                      group as
                                                                                                            as well
                                                                                                                well as
                                                                                                                     as the
                                                                                                                        the Himalayan
                                                                                                                            Himalayan
     marmot live
     marmot   live on
                   on the
                       the Qinghai-Tibet
                           Qinghai-Tibet Plateau
                                           Plateau(blue
                                                   (bluecircle).
                                                         circle).Venn
                                                                  Venngraph
                                                                         graph(B) shows this
                                                                                B shows this relationship,
                                                                                             relationship, while
                                                                                                           whilegraph
                                                                                                                 graph(C)   presentsthe
                                                                                                                         C presents  the
     elevations (with
     elevations  (with lower
                        lower elevation
                              elevation limit
                                         limit and
                                               and upper
                                                    upper elevation
                                                           elevation limit)
                                                                      limit) at which each species lives.

                                   2.2. Sequence Database
                                  2.2. Sequence Database
                                         All animal sequences of the CYTB gene, CYTB protein, ND3 gene, and ND3 protein
                                        All animal sequences of the CYTB gene, CYTB protein, ND3 gene, and ND3 protein
                                  were obtained from https://www.ncbi.nlm.nih.gov/nuccore/ and https://www.ncbi.nlm.
                                  were obtained from https://www.ncbi.nlm.nih.gov/nuccore/ and
                                   nih.gov/guide/proteins/ in the NCBI (National Center for Biotechnology Information)
                                  https://www.ncbi.nlm.nih.gov/guide/proteins/ in the NCBI (National Center for Biotech-
                                   database. Except for certain unpublished ND3 gene sequences, all others were downloaded
                                  nology Information) database. Except for certain unpublished ND3 gene sequences, all
                                   as FASTA files from NCBI (Table 1).
                                  others were downloaded as FASTA files from NCBI (Table 1).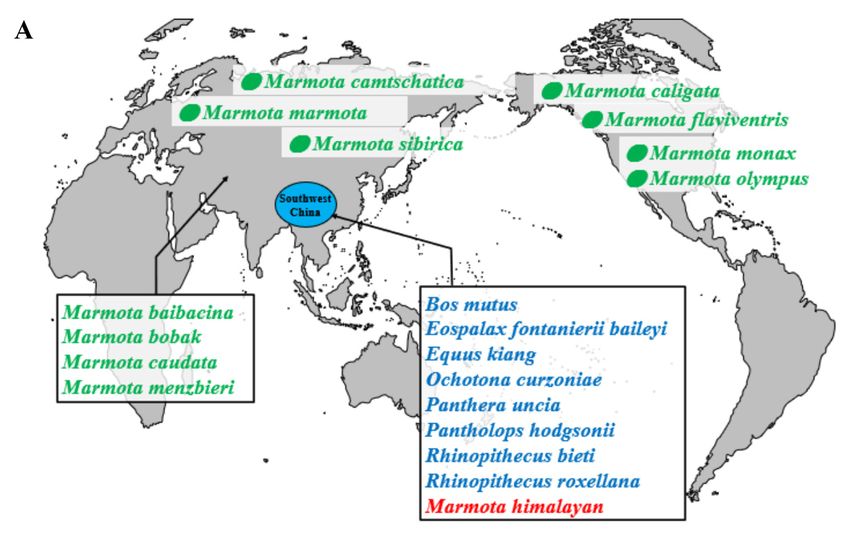
Animals 2021, 11, 251                                                                                                                     4 of 12

                                         Table 1. The Species and Accession Number of Cyt B and ND3.

                                                    Elevation     Classification                           Accession Number
         Species              Common Name
                                                     (meter)    Marmot     Plateau   Cyt B Protein   Cyt B Gene      ND3 Protein     ND3 Gene
        Bos mutus                 wild yak          3000–6000    No          Yes     AAX53006.1      KM280688.1       AKG95369.1     Unpublish
   Eospalax fontanierii
                                plateau zokor       2800–4300    No          Yes     ADU18101.1      GU339023.1     YP_006493403.1   Unpublish
          baileyi
       Equus kiang                   kiang          3600–5400    No          Yes     AEU10871.1       JF718885.1      AFQ41487.1     Unpublish
   Ochotona curzoniae            plateau pika       3100–5100    No          Yes     AAG00197.1      KM225712.1       ABP99054.1     Unpublish
     Panthera uncia              Uncia uncia        2500–5000    No          Yes     AKG95247.1      KF990331.1       ABP73333.1     Unpublish
   Pantholops hodgsonii        Tibetan antelope     3700–5500    No          Yes     AAC31679.1      AF034724.1       YP_337831.1    Unpublish
                              Black snub-nosed
    Rhinopithecus bieti                             2500–5000    No          Yes      ADI32831.1     AY232663.1       AAD08821.1     Unpublish
                                    monkey
                             Golden snub-nosed
  Rhinopithecus roxellana                           1500–3300    No          Yes      AIX11529.1     AF262360.1       AAD04665.1     Unpublish
                                    monkey
   Marmota himalayan         Himalayan marmot       2900–5500    Yes         Yes     ACT78394.1      GQ329722.1     YP_006576328.1   JF313281.1
    Marmota baibacina            Altai marmot         0        Yes         No      AAD45209.1      KJ458055.1      AEL87714.1      JF313275.1
   Marmota camtschatica     Black-capped marmot       2000      Yes         No      AAD29733.1      AF143927.1     YP_009632421.1   JF313280.1
    Marmota marmota             Alpine marmot       600–3200     Yes         No      AAD29736.1      AF143930.1      AEL87741.1      JF313284.1
    Marmota menzbieri        Menzbier’s marmot      2000–3400    Yes         No      AAD29738.1      AF143931.1      AEL87744.1      JF313285.1
     Marmota monax                Woodchuck          No data     Yes         No      AAD45210.1      AF100719.1      AEL87747.1      JF313286.1
    Marmota olympus           Olympic marmot          >1990      Yes         No      AEL87706.1      AF111182.1      AEL87752.1      JF313288.1
     Marmota sibirica        Mongolian marmot        0–3800      Yes         No      AAD29745.1      AF143937.1      AEL87758.1      JF313289.1

                                        2.3. Phylogenetic Analyses
                                            We adopted two methods of phylogenetic analysis in this study. First, we constructed
                                       phylogenetic trees [36] of the CYTB genes, CYTB proteins, and ND3 proteins using software
                                       MEGA7 (Molecular Genetics Analysis Version 7) (Arizona State University, Arizona State,
                                       AZ, USA) via the Maximum Likelihood method (ML). These phylogenetic trees were
                                       used to visualize the relationship between the marmot group, the plateau group, and the
                                       Himalayan marmot. Species found along the same branch had greater similarity, and
                                       presumably closer relationships, while species on divergent branches were farther apart.
                                       Then, we calculated the genetic distance (pairwise distances) of the above sequences using
                                       the Kimura 2-parameter distance (K2P) model [37,38]. Genetic distance is an important
                                       measure of the similarity between genetic sequences: larger values indicate more divergent
                                       sequences and vice versa [39]. All genetic distances were calculated in comparison to the
                                       Himalayan marmot, which was set to a reference value of zero.

                                        2.4. Consensus Sequence of ND3
                                            After phylogenetic analysis was complete, we inferred the consensus amino acid
                                       sequence of the ND3 protein via Jalview Version 2.1 (University of Dundee, Scotland,
                                       UK) [40]. The ND3 protein sequences of all twenty study species were imported into
                                       Jalview in FASTA format. Consensus sites appeared deep blue, while uncertain sequences
                                       were marked with lighter colors. The consensus of all groups is summarized below.
                                       Nonconsensus sites are indicated with red rectangles, and special amino acid sequences in
                                       Himalayan marmots that match the plateau group, but not the marmot group, are circled.

                                        2.5. Modelling ND3 Protein Tertiary Structure of Himalayan Marmot
                                            The three-dimensional structure of the Himalayan marmot ND3 protein was predicted
                                       by homologous modeling as follows: First, the amino acid sequence (FASTA format) of the
                                       Himalayan marmot ND3 was imported into the Swiss-Model website http://swissmodel.
                                       expasy.org/ [41]. Second, we manually selected highly homologous protein sequences
                                       to use as target template sequences to construct the three-dimensional structure (tertiary
                                       structure) of the ND3 protein. Finally, we comprehensively evaluated the accuracy of
                                       the target protein structure using the qualitative model energy analysis (QMEAN) value,
                                       pattern identity, z-score, and Ramachandran plots.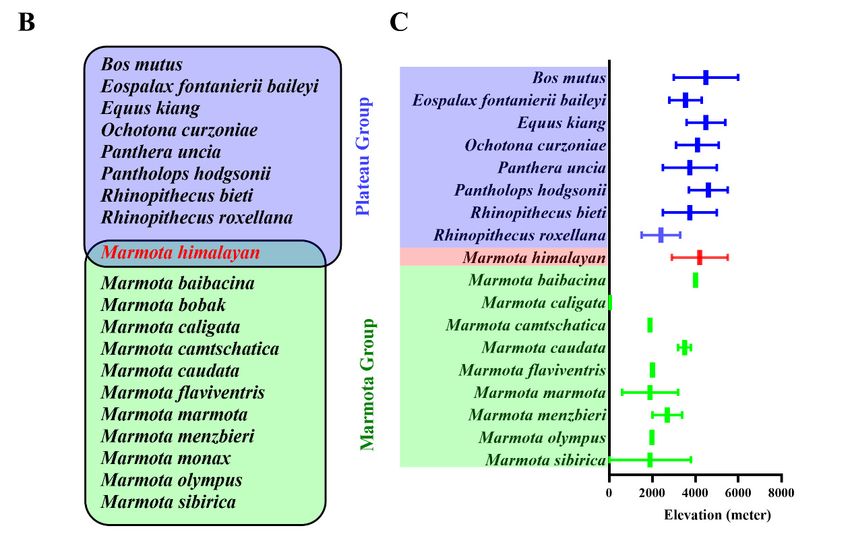
Animals 2021, 11, 251                                                                                                                                        5 of 12

                                        2.6. Statistical Analysis
                                             All significance analyses were calculated by means ± standard deviation, each datum
                                        of the group was set to three replicates. Statistical graph construction and one-way ANOVA
                                        were performed in Graphpad Prism 8 (GraphPad Software Inc., San Diego, CA, USA), and
                                        the significance threshold was set to p-value < 0.01. Graphpad Prism was also used to
                                        create heatmap plots of the CYTB gene, CYTB protein, and ND3 protein genetic distance,
                                        with red denoting high similarity.

                                        3. Results
                                        3.1. Relationship Analysis of CYTB Gene and CYTB Protein
                                                  CYTB is an important marker for classifying genetic relationships between species.
                                           Thus, we constructed phylogenetic trees of CYTB genes and CYTB proteins from all twenty
                                           species to verify evolutionary relationships. Phylogenetic tree branch-site analysis revealed
                                           that the Himalayan marmot occurred on the same branch as the marmot group, compared
                                           against the plateau group (Figures 2A and 3A). As expected, we also found Bos mutus and
                                           Pantholops hodgsonii in the same lineage, as well as Rhinopithecus bieti and Rhinopithecus
                                           roxellana. When the relationship was quantitatively analyzed using genetic distance, the
                                           results showed the CYTB gene and CYTB protein genetic distances of the marmot group
                                           were 0.064–0.136 and 0.045–0.072, respectively (Figures 2B and 3B, green bar), and for the
                                           plateau group the distances were 0.271–0.387 and 0.139–2.365 (Figures 2B and 3B, blue
                                           bar), 3–10 times greater. Statistical analysis showed that the distances to the marmot group
                                           were significantly smaller than the distances to the plateau group for both the CYTB gene
                                           sequence and the CYTB protein sequence (p < 0.01) (Figures 2C and 3C). The heatmaps
                    Animals 2021, 11, x FOR PEER REVIEW
                                           also showed that the Himalayan marmots are closely related to all the6 ofother  13
                                                                                                                               marmots
                                           (Figures 2D and 3D).

      Figure 2. Phylogenetic analyses of CYTB gene. Phylogenetic trees for the CYTB gene were constructed in MEGA (A). The
      genetic distanceFigure
                       from2.the   Himalayan
                                Phylogenetic       marmot
                                              analyses  of CYTBtogene.
                                                                   eachPhylogenetic
                                                                          member of     the
                                                                                    trees  formarmot     group
                                                                                              the CYTB gene   wereand   the plateau
                                                                                                                    constructed in MEGAgroup   are represented
                                                                                                                                          (A). The
      as a bar chart (B). One-way ANOVA showed a significant difference (** p < 0.01) between the groups (C). A heatmap
                      genetic distance from the Himalayan    marmot   to each member  of the marmot group   and  the plateau group are represented
                      as a bar chart (B). One-way ANOVA showed a significant difference (** p < 0.01) between the groups (C). A heatmap
      represents the correlation    coefficients of the CYTB gene genetic distance for all species (D).
                      represents the correlation coefficients of the CYTB gene genetic distance for all species (D).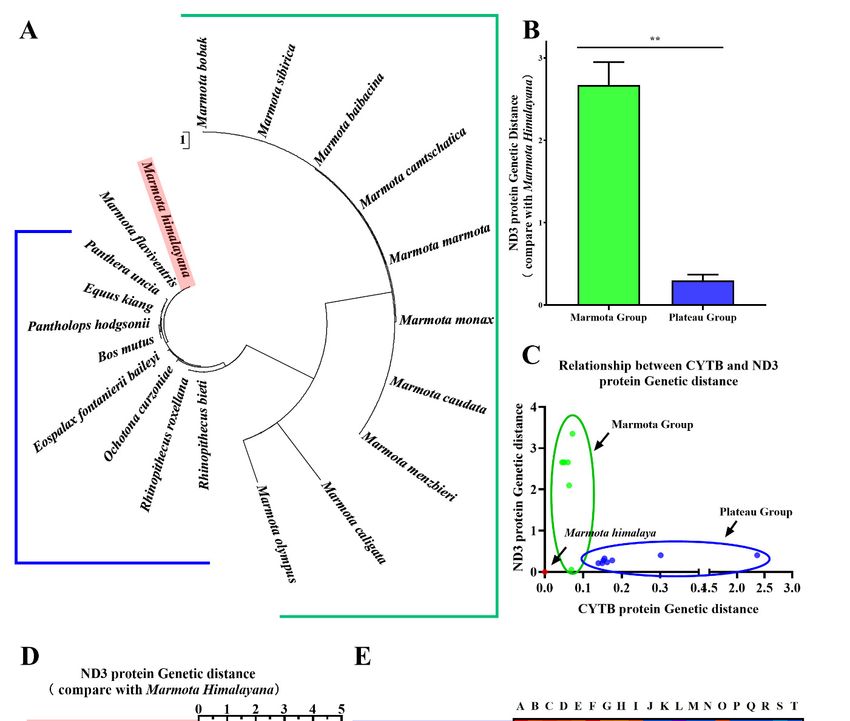
Animals 2021, 11, x FOR PEER REVIEW                                                                                        7 of 13
Animals 2021, 11, 251                                                                                                                                           6 of 12

      Figure 3. Phylogenetic analyses of CYTB protein. Phylogenetic trees for the CYTB protein were constructed in MEGA
                      Figure 3. Phylogenetic analyses of CYTB protein. Phylogenetic trees for the CYTB protein were constructed in MEGA (A).
      (A). The geneticThe
                        distance    from the
                          genetic distance   fromHimalayan
                                                  the Himalayan marmot
                                                                  marmot to to
                                                                            eacheach   member
                                                                                  member            of thegroup
                                                                                            of the marmot      marmot     group
                                                                                                                    and the plateauand  the
                                                                                                                                    group  areplateau
                                                                                                                                               repre- group are
      represented as sented
                      a bar as
                             chart    (B). One-way
                                a bar chart (B). One-wayANOVA
                                                          ANOVA showedshowed    a significant
                                                                           a significant differencedifference      (** p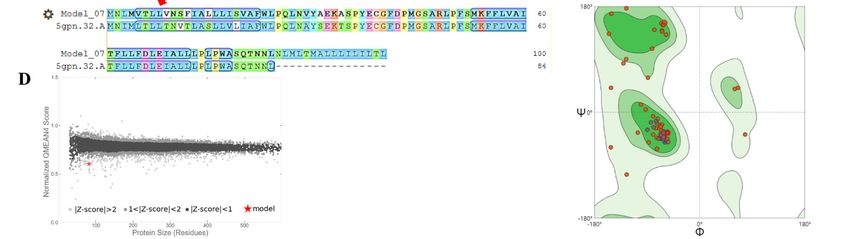
Animals 2021,Animals
              11, 2512021, 11, x FOR PEER REVIEW                                                                                         8 of 13   7 of 12

      Figure 4. Phylogenetic analyses of ND3 protein. Phylogenetic trees of ND3 protein were constructed in MEGA with the
                  Figure 4. Phylogenetic analyses of ND3 protein. Phylogenetic trees of ND3 protein were constructed in MEGA with the
      scale bar setscale
                     to 1bar
                           toset
                              measure     geneticgenetic
                                 to 1 to measure    distances (A).(A).
                                                         distances  One-way
                                                                       One-wayANOVA
                                                                                ANOVArevealed
                                                                                         revealed aasignificant
                                                                                                      significant   difference
                                                                                                                difference     between
                                                                                                                           between        the groups
                                                                                                                                   the groups
                  (p  < 0.01) (B). A  scatter plot shows the correlation between genetic distances calculated for CYTB   and
      (** p < 0.01) (B). A scatter plot shows the correlation between genetic distances calculated for CYTB and ND3 amino acidND3  amino  acid
                  sequences by species (C). Genetic distances of the marmot group and plateau group were plotted as a bar chart (D). A
      sequences by species (C). Genetic distances of the marmot group and plateau group were plotted as a bar chart (D). A
                  heatmap represents the correlation coefficients of ND3 protein genetic distance for all species (E).
      heatmap represents the correlation coefficients of ND3 protein genetic distance for all species (E).

                                      3.4. Modelling ND3 Protein Tertiary Structure of Himalayan Marmot
                                           The properties of a protein are determined by its shape, so to find the shape of ND3,
                                      we used the homology modeling method to construct its three-dimensional structure
                                      (Figure 6A). The modeling result was that the target-template alignment protein, 5gpn.32.A
                                      (from the pig, Sus scrofa), was 84.52% similar to the ND3 protein. In the covered main region
                                      (Figure 6B,C), the Z-score > 2 (Figure 6D), and the QMEAN value was −2.94 (Figure 6B).
                                      The thumbs-up icon next to the QMEAN score indicates the target-template was close
                                      enough to be used. In the Ramachandran plots, more than 90% of the red dots (amino acid
                                      residues) were distributed in the allowed areas (dark green) and the maximum allowable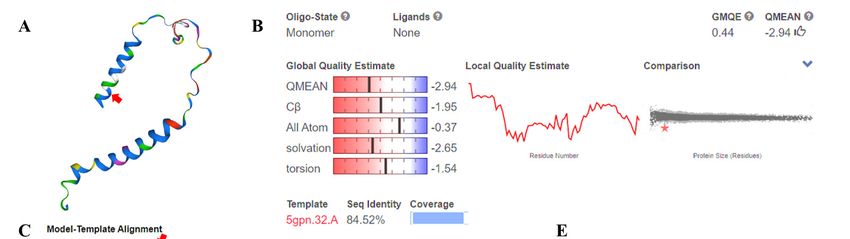
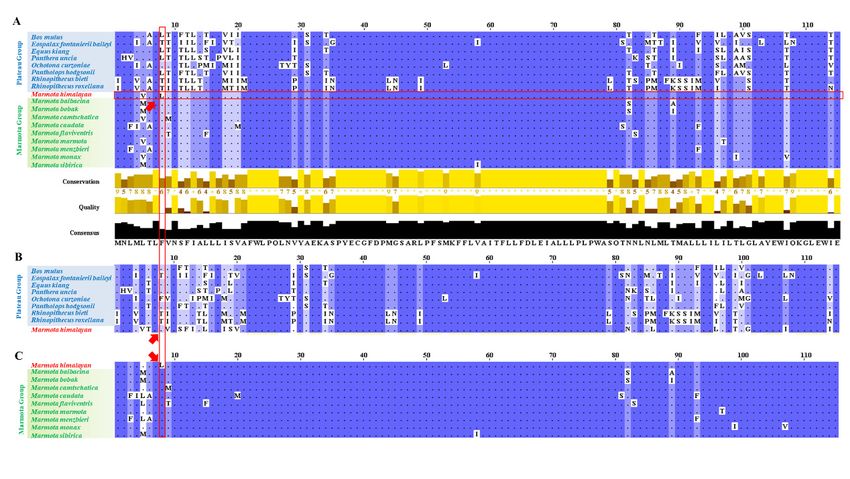
3.3. ND3 Protein Sequence Analysis
                                              To analyze the changes to the ND3 protein at the molecular level, we determined the
                                        conserved and nonconserved amino acid sequences of ND3 (the primary structure) (Fig-
Animals 2021, 11, 251                   ure 5A). The consensus of all species in the plateau group and the marmot group are re- 8 of 12
                                        ported in Figure 5B,C, respectively. The results show a number of conserved areas, but in
                                        the Himalayan marmot, the eighth amino acid in the sequence was L (leucine), similar to
                                        the plateau group, instead of the F (phenylalanine) found in that position in the marmot
                                        group.
                                      areas     Wegreen)
                                            (light  infer that this site
                                                           (Figure   6E).may
                                                                          Thisbesuggests
                                                                                 associated with
                                                                                          that theconvergent evolution
                                                                                                   dihedral-angles     in a high-alti-
                                                                                                                    ψ and   ϕ of the amino
                                        tude  environment.
                                      acid residues were in a reasonable area, conforming to the rules of stereochemistry.

      Figure 5. Nonconserved residues of ND3 amino acid sequence. The nonconserved ND3 amino acid sequence for all species
      (A), the plateau group (B), and the marmot group (C) were aligned in Jalview. The capital letters follow the standard
             Figure 5. Nonconserved residues of ND3 amino acid sequence. The nonconserved ND3 amino acid sequence for all species
      notation
             (A),for
         Animals  theamino
                  2021,         acids.
                         11, x FOR
                      plateau      PEER
                                 group Dark
                                        REVIEW
                                        (B),  bluethe
                                              and   areas  are highly
                                                       marmot    group conserved,   whileinthe
                                                                        (C) were aligned        light blue
                                                                                            Jalview.       and white
                                                                                                      The capital       points
                                                                                                                  letters followrepresent  divergent
                                                                                                                                  the standard10 of 13
      sequences.    The
             notation   fornonconserved      amino
                             amino acids. Dark   blueacid
                                                      areassite
                                                             arein the Himalayan
                                                                 highly             marmot
                                                                        conserved, while     is marked
                                                                                         the light       by white
                                                                                                   blue and a red points
                                                                                                                   rectangle,   withdivergent
                                                                                                                           represent  the amino acid
      for thesequences.
               Himalayan   Themarmot
                                nonconserved
                                         itself amino
                                                marked acid
                                                         bysite
                                                              redinarrows.
                                                                    the Himalayan marmot is marked by a red rectangle, with the amino acid
            for the Himalayan marmot itself marked by red arrows.

                                          3.4. Modelling ND3 Protein Tertiary Structure of Himalayan Marmot
                                               The properties of a protein are determined by its shape, so to find the shape of ND3,
                                          we used the homology modeling method to construct its three-dimensional structure (Fig-
                                          ure 6A). The modeling result was that the target-template alignment protein, 5gpn.32.A
                                          (from the pig, Sus scrofa), was 84.52% similar to the ND3 protein. In the covered main
                                          region (Figure 6B,C), the Z-score > 2 (Figure 6D), and the QMEAN value was −2.94 (Figure
                                          6B). The thumbs-up icon next to the QMEAN score indicates the target-template was close
                                          enough to be used. In the Ramachandran plots, more than 90% of the red dots (amino acid
                                          residues) were distributed in the allowed areas (dark green) and the maximum allowable
                                          areas (light green) (Figure 6E). This suggests that the dihedral-angles ψ and φ of the amino
                                          acid residues were in a reasonable area, conforming to the rules of stereochemistry.

      Figure 6. Modelling results and evaluations of ND3 protein tertiary structure of Himalayan marmot. Using the Swiss-Model
      website,Figure  6. Modelling
               we obtained          results
                              the ND3        and evaluations
                                         protein                of ND3 for
                                                   tertiary structure    protein tertiary structure
                                                                            the Himalayan     marmot of Himalayan  marmot. Using
                                                                                                         (A). The accuracy  of the the Swiss-
                                                                                                                                   target protein
              Model website, we obtained the ND3 protein tertiary structure for the Himalayan marmot (A). The accuracy of the target
      structure is evaluated   using    QMEAN,      sequence     identity  (B), target-template     sequence   alignment  (C),  Z-score
              protein structure is evaluated using QMEAN, sequence identity (B), target-template sequence alignment (C), Z-score (D),
                                                                                                                                         (D), and
      Ramachandran      plots (E).  ψ  and  ϕ  are dihedral   angle   of acid  residues.   The  eighth  amino   acid in the sequence
              and Ramachandran plots (E). ψ and φ are dihedral angle of acid residues. The eighth amino acid in the sequence is marked is marked
              with
      with a red   a red arrow,
                 arrow,   and theand
                                   redthe redmeans
                                        star  star means   the location
                                                      the location      of 5gqpn.32.A(model)
                                                                     of 5gqpn.32.A      (model)inin Z-score.
                                                                                                    Z-score.

                                            4. Discussion
                                                The study confirmed that the Himalayan marmot is more closely related to the mar-
                                            mot group than the plateau group according to the CYTB gene sequence and the CYTB
                                            amino acid sequence. In contrast, for ND3, which may be related to adapting to life at high
Animals 2021, 11, 251                                                                                           9 of 12

                        4. Discussion
                              The study confirmed that the Himalayan marmot is more closely related to the marmot
                        group than the plateau group according to the CYTB gene sequence and the CYTB amino
                        acid sequence. In contrast, for ND3, which may be related to adapting to life at high
                        altitudes, the sequences observed in the Himalayan marmot were closer to other animals
                        from the Qinghai-Tibet Plateau, with genetic distances only 10% of that observed for the rest
                        of the marmot group (except Marmota flaviventris). The scatter diagrams and heatmaps of
                        ND3 and CYTB distances also reinforced these relationships. Further investigation revealed
                        that the Himalayan marmot ND3 protein contained both conserved and nonconserved
                        sequences and that the change in the eighth amino acid (from F to L) may change the
                        protein’s tertiary structure. Taken together, these results suggest that the ND3 protein plays
                        a vital role in adapting to high altitudes, and that it is an example of convergent evolution
                        in animals living on the Qinghai-Tibet Plateau.
                              CYTB (cytochrome b) is the electron transfer in the mitochondrial membrane; the role
                        of CYTB is to complete the reversal of the reduction state (Fe2+ ) and the oxidation state
                        (Fe3+ ) of iron [42,43]. It is commonly used to measure the genetic relatedness between
                        species. For instance, Guan et al. used CYTB as a marker to measure the relationships
                        among goats (Capra hircus) [44]. In this study, we found that Himalayan marmots were
                        significantly more closely grouped with other marmot species than any other animals
                        living on the Qinghai-Tibet Plateau. The same methodology also grouped Bos mutus with
                        Pantholops hodgsonii and Rhinopithecus bieti with Rhinopithecus roxellana, which is expected,
                        given that the first two species belong to the family Bovidae [18] and the second two are
                        both species of Chinese snub-nosed monkey [45]. This is consistent with the use of CYTB
                        as a genetic marker to measure the relatedness of species.
                              To adapt to similar environmental stressors, animals may independently develop
                        similar evolutionary strategies involving morphological, physiological, and behavioral
                        changes—convergent evolution. On the Qinghai-Tibet Plateau, the metabolic role of
                        the ND3 protein in the oxidative respiration chain could be relevant to animals like the
                        Himalayan marmot adapting to low-oxygen conditions [8–11]. Accordingly, the ND3
                        sequences were more similar among the nine plateau animals. Interestingly, the yellow-
                        bellied marmot also showed some of the changes in ND3 observed in the Himalayan mar-
                        mot, with a genetic distance value lower than the plateau group (genetic distance = 0.052).
                        The two species could live in similar environments, as the yellow-bellied marmot is known
                        to live at high altitudes in the western United States and southwestern Canada [46,47],
                        raising the possibility of parallel evolution.
                              To assess how the Himalayan marmot ND3 protein changed in response to the envi-
                        ronment of the Qinghai-Tibet Plateau, we compared the amino acid sequences between
                        the two groups and found many nonconserved sequences. The eighth amino acid in the
                        Himalayan marmot ND3 sequence was leucine, similar to members of the plateau group,
                        but not the marmot group (phenylalanine-typical). Phenylalanine is encoded by the codons
                        UUU and UUC, whereas leucine is encoded as UUA, UUG, CUU, CUC, CUA, and CUG,
                        meaning that there are several point mutations that can produce this change. A switch
                        from phenylalanine to leucine will lead to changes in proteins from the primary structure
                        to the tertiary structure. Through homologous modeling, we found that ND3 structure
                        of Himalayan marmots was similar to the pig (Sus scrofa) protein sequence 5gPN.32.A
                        (sequence similarity 84.52%), which may be related to the amount of energy required for
                        domestic pigs’ muscle growth and fat metabolism [48]. This provides a theoretical basis for
                        investigating another potentials function and effect of ND3.
                              In conclusion, Himalayan marmots are an example of convergent evolution in their
                        adaptation to life on the Qinghai-Tibet Plateau. One such adaptation may be related to the
                        ND3 protein, which has been restructured at the molecular level relative to other marmots.
Animals 2021, 11, 251 10 of 12
Author Contributions: Z.B.: Data Curation (equal); Formal analysis (lead); Methodology (equal);
Visualization equal (equal); Writing—Original Draft Preparation (equal). C.L.: Data Curation (equal);
Methodology (equal); Visualization equal (equal); Writing—Original Draft Preparation (equal). C.G.:
Conceptualization (equal); Supervision (equal); Project Administration (equal); Writing—Review &
Editing (equal). Z.X.: Conceptualization (equal); Funding Acquisition (lead); Project Administration
(equal); Resources (lead); Supervision (equal); Writing—Review & Editing (equal). All authors have
read and agreed to the published version of the manuscript.
Funding: This study was supported by the National Natural Science Foundation of China 30180509
and the State Forestry and Grassland Administration Bureau of China.
Institutional Review Board Statement: All procedures performed in studies involving human
participants were in accordance with the ethical standards of the institutional and/or national
research committee and with the Helsinki declaration and its later amendments or comparable ethical
standards. The study protocol was approved approved by Central South University of Forestry and
Technology’s Institutional Animal Care and Use Committee (protocol no. 2012-018).
Data Availability Statement: The raw/processed data required to reproduce these findings cannot
be shared at this time as the data also forms part of an ongoing study.
Acknowledgments: We are very grateful to the staff of agriculture, livestock, and water supplies
bureau of Ruoergai county.
Conflicts of Interest: The authors declare no conflict of interests.
References
1. Stern, D.L. The Genetic Causes of Convergent Evolution. Nat. Rev. Genet. 2013, 14, 751–764. [CrossRef] [PubMed]
2. Cerna Bolfikova, B.; Evin, A.; Rozkošná Knitlová, M.; Loudová, M.; Sztencel-Jabłonka, A.; Bogdanowicz, W.; Hulva, P. 3D
Geometric Morphometrics Reveals Convergent Character Displacement in the Central European Contact Zone between Two
Species of Hedgehogs (Genus Erinaceus). Animals 2020, 10, 1803. [CrossRef] [PubMed]
3. Grant, P.R. Convergent Evolution of Darwin’s Finches caused by Introgressive Hybridization and Selection. Evolution 2004, 58,
1588–1599. [CrossRef] [PubMed]
4. Losos, J.B. Convergence, Adaptation, and Constraint. Evolution 2011, 65, 1827–1840. [CrossRef]
5. Aryal, A. Habitat, Diet, Macronutrient, and Fiber Balance of Himalayan Marmot in Nepal. J. Mammal. 2015, 96, 308–316.
[CrossRef]
6. Guo, C.; Gao, S.; Zhou, S.; Zhang, L.; Xiang, Z. Burrowing and Anti-predator Requirements Determine the Microhabitat Selection
of Himalayan Marmot in Zoige Wetland. Zool. Sci. 2020, 37, 554–562. [CrossRef]
7. Bai, L. Hypoxic and Cold Adaptation Insights from the Himalayan Marmot Genome. iScience 2019, 11, 519–530. [CrossRef]
8. Anderson, K.A.; Madsen, A.S.; Olsen, C.A.; Hirschey, M.D. Metabolic Control by Sirtuins and other Enzymes that sense NAD(+),
NADH, or their ratio. Biochim. Biophys. Acta 2017, 1858, 991–998. [CrossRef]
9. Jin, E.-H. Mitochondrial NADH Dehydrogenase Subunit 3 (MTND3) Polymorphisms are Associated with Gastric Cancer
Susceptibility. Int. J. Med. Sci. 2018, 15, 1329–1333. [CrossRef]
10. Ternes, C.M.; Schonknecht, G. Gene Transfers Shaped the Evolution of de novo NAD+ Biosynthesis in Eukaryotes. Genome Biol.
Evol. 2014, 6, 2335–2349. [CrossRef]
11. McFadden, C.S. Variation in Coding (NADH Dehydrogenase Subunits 2, 3, and 6) and Noncoding Intergenic Spacer Regions of
the Mitochondrial Genome in Octocorallia (Cnidaria: Anthozoa). Mar. Biotechnol. 2002, 6, 516–526. [CrossRef] [PubMed]
12. Jin, Y.; Wo, Y.; Tong, H.; Song, S.; Zhang, L.; Brown, R.P. Evolutionary Analysis of Mitochondrially Encoded Proteins of
Toad-headed Lizards, Phrynocephalus, along an Altitudinal gradient. BMC Genom. 2018, 19, 185. [CrossRef] [PubMed]
13. Fan, H.; Zhao, F.; Zhu, C.; Li, F.; Liu, J.; Zhang, L.; Wei, C.; Du, L. Complete Mitochondrial Genome Sequences of Chinese
Indigenous Sheep with Different Tail Types and an Analysis of Phylogenetic Evolution in Domestic Sheep. Asian-Australas J.
Anim. Sci. 2016, 29, 631–639. [CrossRef] [PubMed]
14. Qi, W.-H. Genome-Wide Survey and Analysis of Microsatellite Sequences in Bovid Species. PLoS ONE 2015, 10, e0133667.
[CrossRef] [PubMed]
15. Su, J. Function- related Drivers of Skull Morphometric Variation and Sexual Size Dimorphism in a Subterranean Rodent, Plateau
Zokor (Eospalax baileyi). Ecol. Evol. 2018, 8, 4631–4643. [CrossRef]
16. Bhatnagar, Y.V. Perceived Conflicts between Pastoralism and Conservation of the Kiang Equus Kiang in the Ladakh Trans-
Himalaya, India. Env. Manag. 2006, 38, 934–941. [CrossRef]
17. Zhou, Y. Impact of Plateau Pikas (Ochotona curzoniae) on Soil Properties and Nitrous Oxide Fluxes on the Qinghai-Tibetan Plateau.
PLoS ONE 2018, 13, e0203691. [CrossRef]
18. Luo, Y. Puppet Resting Behavior in the Tibetan Antelope (Pantholops hodgsonii). PLoS ONE 2018, 13, e0204379. [CrossRef]Animals 2021, 11, 251 11 of 12
19. Zhang, Y.J.; Chen, Y.X.; Chen, H.C.; Chen, Y.; Yao, H.; Yang, W.J.; Ruan, X.D.; Xiang, Z.F. Social Functions of relaxed Open-mouth
Display in Golden Snub-nosed Monkeys (Rhinopithecus roxellana). Zool. Res. 2019, 40, 113–120.
20. Shrestha, T. Marmota himalayana, Karakoram Marmot. In The IUCN Red List of Threatened Species; 2016; Available online:
http://dx.doi.org/10.2305/IUCN.UK.2016-3.RLTS.T12826A22258911.en (accessed on 24 November 2020).
21. Zaman, M. Increased Flight Initiation Distance (FID) in Golden Marmots (Marmota caudata aurea) Responding to Domestic Dogs
in A Landscape of Human Disturbance. Animals 2019, 9, 605. [CrossRef]
22. Tsytsulina, K. Marmota bobak, Bobak Marmot. In The IUCN Red List of Threatened Species; 2016; Available online: http://dx.doi.org/
10.2305/IUCN.UK.2016-3.RLTS.T12830A22258375.en (accessed on 24 November 2020).
23. Batbold, J.; Batsaikhan, N.; Shar, S. Marmota Baibacina, Altai Marmot. In The IUCN Red List of Threatened Species; 2016; Available
online: http://dx.doi.org/10.2305/IUCN.UK.20163.RLTS.T12829A22258206.en (accessed on 24 November 2020).
24. Cassola, F. Marmota Caudata, Long-Tailed Marmot. In The IUCN Red List of Threatened Species; 2017; Available online: http:
//dx.doi.org/10.2305/IUCN.UK.2017-2.RLTS.T12825A111931601.en (accessed on 24 November 2020).
25. Tsytsulina, K. Marmota Menzbieri, Menzbier’s Marmot. In The IUCN Red List of Threatened Species; 2008; Available online:
http://dx.doi.org/10.2305/IUCN.UK.2008.RLTS.T12827A3386921.en (accessed on 24 November 2020).
26. Sun, Y. Ornithodoros (Ornithodoros) huajianensis sp. nov. (Acari, argasidae), a new tick species from the Mongolian marmot
(Marmota bobak sibirica), Gansu province in China. Int. J. Parasitol. Parasites Wildl. 2019, 9, 209–217. [CrossRef] [PubMed]
27. Clayton, E. Marmota sibirica, Mongolian Marmot. In The IUCN Red List of Threatened Species; 2016; Available online: http:
//dx.doi.org/10.2305/IUCN.UK.2016-2.RLTS.T12832A22258643.en (accessed on 24 November 2020).
28. Kyle, C.J.; Karels, T.J.; Clark, B.; Strobeck, C.; Hik, D.S.; Davis, C.S. Isolation and Characterization of Microsatellite markers in
Hoary Marmots (Marmota caligata). Mol. Ecol. Notes 2004, 4, 749–751. [CrossRef]
29. Maher, C.R.; Duron, M. Mating system and Paternity in Woodchucks (Marmota monax). J. Mammal. 2010, 91, 628–635. [CrossRef]
30. Blumstein, D.T.; Chung, L.K.; Smith, J.E. Early play may predict later Dominance Relationships in Yellow-Bellied Marmots
(Marmota flaviventris). Proc. R. Soc. B Biol. Sci. 2013, 280, 20130485. [CrossRef] [PubMed]
31. Cassola, F. Marmota Camtschatica, Black-capped Marmot. In The IUCN Red List of Threatened Species; 2016; Available online:
http://dx.doi.org/10.2305/IUCN.UK.2016-3.RLTS.T12831A22258500.en (accessed on 24 November 2020).
32. Cassola, F. Marmota Marmota, Alpine Marmot. In The IUCN Red List of Threatened Species; 2016; Available online: http:
//dx.doi.org/10.2305/IUCN.UK.2016-2.RLTS.T12835A510082.en (accessed on 24 November 2020).
33. Cassola, F. Marmota Flaviventris, Yellow-bellied Marmot. In The IUCN Red List of Threatened Species; 2016; Available online:
http://dx.doi.org/10.2305/IUCN.UK.2016-3.RLTS.T42457A22257543.en (accessed on 24 November 2020).
34. Cassola, F. Marmota Olympus, Olympic Marmot. In The IUCN Red List of Threatened Species; 2016; Available online: http:
//dx.doi.org/10.2305/IUCN.UK.2016-2.RLTS.T42459A22257452.en (accessed on 24 November 2020).
35. Cassola, F. Marmota Monax, Woodchuck. In The IUCN Red List of Threatened Species; 2016; Available online: http://dx.doi.org/10
.2305/IUCN.UK.2016-3.RLTS.T42458A22257685.en (accessed on 24 November 2020).
36. Hu, Y.; Wu, Q.; Ma, S.; Ma, T.; Shan, L.; Wang, X.; Nie, Y.; Ning, Z.; Yan, L.; Xiu, Y.; et al. Comparative Genomics Reveals
Convergent Evolution between the Bamboo-eating Giant and Red Pandas. Proc. Natl. Acad. Sci. USA 2017, 114, 1081–1086.
[CrossRef]
37. Dumaidi, K. Genetic Diversity of the Enteroviruses detected from Cerebrospinal Fluid (CSF) samples of patients with suspected
aseptic Meningitis in northern West Bank, Palestine in 2017. PLoS ONE 2018, 13, e0202243. [CrossRef]
38. Sastre, N.; Francino, O.; Curti, J.N.; Armenta, T.C.; Fraser, D.L.; Kelly, R.M.; Hunt, E.; Silbermayr, K.; Zewe, C.; Sánchez, A.; et al.
Detection, Prevalence and Phylogenetic Relationships of Demodex Spp and further Skin Prostigmata Mites (Acari, Arachnida) in
Wild and Domestic Mammals. PLoS ONE 2016, 11, e0165765. [CrossRef]
39. Whalen, K.E.; Starczak, V.R.; Nelson, D.R.; Goldstone, J.V.; Hahn, M.E. Cytochrome P450 diversity and induction by Gorgonian
Allelochemicals in the Marine Gastropod Cyphoma gibbosum. BMC Ecol. 2010, 10, 24. [CrossRef]
40. Lamichhaney, S.; Berglund, J.; Almén, M.S.; Maqbool, K.; Grabherr, M.; Martinez-Barrio, A.; Promerová, M.; Rubin, C.-J.; Wang,
C.; Zamani, N.; et al. Evolution of Darwin’s Finches and Their Beaks Revealed by Genome Sequencing. Nature 2015, 518, 371–375.
[CrossRef]
41. Bordoli, L. Protein Structure Homology modeling using SWISS-MODEL workspace. Nat. Protoc. 2009, 4, 1. [CrossRef]
42. Shen, Y.Y.; Liang, L.; Zhu, Z.H.; Zhou, W.P.; Irwin, D.M.; Zhang, Y.P. Adaptive Evolution of Energy Metabolism Genes and the
origin of flight in Bats. Proc. Natl. Acad. Sci. USA 2010, 107, 8666–8671. [CrossRef] [PubMed]
43. Wang, B.-J. Establishing a New Animal Model for Hepadnaviral infection: Susceptibility of Chinese Marmotaspecies to Wood-
chuck Hepatitis Virus Infection. J. Gen. Virol. 2011, 92, 681–691. [CrossRef] [PubMed]
44. Guan, D. Scanning of selection signature provides a glimpse into important economic traits in Goats (Capra hircus). Sci. Rep. 2016,
6, 36372. [CrossRef]
45. Xiang, Z.; Yang, W.; Qi, X.; Yao, H.; Grueter, C.C.; Garber, P.A.; Li, B.; Li, M. An examination of factors potentially influencing
birth distributions in Golden Snub-nosed Monkeys (Rhinopithecus roxellana). PeerJ 2017, 5, e2892. [CrossRef]
46. Schwartz, O.A.; Armitage, K.B. Weather influences on emography of the Yellow-bellied Marmot (Marmota flaviventris). J. Zool.
2005, 265, 73–79.
47. Van Vuren, D.H. Predation on Yellow-bellied Marmots (Marmota flaviventris). Am. Midl. Nat. 2001, 145, 94–100. [CrossRef]Animals 2021, 11, 251 12 of 12
48. Renaville, B. Association of Single Nucleotide Polymorphisms in Fat Metabolism Candidate Genes with fatty acid profiles of
Muscle and Subcutaneous Fat in heavy Pigs. Meat Sci. 2018, 139, 220–227. [CrossRef]You can also read