Meta-analysis on the effect of competition between lynx and wolf on their diets - A literature study G. Lelieveld Wageningen, 2013
←
→
Page content transcription
If your browser does not render page correctly, please read the page content below
Meta-analysis on the effect of competition between lynx and
wolf on their diets
A literature study

G. Lelieveld

Wageningen, 2013
Meta-analysis on the effect of competition between lynx and
wolf on their diets
A literature study
Glenn Lelieveld 18 March 2013
Part of:
MSc Ecology, VU University, Amsterdam.
Supervised by:
Peter van Bodegom, senior lecturer sub-department ‘System Ecology’, Faculty of Earth and Life Sciences (FALW), Vrije
Universiteit, De Boelelaan 1085, 1081HV Amsterdam, 020-5986964, p.m.van.bodegom@vu.nl.
Wieger Wamelink, senior researcher team ’Biodiversity & Policy Alterra, Wageningen UR, Droevendaalsesteeg 3, 6708
PB Wageningen, 0317-485917, wieger.wamelink@wur.nl
Performed at:
Team ‘Biodiversity & Policy Alterra, Wageningen UR, Droevendaalsesteeg 3, 6708 PB Wageningen.
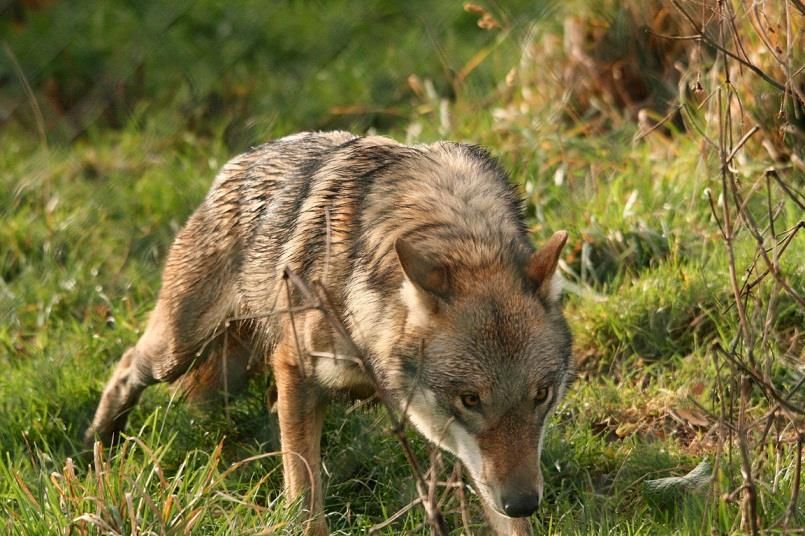
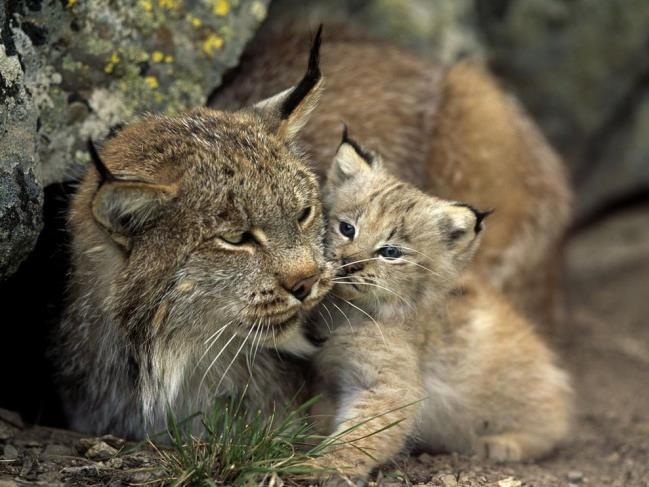
Pictures cover:
Lynx Norbert Rosing, http://animals.nationalgeographic.com/wallpaper/animals/photos/baby-
animals/baby-lynx/
Wolf Roeland Vermeulen, FREE Nature
Roe deer André van der Meulen, http://natuurfoto.wordpress.com/2009/05/24/libellenjacht/
Red deer Ed van Zoonen, http://www.edvanzoonen.nl/edelhert.htm
Abstract
Behavioural interactions between predators, herbivores and vegetation have a major impact on ecosystem
composition and ecosystem functioning. Changes in these interactions may lead to changes in ecosystem
composition and even trigger a trophic cascade as not only predation affects the ecosystem, but is also
affected by changes in foraging behaviour of herbivores based on the threat of predation. However, many
factors can influence trophic cascades. First, through controlling a mesopredator with a common food
source, top predators can affect herbivore species. Second, different predators preying on the same prey
species exerts a different demographic impact on the prey species. Third, the complexity of the food web
and changes in bioclimatic effects on ecosystem productivity and anthropogenic habitat change can also
explain sudden changes in prey densities and the ecosystem.
Up to now, it is unknown how the re-establishments of lynx and wolf will affect differences in trophic
interactions in Europe. Studies on prey-predator relations between ungulates and large predator such as
lynx and wolf were carried out mostly in single-prey systems in North America and Scandinavia. However,
the ungulate community of the European mainland is different. Therefore, the research question of this
study was ‘What is the influence of competition between lynx and wolf on their diets in temperate and
continental regions of Europe?’. Based on the biology of both species, lynx being a stalking specialist and
wolf being a coursing generalist, it was expected that lynx outcompetes wolf in the predation on roe deer.
Consequently, wolves will have to broaden their niche breadth.
Only studies executed in the mainland of Europe of the last 30 years that contained data on the total diet of
either lynx or wolf were used. For each study site the niche breadth was calculated and were then analysed
using the permutational multivariate analysis of variance (perMANOVA) and Wald’s chi square test. Here,
the presence of the other predator was used as independent and the dependants were the variance in
mean niche breadth and proportions of each prey species in the diet of each species.
Results of this study show that the diet of lynx is affected by the presence of wolves as the lynx diet
significantly changed by presence of wolves for roe deer, wild boar, Leporidae and bird species. While the
proportion of roe deer is highest in areas without wolves, the proportion of Leporidae species in the diet of
lynx shows a contrasting effect. The niche breadth of the diet of wolf is not significantly affected by the
presence of lynx. However, the mean proportion red deer in the wolf diet is highest in areas with lynx, but
this effect was not significant. The permutational multivariate analysis of variance showed no overall
significant change in diets of lynx and wolf.
Because of limited availability of data and selection criteria, the limited number of study sites has serious
implications on the statistical power in this research. Also, the actual availability of prey species could not
be taken into account as this was not investigated in most studies. Still, this research showed that lynx
seems to change their foraging behaviour because of the presence of wolves, whereas wolves do not
change. As both lynx and wolves are in top of their food chain and there seems to be a form of interaction,
one can argue that the relation between lynx and wolf is therefore more complex than merely being two
top predators in the same community. Therefore, I expect that not only the bioclimatic conditions
determine the strength of a trophic cascade, but also the type of top predator and in case of an apical
predator, the presence of other top predators.
Contents
1     Introduction ......................................................................................................................... 5
2     Methods ............................................................................................................................... 8
    2.1     Study area .......................................................................................................................................... 8
    2.2     Data collection ................................................................................................................................... 8
    2.3     Data quality ....................................................................................................................................... 9
    2.4     Data preparation ................................................................................................................................ 9
    2.5     Data analysis .................................................................................................................................... 10

3     Results ................................................................................................................................ 11
    3.1     Lynx diet shifts ................................................................................................................................ 11
    3.2     Wolf diet shifts ................................................................................................................................ 12

4     Discussion........................................................................................................................... 13
5     Conclusion.......................................................................................................................... 15
References ................................................................................................................................. 16
Appendix I ................................................................................................................................... I
Appendix II ................................................................................................................................. II
Appendix III .............................................................................................................................. III
Appendix IV...............................................................................................................................IV
Appendix V .................................................................................................................................V
Appendix VI...............................................................................................................................VI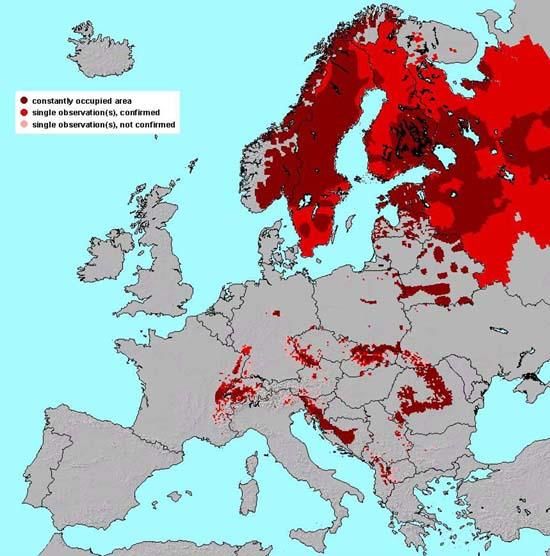
1        Introduction
Behavioural interactions between predators, herbivores and vegetation have a major impact on ecosystem
composition and ecosystem functioning (Beschta & Ripple 2010; Iercek et al. 2010; Kauffman et al. 2010;
Ripple & Beschta 2012b; White et al. 2010). Changes in these interactions, for example due to extinction or
recolonization, may lead to changes in ecosystem composition and even trigger a trophic cascade (Steffan
& Snyder 2010). The original concept of a trophic cascade, also known as the Green World hypothesis,
encompasses that predators reduce the abundance of herbivores, allowing plants to flourish (Hairston et al.
1960). At first this concept was argued to be solely allocated to marine and aquatic systems as these are
communities with fast-growing producers which lack defences against herbivory (Strong 1992). However,
several studies following the reintroduction of wolves (Canis lupus) in Yellowstone National Park (YNP) in
1995 and 1996, showed that trophic cascades may also apply to terrestrial systems (Beschta & Ripple 2009,
2012). In the National Park, elk (Cervus elaphus) were not only affected by predation, but were also
affected by the threat of predation (Berger et al. 2001). Coping with the predation risk costs energy, as the
elk is more alert, has less foraging time and loses energy while escaping a wolf hunt. Predation, the
decrease of energy uptake and increased costs all result in a decreased reproduction, see figure 1.

Figure 1 Flow diagram of predator–prey encounters for wolves and elk in Yellowstone National Park (YNP) since 1926 (Ripple &
Beschta 2004)

In addition, elk avoided potentially high-risk sites with limited opportunities for prey to see approaching
wolves or with terrain features that could impede the escape of prey (Ripple & Beschta 2004). At these
sites, willow (Salix spp.) and cottonwood (Populus angustifolia and Populus balsamifera) were released
from the browsing pressure and increased in height, cover and density. This in turn led to an increase of
songbird, bison (Bison bison) and beaver (Castor Canadensis) populations (Painter & Ripple 2012). The
increased willow and cottonwood populations and as result, increased beaver populations reduced widths
of active channels via slower bank, floodplain and terrace erosion. It also decreased the area of

                                                             5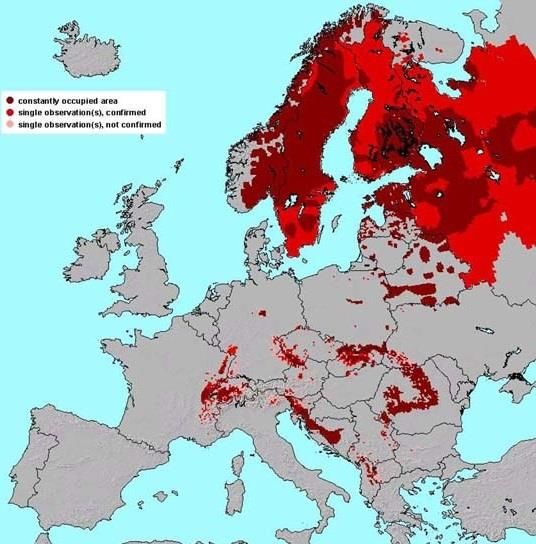
unvegetated alluvium, decreased channel incision and decreased braiding. A conceptual visualisation of the
wolf-induced trophic cascade in the Yellowstone National Park is shown below in figure 2.

Figure 2 Trophic interactions due to predation risk and selected ecosystem responses to (a) wolf extirpation (1926–1995) and (b)
wolf recovery (post-1995) for northern ecosystems of Yellowstone National Park. Solid arrows indicate documented responses;
dashed arrows indicate predicted or inferred responses. (Ripple & Beschta 2004)

Besides, through effects on herbivore species, cascading effects can also take place via a mesopredator
species. One effect that Ripple et al. (2011) hypothesised is that the presence of one top-predator
positively influences the survival of another top predator by controlling a mesopredator with a common
food source. For example, a decrease of pressure by wolves (top predator) on coyotes (Canis latrans,
mesopredator) may have affected lynx (Lynx lynx, top predator) as coyotes increased their predation
pressure on snowshoe hares (Lepus americanus). Recolonizing wolves may control the coyote population
and in doing so alter the survival of hares and lynx (Ripple et al. 2011). Such a case is known from Finland.
Here they identified a relation between top predator (lynx), mesopredator (red fox (Vulpes vulpes)) and
prey (mountain hare (Lepus timidus)) abundance (Elmhagen et al. 2010). In this study, fox biomass was
lower than could be expected from hare density in areas where lynx was abundant, whilst hare were
scarcer than could be expected from primary productivity where fox was abundant and lynx was scarce
(Elmhagen et al. 2010). Also, in a multi-predator community, different predators preying on the same prey
species exerts a different demographic impact on the prey species, even in the same ecological context, as
a direct consequence of their differences in predation patterns (Gervasi et al. 2012).
In addition to trophic cascades, additional changes in bioclimatic effects on ecosystem productivity and
anthropogenic habitat change can explain sudden increases in prey densities (Elmhagen & Rushton 2007).
Elmhagen & Rushton (2007) showed a positive feedback of the mesopredator to declines in top predator
abundance, although ecosystem productivity determined the strength of the trophic cascade. Another
factor influencing the strength of the effects of the trophic cascade is the complexity of the food web. In a
coastal marsh community, it was shown that having a higher predator diversity dampens the effects on

                                                               6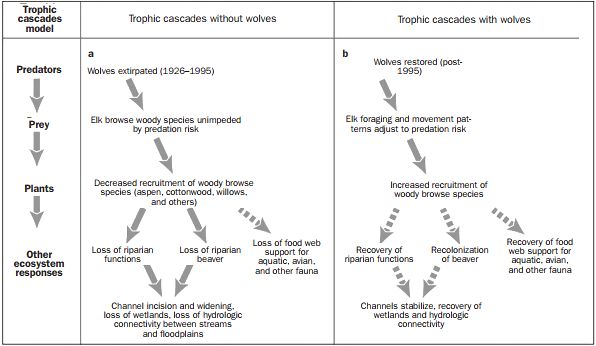
herbivores and weakens the trophic cascade (Finke & Denno 2004). Consequently, changes in diversity at
higher trophic levels can significantly alter ecosystem function in natural systems (Finke & Denno 2004).

In time, effects of the multiple top-predator induced trophic cascades may become visible throughout
Europe now that the European top predators, lynx and wolf are recolonizing parts of Europe. For example,
lynx and wolf are at the verge to re-establish populations in the Benelux. Previous studies show that at least
parts of the Netherlands have suitable habitat for lynx (Groot Bruinderink 1997) and wolf populations
(Lelieveld 2012; Potiek et al. 2012).
Up to now, it is unknown how the re-establishments of lynx and wolf will affect differences in trophic
interactions in Europe, especially in a densely populated area as the Netherlands. Studies on prey-predator
relations between ungulates and large predator such as lynx and wolf were carried out mostly in single-
prey systems in North America and Scandinavia. However, the ungulate community of the European
mainland is different from North America and Scandinavia, which restrains comparison with other
European studies (Fritts & Mech 1981; Gasaway et al. 1992; Gasaway et al. 1983; Messier 1991; Okarma
1995). Roe deer (Capreolus carpeolus) and wild boar (Sus scrofa) piglets are dominant in the diets of both
lynx and wolf in the West and Central European region, whereas in other parts of the Northern hemisphere
their mainly consist of reindeer (Rangifer tarandus) and moose/Eurasian elk (Alces alces). Reindeer and
moose are both absent in other parts of Western Europe, including the Netherlands (Wagner et al. 2012;
Wikenros et al. 2010).
This literature research therefore aims to gather data on changes in diet by interactions between lynx and
wolf in European landscapes with special interest in the possibilities in the Netherlands. There is no
evidence that wolf and lynx predate on each other (Schmidt et al. 2009), nor is there proof that habitat use
changes (May et al. 2008; Wikenros et al. 2010). In other words, there is no direct effect of one of the
species on the other. Indirect effects via competition over prey have not been done so far, although diets of
lynx and wolf show large overlap in European landscapes, both having roe deer as main prey species
(Wikenros et al. 2010). As both species have large home ranges and tend to avoid people, lynx and wolves
are complex species to investigate (Galaverni et al. 2012; Samelius et al. 2012). However, diets of lynx and
wolf show overlap in European landscapes, both having roe deer as main prey species (Wikenros et al.
2010). This overlap can cause indirect competition, which can have a large impact on the landscape via
diverse cascading effects.
Therefore, the research question of this study was ‘What is the influence of competition between lynx and
wolf on their diets in temperate and continental regions of Europe?’. Theoretically, based on the biology of
both species, lynx being a stalking specialist and wolf being a coursing generalist, it is possible that lynx
outcompetes wolf in the predation on roe deer. As a consequence wolves will have to broaden their niche
breadth, or in other words be more versatile in their diet (Colwell & Futuyma 1971). Possibly, wolves
change their diet to a more red deer and wild boar dominated one. I will test the following hypotheses:
  1. The presence of wolves has no influence on the diet of lynx.
  2. The proportion of roe deer in the diet of wolves is larger in areas without lynx than in areas with lynx.
  3. The niche breadth of the diet of wolf is significantly influenced by the presence of lynx.
These hypotheses will be tested using meta-analysis techniques to sum up overall effects based on the
results from different studies.

                                                      7
2 Methods
2.1 Study area
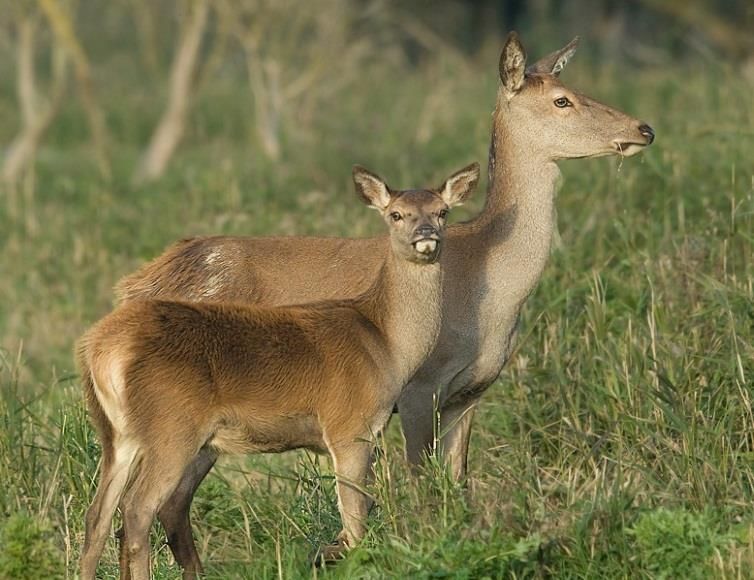
In Europe, the current distribution of lynx and wolf populations is concentrated in Northeastern European
countries, the Alps, the Dinaric Mountains and the Iberian Peninsula (see figure 3-4).
Figure 3 Distribution of constantly occupied lynx (Lynx lynx) Figure 4 Estimated present distribution and future expansion of
areas and lynx observations in Europe. Dark red are the wolves (Canis lupus) in Europe. Grey dots represent sightings of
constantly occupied areas, red areas have confirmed single roaming wolves. Yellow dots represent lone wolf territories.
observations. Larger picture and explanation is provided in Orange dots represent wolf pairs. Red dots represent wolf
Appendix II. (Arx et al. 2004) packs. Numbers in the red circles indicate the number of packs
in that region. The solid arrows indicate the current direction of
expansion. The dotted arrows indicate expected expansion. The
red mash layer indicates distant, yet permanent, wolf
populations. Larger picture and explanation is provided in
Appendix I. (Natuurmonumenten 2012)
Datasets used in this study were limited to studies executed in the mainland of Europe, since these areas
are supposed to be similar to each other and unique with respect to prey-predator interactions in
comparison to Scandinavia and North America. This makes the study area comparable with the
Netherlands.
The European mainland features a prey community consisting of red deer (Cervus elaphus), roe deer, wild
boar, and different middle-sized mammals like brown hare (Lepus europaeus). Areas that are more
mountainous generally also feature chamois (Rupicapra rupicapra). Instead, the Scandinavian prey
community features moose (Alces alces), roe deer, red deer and reindeer (Rangifer tarandus). Both wild
and semi-domestic reindeer are important prey for both lynx and wolf (Basille et al. 2009; May et al. 2008;
Pedersen et al. 1999).
2.2 Data collection
Lynx and wolf diets within the study area were analysed using all available literature of the last 30 years.
Articles were only included if they contained data on the proportion of the ungulate species and medium-
sized mammals like hares in the diet of wolf, lynx or both. However, incomplete datasets may be useful for
later model parameterization and were therefore collected as well. The data collection was considered
complete when at least five articles in a row give neither new data nor references to available data using
8the search engines and keywords listed below. In this study, model-based data was not used. All data was
stored in a Microsoft Excel dataset.
During a quick scan of available literature, I came across several related articles. With these articles, I
started my research. The list of the articles is mentioned in Appendix III.
For additional information, I searched for reviews or specific articles using in order of importance:
Search engines: Scopus (Web of Science) / JSTOR, Wageningen UR Library (also http://
library.wur.nl/desktop/direct/), Vrije Universiteit Library, Google Scholar.
Keywords: Canis lupus, wolf, Lynx lynx, lynx, diet, feeding behaviour, predation, competition,
food abundance, prey abundance, Capreolus capreolus, roe deer, Cervus elaphus,
red deer, Dama dama, fallow deer, Sus scrofa, wild boar, Lepus europaeus, hare,
Ovis musimon, moufflon, Rupicapra rupicapra, chamois.
2.3 Data quality
Meta-analyses can have two disadvantages that can impede the data quality. The first problem is whether
unpublished studies are included to avoid publication bias (file drawer problem). It is not possible to know
how many studies have been conducted and never reported. This type of problem can seriously bias the
results of any meta-analysis. To prevent this from happening, I tried to get to unpublished datasets by
correspondence with authors who refer in their article to the dataset, but did not publish them.
Unfortunately, this was not successful.
The second problem has to do with the quality of the original studies, as a good meta-analysis of badly
designed studies will still result in unusable results. This can be the case when small datasets are compared
to large datasets. Smaller datasets can be more prone to abnormalities and generally, but statistical
analysis can generally deal with this. However, as this study deals with proportional data of community
composition and composition of prey, this study only used datasets with at least 100 scat samples per
dataset to ensure data quality. In addition, this study aimed to give insight in the competition of lynx and
wolf over prey in natural systems. Therefore, diet datasets that have a proportion 10% or more of domestic
animals or a proportion 10% or more of unidentified species in them were excluded from analysis. After
data collection, 11 studies with 21 unique locations were processed into a database. A detailed overview of
the processed studies and the used sites is provided in Appendix III.
2.4 Data preparation
To investigate the differences in diet among the study sites, all datasets were put into a new dataset with
one specific format, suitable for analysis in SPSS20 (see Appendix IV for the format of the dataset). In case a
study had multiple study sites, the dataset was split into data per site. In case a site had multiple study
periods, these were accumulated into one dataset per site. In some studies, it was necessary to transform
the data into fractions of the total diet. After these preparations, the niche breadth (Levins 1968) was
calculated with the following formula:
∑
Where B = Levin’s measure of niche breadth
= The proportion of individuals per species found in the diet
Next, the data was put into SPSS20, grouped (see Appendix IV) and put into R (version 2.15, package
‘vegan’) for further analysis.
92.5 Data analysis
The groups for lynx and wolf studies were separately analysed on variance in total diet using a
permutational multivariate analysis of variance (perMANOVA), where the presence of the other predator
was used as independent. Syntax code of the perMANOVA can be found in Appendix V. In addition, the
relative contributions of prey species to the variance in total diet were studied using R. To investigate
whether these contributions of prey species were significantly different, I used the Wald’s statistics in SPSS.
Here, the presence of the other predator was used as independent and the dependants were the variance
in mean niche breadth and proportions of each prey species in the diet of each species.
The used studies regarding wolf diet in areas where lynx is present had a large proportion of unidentified
cervids. For a more meaningful comparison with areas where there are no lynx, I corrected the abundance
of roe deer, red deer and fallow deer for the unidentified cervids while respecting the proportional ratio
between the species with the simple equation: (CervidN / (Cervid∑N + unidentified cervids)) / all cervids.
103 Results
3.1 Lynx diet shifts
When testing whether the diet of lynx is affected by the presence of wolves, the permutational multivariate
analysis of variance showed no overall significant change in diet (N = 6, F = 2.03, df = 1, p = 0.147).
However, when analysed for the relative contributions of prey species, it shows that roe deer, wild boar
and Leporidae contribute most to the between-group variance. Species proportions in the lynx diet
significantly changed by presence of wolves for roe deer (N = 6, χ² = 8.3, df = 1, p = 0.004), wild boar (N = 6,
χ² = 12.8, df = 1, p = 0.000), Leporidae (N = 6, χ² = 8.3, df = 1, p = 0.004) and bird species (N = 6, χ² = 32.6, df
= 1, p = 0.000). Figure 5 shows that all ungulate species, except for roe deer, seem of minor importance to
the lynx when looking at the mean proportion of these species in the lynx diet. While the proportion of roe
deer is highest in areas without wolves (61.5% versus 27.8%), the proportion of Leporidae species in the
diet of lynx shows a contrasting effect as the proportion of Leporidae is on average only 3.3% in areas
without wolves and 20.7% in areas with wolves. These changes resulted in a significant difference at the
level of total ungulate (N = 6, χ² = 8.2, df = 1, p = 0.004) and total medium sized mammals (N = 6, χ² = 5.7, df
= 1, p = 0.017) species groups, and a near significant effect of the presence of wolves on the niche breadth
of lynx (N = 6, χ² = 3.6, df = 1, p = 0.058). The diet of lynx is furthermore complemented by other medium
sized and small mammals, birds and plant material. More detailed statistical results of the occurrence of
prey species in the diet of lynx is supplemented in Appendix VI.
80
Frequency of occurernce in lynx scats
70
***
60
50
40 ***
30
20 Wolf absent (N = 4)
10 Wolf present (N = 2)
*** ***
0
Figure 5 Frequency of occurrence of prey species in lynx scats were significant different (* =3.2 Wolf diet shifts
When testing whether the diet of wolf is affected by the presence of lynx, the permutational multivariate
analysis of variance showed no significant effect (F = 1.00, df = 1, p = 0.39). Relative contributions of prey
species to the between-group variance was dominated by red deer. There was no significant effect of the
presence of lynx on the niche breadth of wolves (N = 9, χ² = 0.7, df = 1, p = 0.400). In the uncorrected
analysis, red deer proportion was significantly different (N = 9, χ² = 4.2, df = 1, p = 0.041) between areas
with and without lynx, as well as small mammals (N = 9, χ² = 5.9, df = 1, p = 0.015) and birds (N = 9, χ² = 7.0,
df = 1, p = 0.008). Still, wolf diet is dominated by roe deer, red deer and wild boar. When corrected for the
large proportion of unidentified cervids, figure 6 shows that the mean proportion red deer in the wolf diet
is higher in areas with lynx (32.5% versus 20.3% in areas without lynx) . More detailed statistical results of
the occurrence of prey species in diet of wolf is supplemented in Appendix VI.
80
Frequency of occurence in wolf scats
70
60
50
40
30
Lynx absent (N = 7)
20
* Lynx present (N = 2)
10
0
Species occuring in the studied wolf scats
Figure 6 Frequency of occurrence of prey species in wolf scats corrected for unidentified cervids. Proportions were significant
different (* =4 Discussion
In this research, the limited number of study sites (N = 15) I used has serious implications on strength of the
conclusions. First reason for the limited number of studies is simply the limited availability of data. To draw
conclusions that still have meaning for the Netherlands required a first selection of studies based on the
geographical location. However, lynx and wolves are not present in all of the study area and are difficult
species to study, and even in a vast region as central Europe, diet studies on lynx and wolf are limited. To
increase the number of used studies, one can increase the larger geographical range by grouping species
from the entire Northern Hemisphere into species groups. The lynx-predator group would then not only
contain the European lynx (Lynx lynx), but also the threatened Iberian lynx (Lynx pardinus), Canadian lynx
(Lynx canadensis) and the bobcat (Lynx rufus). More importantly, prey species can then be grouped in size,
evasiveness, abundance and risk classes, allowing study on trade-offs between the prey selection factors in
areas with one or more top predators.
In the database, studies were selected based on two criteria. The first criterion was that each study site had
to have studied at least 100 scats so that the retrieved data had as minimum deviation as possible of
stochastic deviations. The second criterion was that no studies with 10% or more domestic animals in the
scats were used as this study investigated the natural diet of lynx and wolf. There is a trade-off between
using more study sites or holding on to only using the most relevant study sites. In this study, the focus was
on the relevance of the study site. However, if all the study sites were used, the statistical power would
have been greater.
Unfortunately, the actual availability of prey species could not be taken into account as this was not
investigated in most studies. When comparing the prey availability and diet proportions at the same time,
prey selectivity can be investigated by using selection coefficients (Ivlev 1961). These derived selection
coefficients can help to give an in-depth understanding of what factors influence prey selectivity instead of
using prey occurrence in the diet alone.
Populations grow exponentially until a limiting factor dampens the increase into a, potentially dynamic,
optimum. For both lynx and wolf it follows that only when the availability of prey is a limiting factor,
competition over prey affects the population dynamics. Although previous studies show the two species do
not compete on a spatial scale (Schmidt et al. 2009; Wikenros et al. 2010), home ranges can be a function
of prey density (Jedrzejewski et al. 2007; Nowak et al. 2008). In the diets of lynx and wolf at 15 independent
study sites over the mainland of Europe, lynx seems to change their foraging behaviour because of the
presence of wolves, whereas wolves do not change.
As both lynx and wolves are in top of their food chain and there seems to be a form of interaction, one can
argue that the relation between lynx and wolf is therefore more complex than merely being two top
predators in the same community. Lynx is a top predator, but at the same time, its diet is affected by the
presence of wolf. Definitions in the literature of top predator include ‘relatively large vertebrates that
regularly feed on other vertebrates’ (Sergio et al. 2008) and ‘species on which nothing else in the [food] web
feeds’(Pimm et al. 1991). Naturally, both definitions are correct when describing lynx and wolf, but this
does not take the relation between the two species into consideration. In literature, this is described as
follows: ‘The apical predator is the top predator that holds the maximum trophic position, and therefore
resides at the apex of the food web. Within any one food web, there can be many top predators, but there
can be only one apical predator.’ (Post & Takimoto 2007).
Following the results of this study, I consider the wolf as apical predator and I believe that this difference
between lynx and wolf might affect the level of impact each top predator can have on the ecosystem. I
expect that recolonization of lynx will trigger only small effects on its environment, whereas recolonization
of wolves has a larger impact on the environment, especially in areas where it also influences the behaviour
13of another top predator. In other words, I expect that not only the bioclimatic conditions determine the
strength of a trophic cascade, but also the type of top predator and in case of an apical predator, the
presence of other top predators.
145 Conclusion
In this study, I tested if there are significant effects of the presence of lynx or wolves on the diet of the
other top predator based on the following hypotheses:
- The presence of wolves has no influence on the diet of lynx
- The proportion of roe deer in the diet of wolves is larger in areas without lynx than in areas with lynx
- The niche breadth of the diet of wolf is significantly influenced by the presence of lynx
It seems that roe deer is the most preferred prey species of lynx and one of the most preferred prey species
of wolves. Additionally, results of this study show that when the roe deer population is under pressure of
lynx and wolf predation, lynx change their diet by hunting more wild boar, hares, rabbits and birds, whereas
the diet of wolves does not significantly change. I therefore conclude that my three hypotheses are not
correct, as wolves seem to influence the diet of lynx and are not influenced by lynx.
Based on this study, I conclude that there is interaction between lynx and wolf and that this may diversify
the effects these predators have when recolonizing to new areas, especially in areas where the other top
predator is already present.
15References
Arx, M. v., C. Breitenmoser-Würsten, F. Zimmermann, and U. Breitenmoser. 2004. Status and conservation
of the Eurasian lynx (Lynx lynx) in Europe in 2001. KORA.
Barja, I. 2009. Prey and prey-age preference by the Iberian wolf Canis lupus signatus in a multiple-prey
ecosystem. Wildlife Biology 15:147-154.
Basille, M., I. Herfindal, H. Santin-Janin, J. D. C. Linnell, J. Odden, R. Andersen, K. A. Hogda, and J. M.
Gaillard. 2009. What shapes Eurasian lynx distribution in human dominated landscapes: selecting
prey or avoiding people? Ecography 32:683-691.
Berger, J., J. E. Swenson, and I. L. Persson. 2001. Recolonizing carnivores and naive prey: Conservation
lessons from Pleistocene extinctions. Science 291:1036-1039.
Beschta, R. L., and W. J. Ripple. 2009. Large predators and trophic cascades in terrestrial ecosystems of the
western United States. Biological Conservation 142:2401-2414.
Beschta, R. L., and W. J. Ripple. 2010. Recovering Riparian Plant Communities with Wolves in Northern
Yellowstone, USA. Restoration Ecology 18:380-389.
Beschta, R. L., and W. J. Ripple. 2012. The role of large predators in maintaining riparian plant communities
and river morphology. Geomorphology 157:88-98.
Colwell, R. K., and D. J. Futuyma. 1971. Measurement of Niche Breadth and Overlap. Ecology 52:567-&.
Elmhagen, B., G. Ludwig, S. P. Rushton, P. Helle, and H. Linden. 2010. Top predators, mesopredators and
their prey: interference ecosystems along bioclimatic productivity gradients. Journal of Animal
Ecology 79:785-794.
Elmhagen, B., and S. P. Rushton. 2007. Trophic control of mesopredators in terrestrial ecosystems: top-
down or bottom-up? Ecology Letters 10:197-206.
Finke, D. L., and R. F. Denno. 2004. Predator diversity dampens trophic cascades. Nature 429:407-410.
Fritts, S. H., and L. D. Mech. 1981. Dynamics, Movements, and Feeding Ecology of a Newly Protected Wolf
Population in Northwestern Minnesota. Wildlife Monographs:6-79.
Galaverni, M., D. Palumbo, E. Fabbri, R. Caniglia, C. Greco, and E. Randi. 2012. Monitoring wolves (Canis
lupus) by non-invasive genetics and camera trapping: a small-scale pilot study. European Journal of
Wildlife Research 58:47-58.
Gasaway, W. C., R. D. Boertje, D. V. Grangaard, D. G. Kelleyhouse, R. O. Stephenson, and D. G. Larsen. 1992.
The Role of Predation in Limiting Moose at Low-Densities in Alaska and Yukon and Implications for
Conservation. Wildlife Monographs:1-59.
Gasaway, W. C., R. O. Stephenson, J. L. Davis, P. E. K. Shepherd, and O. E. Burris. 1983. Interrelationships of
Wolves, Prey, and Man in Interior Alaska. Wildlife Monographs:1-50.
Gervasi, V., E. B. Nilsen, H. Sand, M. Panzacchi, G. R. Rauset, H. C. Pedersen, J. Kindberg, P. Wabakken, B.
Zimmermann, J. Odden, O. Liberg, J. E. Swenson, and J. D. C. Linnell. 2012. Predicting the potential
demographic impact of predators on their prey: a comparative analysis of two carnivore–ungulate
systems in Scandinavia. Journal of Animal Ecology 81:443-454.
Gorini, L., J. D. C. Linnell, R. May, M. Panzacchi, L. Boitani, M. Odden, and E. B. Nilsen. 2012. Habitat
heterogeneity and mammalian predator-prey interactions. Mammal Review 42:55-77.
Groot Bruinderink, C. W. T. A. 1997. De Veluwe niet lynx laten liggen: een beschouwing omtrent de
wenselijkheid van herintroductie van de lynx {Lynx lynx) op de Veluwe. Pages 35-39. Mededelingen
No. 31. Nederlandse Commissie voor Internationale Natuurbescherming.
Hairston, N. G., F. E. Smith, and L. B. Slobodkin. 1960. Community Structure, Population Control, and
Competition. American Naturalist 94:421-425.
Herfindal, I., J. D. C. Linnell, J. Odden, E. B. Nilsen, and R. Andersen. 2005. Prey density, environmental
productivity and home-range size in the Eurasian lynx (Lynx lynx). Journal of Zoology 265:63-71.
Iercek, M. T., R. Stottlemyer, and R. Renkin. 2010. Bottom-up Factors Influencing Riparian Willow Recovery
in Yellowstone National Park. Western North American Naturalist 70:387-399.
Ivlev, V. S. 1961. Experimental ecology of the feeding fishes, New Haven, Connecticut, USA.
Jedrzejewska, B., W. Jedrzejewski, A. N. Bunevich, L. Milkowski, and Z. A. Krasinski. 1997. Factors shaping
population densities and increase rates of ungulates in Bialowieza Primeval Forest (Poland and
Belarus) in the 19th and 20th centuries. Acta Theriologica 42:399-451.
16Jedrzejewska, B., H. Okarma, W. Jedrzejewski, and L. Milkowski. 1994. Effects of Exploitation and Protection
on Forest Structure, Ungulate Density and Wolf Predation in Bialowieza Primeval Forest, Poland.
Journal of Applied Ecology 31:664-676.
Jedrzejewski, W., B. Jedrzejewska, H. Okarma, K. Schmidt, A. N. Bunevich, and L. Milkowski. 1996.
Population dynamics (1869-1994), demography, and home ranges of the lynx in Bialowieza
Primeval Forest (Poland and Belarus). Ecography 19:122-138.
Jedrzejewski, W., B. Jedrzejewska, H. Okarma, K. Schmidt, K. Zub, and M. Musiani. 2000. Prey selection and
predation by wolves in Bialowieza Primeval Forest, Poland. Journal of Mammalogy 81:197-212.
Jedrzejewski, W., B. Jedrzejewska, and A. Szymura. 1989. Food Niche Overlaps in a Winter Community of
Predators in the Bialowieza Primeval Forest, Poland. Acta Theriologica 34:487-496.
Jedrzejewski, W., M. Niedzialkowska, R. W. Mysiajek, S. Nowak, and B. Jedrzejewska. 2005. Habitat
selection by wolves Canis lupus in the uplands and mountains of southern Poland. Acta Theriologica
50:417-428.
Jedrzejewski, W., K. Schmidt, L. Milkowski, B. Jedrzejewska, and H. Okarma. 1993. Foraging by Lynx and Its
Role in Ungulate Mortality - the Local (Bialowieza Forest) and the Palearctic Viewpoints. Acta
Theriologica 38:385-403.
Jedrzejewski, W., K. Schmidt, J. Theuerkauf, B. Jedrzejewska, and R. Kowalczyk. 2007. Territory size of
wolves Canis lupus: linking local (Bialowieza Primeval Forest, Poland) and Holarctic-scale patterns.
Ecography 30:66-76.
Jedrzejewski, W., K. Schmidt, J. Theuerkauf, B. Jedrzejewska, N. Selva, K. Zub, and L. Szymura. 2002. Kill
rates and predation by wolves on ungulate populations in Bialowieza Primeval Forest (Poland).
Ecology 83:1341-1356.
Kamler, J. F., W. Jedrzejewski, and B. Jedrzejewska. 2008. Home ranges of red deer in a European old-
growth forest. American Midland Naturalist 159:75-82.
Kauffman, M. J., J. F. Brodie, and E. S. Jules. 2010. Are wolves saving Yellowstone's aspen? A landscape-level
test of a behaviorally mediated trophic cascade. Ecology 91:2742-2755.
Kawata, Y., J. Ozolins, and Z. Andersone-Lilley. 2008. An analysis of the game animal population data from
Latvia. Baltic Forestry 14:75-86.
Krofel, M., D. Huber, and I. Kos. 2011. Diet of Eurasian lynx Lynx lynx in the northern Dinaric Mountains
(Slovenia and Croatia). Acta Theriologica 56:315-322.
Kusak, J., S. Spicic, V. Slijepcevic, S. Bosnic, R. R. Janje, S. Duvnjak, M. Sindicic, D. Majnaric, Z. Cvetnic, and D.
Huber. 2012. Health status of red deer and roe deer in Gorski kotar, Croatia. Veterinarski Arhiv
82:59-73.
Lelieveld, G. 2012. Room for wolf comeback in the Netherlands. Page 31. Vrije Universiteit, Amsterdam.
Levins, R. 1968. Evolution in changing environments. Princeton University Press, Princeton.
Linnell, J. D. C., J. Odden, V. Pedersen, and R. Andersen. 1998. Records of intra-guild predation by Eurasian
Lynx, Lynx lynx. Canadian Field-Naturalist 112:707-708.
Marucco, F., D. H. Pletscher, and L. Boitani. 2008. Accuracy of scat sampling for carnivore diet analysis:
Wolves in the Alps as a case study. Journal of Mammalogy 89:665-673.
Mattioli, L., C. Capitani, A. Gazzola, M. Scandura, and M. Apollonio. 2011. Prey selection and dietary
response by wolves in a high-density multi-species ungulate community. European Journal of
Wildlife Research 57:909-922.
May, R., J. van Dijk, P. Wabakken, J. E. Swenson, J. D. C. Linnell, B. Zimmermann, J. Odden, H. C. Pedersen,
R. Andersen, and A. Landa. 2008. Habitat differentiation within the large-carnivore community of
Norway's multiple-use landscapes. Journal of Applied Ecology 45:1382-1391.
Melis, C., M. Basille, I. Herfindal, J. D. C. Linnell, J. Odden, J. M. Gaillard, K. A. Hogda, and R. Andersen. 2010.
Roe deer population growth and lynx predation along a gradient of environmental productivity and
climate in Norway. Ecoscience 17:166-174.
Melis, C., B. Jedrzejewska, M. Apollonio, K. A. Barton, W. Jedrzejewski, J. D. C. Linnell, I. Kojola, J. Kusak, M.
Adamic, S. Ciuti, I. Delehan, I. Dykyy, K. Krapinec, L. Mattioli, A. Sagaydak, N. Samchuk, K. Schmidt,
M. Shkvyrya, V. E. Sidorovich, B. Zawadzka, and S. Zhyla. 2009. Predation has a greater impact in
less productive environments: variation in roe deer, Capreolus capreolus, population density across
Europe. Global Ecology and Biogeography 18:724-734.
17Messier, F. 1991. The Significance of Limiting and Regulating Factors on the Demography of Moose and
White-Tailed Deer. Journal of Animal Ecology 60:377-393.
Molinari-Jobin, A., F. Zimmermann, A. Ryser, P. Molinari, H. Haller, C. Breitenmoser-Wursten, S. Capt, R.
Eyholzer, and U. Breitenmoser. 2007. Variation in diet, prey selectivity and home-range size of
Eurasian lynx Lynx lynx in Switzerland. Wildlife Biology 13:393-405.
Natuurmonumenten. 2012. De Wolf - Verspreidingsgebied Europa.
Nilsen, E. B., J. M. Gaillard, R. Andersen, J. Odden, D. Delorme, G. van Laere, and J. D. C. Linnell. 2009. A
slow life in hell or a fast life in heaven: demographic analyses of contrasting roe deer populations.
Journal of Animal Ecology 78:585-594.
Nowak, S., R. W. Myslajek, and B. Jedrzejewska. 2005. Patterns of wolf Canis lupus predation on wild and
domestic ungulates in the Western Carpathian Mountains (S Poland). Acta Theriologica 50:263-276.
Nowak, S., R. W. Myslajek, and B. Jedrzejewska. 2008. Density and demography of wolf, Canis lupus
population in the western-most part of the Polish Carpathian Mountains, 1996-2003. Folia
Zoologica 57:392-402.
Nowak, S., R. W. Myslajek, A. Klosinska, and G. Gabrys. 2011. Diet and prey selection of wolves (Canis lupus)
recolonising Western and Central Poland. Mammalian Biology 76:709-715.
Odden, J., I. Herfindal, J. D. C. Linnell, and R. Andersen. 2008. Vulnerability of domestic sheep to lynx
depredation in relation to roe deer density. Journal of Wildlife Management 72:276-282.
Odden, J., J. D. C. Linnell, and R. Andersen. 2006. Diet of Eurasian lynx, Lynx lynx, in the boreal forest of
southeastern Norway: the relative importance of livestock and hares at low roe deer density.
European Journal of Wildlife Research 52:237-244.
Okarma, H. 1995. The trophic ecology of wolves and their predatory role in ungulate communities of forest
ecosystems in Europe. Acta Theriologica 40:335-386.
Okarma, H., B. Jedrzejewska, W. Jedrzejewski, Z. A. Krasinski, and L. Milkowski. 1995. The Roles of
Predation, Snow Cover, Acorn Crop, and Man-Related Factors on Ungulate Mortality in Bialowieza
Primeval Forest, Poland. Acta Theriologica 40:197-217.
Okarma, H., W. Jedrzejewski, K. Schmidt, R. Kowalczyk, and B. Jedrzejewska. 1997. Predation of Eurasian
lynx on roe deer and red deer in Bialowieza Primeval Forest, Poland. Acta Theriologica 42:203-224.
Okarma, H., W. Jedrzejewski, K. Schmidt, S. Sniezko, A. N. Bunevich, and B. Jedrzejewska. 1998. Home
ranges of wolves in Bialowieza primeval forest, Poland, compared with other Eurasian populations.
Journal of Mammalogy 79:842-852.
Painter, L. E., and W. J. Ripple. 2012. Effects of bison on willow and cottonwood in northern Yellowstone
National Park. Forest Ecology and Management 264:150-158.
Panzacchi, M., J. D. C. Linnell, G. Serrao, S. Eie, M. Odden, J. Odden, and R. Andersen. 2008. Evaluation of
the importance of roe deer fawns in the spring-summer diet of red foxes in southeastern Norway.
Ecological Research 23:889-896.
Pedersen, V. A., J. D. C. Linnell, R. Andersen, H. Andren, M. Linden, and P. Segerstrom. 1999. Winter lynx
Lynx lynx predation on semi-domestic reindeer Rangifer tarandus in northern Sweden. Wildlife
Biology 5:203-211.
Pimm, S. L., J. H. Lawton, and J. E. Cohen. 1991. Food Web Patterns and Their Consequences. Nature
350:669-674.
Post, D. M., and G. Takimoto. 2007. Proximate structural mechanisms for variation in food-chain length.
Oikos 116:775-782.
Potiek, A., G. W. W. Wamelink, R. Jochem, and F. v. Langevelde. 2012. Potential for Grey wolf Canis lupus in
the Netherlands: effects of habitat fragmentation and climate change on the carrying capacity and
population dynamics. Page 55. Alterra, part of Wageningen UR, Wageningen.
Rigg, R., S. Findo, M. Wechselberger, M. L. Gorman, C. Sillero-Zubiri, and D. W. Macdonald. 2011. Mitigating
carnivore-livestock conflict in Europe: lessons from Slovakia. Oryx 45:272-280.
Ripple, W., and R. Beschta. 2012a. Large predators limit herbivore densities in northern forest ecosystems.
European Journal of Wildlife Research:1-10.
Ripple, W. J., and R. L. Beschta. 2004. Wolves and the ecology of fear: Can predation risk structure
ecosystems? Bioscience 54:755-766.
18Ripple, W. J., and R. L. Beschta. 2012b. Trophic cascades in Yellowstone: The first 15 years after wolf
reintroduction. Biological Conservation 145:205-213.
Ripple, W. J., A. J. Wirsing, R. L. Beschta, and S. W. Buskirk. 2011. Can restoring wolves aid in lynx recovery?
Wildlife Society Bulletin 35:514-518.
Samelius, G., H. Andren, O. Liberg, J. D. C. Linnell, J. Odden, P. Ahlqvist, P. Segerstrom, and K. Skold. 2012.
Spatial and temporal variation in natal dispersal by Eurasian lynx in Scandinavia. Journal of Zoology
286:120-130.
Schmidt, K., W. Jedrzejewski, H. Okarma, and R. Kowalczyk. 2009. Spatial interactions between grey wolves
and Eurasian lynx in Bialowieza Primeval Forest, Poland. Ecological Research 24:207-214.
Selva, N., B. Jedrzejewska, W. Jedrzejewski, and A. Wajrak. 2005. Factors affecting carcass use by a guild of
scavengers in European temperate woodland. Canadian Journal of Zoology-Revue Canadienne De
Zoologie 83:1590-1601.
Sergio, F., T. Caro, D. Brown, B. Clucas, J. Hunter, J. Ketchum, K. McHugh, and F. Hiraldo. 2008. Top
Predators as Conservation Tools: Ecological Rationale, Assumptions, and Efficacy. Annual Review of
Ecology Evolution and Systematics 39:1-19.
Sidorovich, V. E., L. L. Tikhomirova, and B. Jedrzejewska. 2003. Wolf Canis lupus numbers, diet and damage
to livestock in relation to hunting and ungulate abundance in northeastern Belarus during 1990-
2000. Wildlife Biology 9:103-111.
Steffan, S. A., and W. E. Snyder. 2010. Cascading diversity effects transmitted exclusively by behavioral
interactions. Ecology 91:2242-2252.
Strong, D. R. 1992. Are Trophic Cascades All Wet - Differentiation and Donor-Control in Speciose
Ecosystems. Ecology 73:747-754.
Valdmann, H., Z. Andersone-Lilley, O. Koppa, J. Ozolins, and G. Bagrade. 2005. Winter diets of wolf Canis
lupus and lynx Lynx lynx in Estonia and Latvia. Acta Theriologica 50:521-527.
Wagner, C., M. Holzapfel, G. Kluth, I. Reinhardt, and H. Ansorge. 2012. Wolf (Canis lupus) feeding habits
during the first eight years of its occurrence in Germany. Mammalian Biology - Zeitschrift für
Säugetierkunde 77:196-203.
White, P. J., K. M. Proffitt, L. D. Mech, S. B. Evans, J. A. Cunningham, and K. L. Hamlin. 2010. Migration of
northern Yellowstone elk: implications of spatial structuring. Journal of Mammalogy 91:827-837.
Wikenros, C., O. Liberg, H. Sand, and H. Andren. 2010. Competition between recolonizing wolves and
resident lynx in Sweden. Canadian Journal of Zoology-Revue Canadienne De Zoologie 88:271-279.
19Appendix I
Distribution of constantly occupied lynx areas and lynx observations in Europe
Figure 7 Distribution of constantly occupied lynx (Lynx lynx) areas and lynx observations in Europe. Dark red are the constantly
occupied areas, red areas have confirmed single observations, pink areas have unconfirmed single observations. (Arx et al. 2004)
IAppendix II
Estimated present distribution and future expansion of wolves in Europe
Figure 8 Estimated present distribution and future expansion of wolves in Europe. Grey dots represent sightings of roaming
wolves. Yellow dots represent lone wolf territories. Orange dots represent wolf pairs. Red dots represent wolf packs. Numbers
in the red circles indicate the number of packs in that region. The solid arrows indicate the current direction of expansion. The
dotted arrows indicate expected expansion. The red mash layer indicates distant, yet permanent, wolf populations.
(Natuurmonumenten 2012)
IIAppendix III
List of literature with which I will start the study:
(Barja 2009; Basille et al. 2009; Gorini et al. 2012; Herfindal et al. 2005; Jedrzejewska et al. 1997; Jedrzejewska et al. 1994;
Jedrzejewski et al. 1996; Jedrzejewski et al. 2000; Jedrzejewski et al. 1989; Jedrzejewski et al. 2005; Jedrzejewski et al. 1993;
Jedrzejewski et al. 2002; Kamler et al. 2008; Kawata et al. 2008; Kusak et al. 2012; Linnell et al. 1998; Melis et al. 2010; Melis et al.
2009; Nilsen et al. 2009; Nowak et al. 2005, 2008; Nowak et al. 2011; Odden et al. 2008; Odden et al. 2006; Okarma 1995; Okarma
et al. 1995; Okarma et al. 1997; Okarma et al. 1998; Panzacchi et al. 2008; Rigg et al. 2011; Ripple & Beschta 2012a; Schmidt et al.
2009; Selva et al. 2005; Sidorovich et al. 2003; Wagner et al. 2012; Wikenros et al. 2010)
Table 1 Characteristics of the processed study sites. Six sites were not used in the study because of small sample size (1) or a too
large occurrence of domestic animals in the diet.
Other Scats / Used in
Predator Country Region Period Source
predator kills study
Wolf no Germany Eastern Germany 2001-2009 Scat (Wagner et al. 2012)
2
Wolf no Spain Galicia 1998-2002 Scat (Barja 2009) No
Wolf no France Western Alps 1999-2002 Scat (Marucco et al. 2008)
Wolf no Italy Apennines 1988-2000 Scat (Mattioli et al. 2011)
(Jedrzejewski et al.
Wolf yes Poland Bialowieza Forest 1985-1996 Scat
2000)
1
Wolf no Poland Bydgoszcz Forest 2002-2009 Scat (Nowak et al. 2011) No
Wolf no Poland Wałcz Forest 2002-2009 Scat (Nowak et al. 2011)
Wolf no Poland Rzepin Forest 2002-2009 Scat (Nowak et al. 2011)
Wolf no Poland Lower Silesian Forest 2002-2009 Scat (Nowak et al. 2011)
1
Wolf no Poland Other 2002-2009 Scat (Nowak et al. 2011) No
Wolf yes Estonia 1996-1997 Scat (Valdmann et al. 2005)
1
Wolf yes Latvia 1996-2001 Scat (Valdmann et al. 2005) No
Lynx yes Estonia 1998-2000 Scat (Valdmann et al. 2005)
1
Lynx yes Latvia 1997-2001 Scat (Valdmann et al. 2005) No
Slovenia /
Lynx no Dinaric Mountains 1993-2010 Scat (Krofel et al. 2011)
Croatia
Lynx yes Poland Bialowieza NP 1985-1995 Scat (Okarma et al. 1997)
(Molinari-Jobin et al.
Lynx no Switzerland North-western Alps 1983-2000 Kill
2007)
(Molinari-Jobin et al. 1, 2
Lynx no Switzerland Central Alps 1986-1989 Kill No
2007)
(Molinari-Jobin et al.
Lynx no Switzerland Jura Mountains 1988-1997 Kill
2007)
North-eastern (Molinari-Jobin et al.
Lynx no Switzerland 2001-2004 Kill
Switzerland 2007)
IIIAppendix IV
Groups in the dataset
Group number Diet of which predator Presence of other predator Group size (number of sites)
1 Lynx No wolves 4
2 Lynx Wolves present 2
3 Wolf No lynx 7
4 Wolf Lynx present 2
Format of the combined dataset in SPSS17
IVAppendix V Syntax code for R 2.15 with package ‘vegan’ Lynx (study groups 1 and 2) library(vegan) input_PCA2
Appendix VI

Statistical output

Table 2 Results of the Wald’s chi square statistical test. Niche breadth was calculated
                                            1
as by Levins (Levins 1968). Other ungulates encompasses moufflon, elk, and moose.
 Factor                                    Wald’s Chi Square          Df       Significance
 Niche breadth                                            3.6              1          0.058
 Roe deer                                                 8.3              1          0.004
 Red deer                                                 1.2              1          0.273
 Fallow deer                                                -              1              -
 Unidentified cervids                                     0.3              1          0.604
 Wild boar                                               12.8              1          0.000
                                  1
 Other and unidentified ungulates                         0.7              1          0.414
 Total ungulates                                          8.2              1          0.004
 Domestic animals                                         0.1              1          0.746
 Leporidae                                                8.3              1          0.004
 Other medium sized mammals                               0.1              1          0.732
 All medium sized mammals                                 5.7              1          0.017
 Small mammals                                            0.4              1          0.525
 All mammals                                              2.4              1          0.124
 Bird species                                            32.6              1          0.000
 Fish species                                               -              1              -
 Plant material                                           0.6              1          0.448
 Carrion                                                  0.3              1          0.607
 Unidentified material                                    4.0              1          0.046

Table 3 Comparison of mean proportion per species and standard deviation in the lynx diet in areas
                                                                                     1
where wolves are absent (N = 4) and where wolves are present (N = 2). Other ungulates encompasses
moufflon, elk, and moose.

 Species                                     Wolves absent (N = 4)             Wolves present (N = 2)
                                            Mean            SD                 Mean           SD
 Roe deer                                           61.5          8.3                 27.8         29.7
 Red deer                                            1.1          2.3                  2.8          1.6
 Fallow deer                                           0            -                    0            -
 Unidentified cervids                               20.3         14.3                 29.1         41.2
 Wild boar                                             0            -                  1.8          1.4
                                  1
 Other and unidentified ungulates                    0.5          0.9                    0            -
 Total ungulates                                    83.4         13.9                 61.5         16.4
 Domestic animals                                    0.4          0.7                  0.6          0.8
 Leporidae                                           3.3          2.7                 20.7         16.4
 Other medium sized mammals                          4.3          2.7                  5.1          4.0
 All medium sized mammals                            8.0          5.3                 26.3         19.7
 Small mammals                                       5.4          8.4                  2.1          1.4
 All mammals                                        96.8          6.3                 89.9          6.5
 Bird species                                        0.5          0.9                  3.6          0.4
 Fish species                                          0            -                    0            -
 Plant material                                      2.3          4.5                  5.1          7.2
 Carrion                                             0.5          0.9                  0.8          1.1
 Unidentified material                                 0            -                  0.6          0.8

                                                                 VI
Table 4 Results of the Wald’s chi square statistical test. Niche breadth was calculated as
1
by Levins (Levins 1968). Other ungulates encompasses moufflon, elk, and moose.
Wald’s Chi Square Df Significance
Niche breadth 0.7 1 0.400
Roe deer 1.7 1 0.199
Corrected roe deer 0.136 1 0.712
Red deer 4.2 1 0.041
Corrected red deer 0.8 1 0.374
Fallow deer 1.5 1 0.221
Unidentified cervids 13.0 1 0.000
Wild boar 0.7 1 0.409
1
Other and unidentified ungulates 0.2 1 0.676
Total ungulates 1.1 1 0.292
Domestic animals 0.3 1 0.592
Leporidae 1.1 1 0.297
Other medium sized mammals 0.0 1 0.849
All medium sized mammals 0.0 1 0.957
Small mammals 5.9 1 0.015
All mammals 0.0 1 0.954
Bird species 7.0 1 0.008
Fish species - 1 -
Plant material 0.1 1 0.708
Carrion - 1 -
Unidentified material 0.3 1 0.564
Table 5 Comparison of mean proportion per species and standard deviation in the wolf diet in areas
1
where lynx are absent (N = 7) and where lynx are present (N = 2). Other ungulates encompasses
moufflon, elk, and moose.
Species Lynx absent (N = 7) Lynx present (N = 2)
Mean SD Mean SD
Roe deer 44.0 14.3 27.4 33.6
Corrected roe deer 45.0 13.7 40.5 31.8
Red deer 19.7 9.1 6.5 9.2
Corrected red deer 20.3 9.3 32.5 45.9
Fallow deer 1.9 2.4 0 -
Unidentified cervids 1.7 2.0 39.1 38.6
Wild boar 23.9 16.0 15.2 2.4
1
Other and unidentified ungulates 2.6 7.1 0.9 1.3
Total ungulates 94.0 4.9 89.0 13.0
Domestic animals 2.8 4.3 1.3 0.4
Leporidae 1.6 1.2 1.9 1.8
Other medium sized mammals 1.1 2.2 1.4 1.2
All medium sized mammals 5.5 4.7 5.7 5.5
Small mammals 0.3 0.7 5.1 7.2
All mammals 99.8 0.6 99.8 0.2
Bird species 0 - 0.2 0.3
Fish species 0 - 0 -
Plant material 0.1 0.3 0.1 0.1
Carrion 0 - 0 -
Unidentified material 0.1 0.3 0 -
VIIFrequency of occurrence in wolf scats 80
70
60
50
40
*
30 Lynx absent (N = 7)
20 Lynx present (N = 2)
*
10
0
Figure 9 Frequency of occurrence of prey species in wolf scats were significant different (* =You can also read