The incremental cost of improving immunization coverage in India through the Intensified Mission Indradhanush programme
←
→
Page content transcription
If your browser does not render page correctly, please read the page content below
Health Policy and Planning, 36, 2021, 1316–1324
DOI: https://doi.org/10.1093/heapol/czab053
Advance access publication date: 5 May 2021
Original Article
The incremental cost of improving immunization coverage
in India through the Intensified Mission Indradhanush
programme
Susmita Chatterjee1,2,3,* , Palash Das1 , Anita Pinheiro1 , Pradeep Haldar4 , Arindam Ray5 ,
Logan Brenzel6 and Stephen Resch7
Downloaded from https://academic.oup.com/heapol/article/36/8/1316/6265953 by guest on 10 September 2021
1
Research department, The George Institute for Global Health, Research Department, 308-309, Elegance Tower, Plot No. 8, Jasola District
Centre, New Delhi 110025, India
2
Department of Medicine, University of New South Wales, 18 High Street, Kensington, New South Wales 2052, Australia
3
Prasanna School of Public Health, Manipal Academy of Higher Education, Madhav Nagar, Manipal 576104, Karnataka, India
4
Immunization Division, Ministry of Health and Family Welfare, Government of India, Nirman Bhawan, Maulana Azad Road, New Delhi
110011, India
5
The Bill & Melinda Gates Foundation, Capital Court, 5th Floor, Olof Palme Marg, Munirka, New Delhi 110067, India
6
Bill & Melinda Gates Foundation, 500 5th Ave N, Seattle, WA 98109, USA
7
Center for Health Decision Science, Harvard T. H. Chan School of Public Health, 718 Huntington Avenue, Boston MA 02115, USA
*Corresponding author. Research department, The George Institute for Global Health, 308-309, Elegance Tower, Plot No. 8, Jasola District Centre, New Delhi
110025, India. E-mail: schatterjee@georgeinstitute.org.in
Accepted on 21 April 2021
Abstract
Intensified Mission Indradhanush (IMI) was a strategic endeavour launched by the Government of India aiming to achieve 90% full immunization
coverage in the country by 2018. The basic strategy of this special drive involved identifying missed children and vaccinating them in temporary
outreach sites for 1 week over consecutive 4-month period starting from October 2017. This study estimated the incremental economic and
financial cost of conducting IMI in India from a government provider perspective. Five states—Assam, Bihar, Maharashtra, Rajasthan and Uttar
Pradesh were purposefully selected because of high concentration of IMI activities. The stratified random sample of 40 districts, 90 sub-
districts and 289 sub-centres were included in this study. Cost data were retrospectively collected at all levels from administrative records,
financial records and staff interviews involved in IMI. The weighted incremental economic cost per dose (including vaccine costs) was lowest in
Uttar Pradesh (US$3.45) and highest in Maharashtra (U$12.23). Incremental economic cost per IMI dose was found to be higher than a recent
routine immunization costing study by Chatterjee and colleagues in 2018, suggesting that it requires additional resources to immunize children
through an intensified push in hard-to-reach areas. Incremental financial cost of the IMI programme estimated in this study will be helpful for
the government for any future planning of such special initiative. The reasons for variation of unit costs of IMI across the study districts are
not known, but lower baseline coverage, high population density, migration, geography and terrain and vaccinating small numbers of children
per session could account for the range of findings. Further analysis is required to understand the determinants of cost variations of the IMI
programme, which may aid in better planning and more efficient use of resources for future intensified efforts.
Keywords: Cost, economic cost, financial cost, incremental cost, immunization, mission Indradhanush, India
Introduction pregnant women with a focus on full immunization of chil-
dren under 2 years. The basic strategy was based on a head
Intensified Mission Indradhanush (IMI) was a Government
count survey to identify children with missing doses, result-
of India initiative to improve immunization coverage of the ing in a due list of missing children, and preparation of a
country. Despite being operational for about 35 years, India’s microplan for conducting sessions during 1 week of each
universal immunization programme was only able to fully month for four consecutive months in new vaccination sites. If
immunize up to 62% of the eligible children in 2015–16 required, mobile teams were formed to reach large mobile and
(International Institute for Population Sciences (IIPS) and ICF, isolated population (e.g. population in brick kilns, construc-
2017). To increase the coverage to 90% by 2018, IMI, the tion areas and plantation areas). The objective of forming the
programme of periodic intensification of routine immuniza- mobile teams was to conduct the outreach sessions in these
tion, was implemented by the government in 173 lower- hard-to-reach areas at convenient time and places. All cate-
coverage districts and 17 urban areas across 24 states during gories of staff were trained before the implementation of the
October 2017 to January 2018 (Gurnani et al., 2018). The programme, and the programme was regularly monitored at
programme targeted all children aged up to 5 years and the different levels (Gurnani et al., 2018).
© The Author(s) 2021. Published by Oxford University Press in association with The London School of Hygiene and Tropical Medicine.
This is an Open Access article distributed under the terms of the Creative Commons Attribution License (https://creativecommons.org/licenses/by/4.0/),
which permits unrestricted reuse, distribution, and reproduction in any medium, provided the original work is properly cited.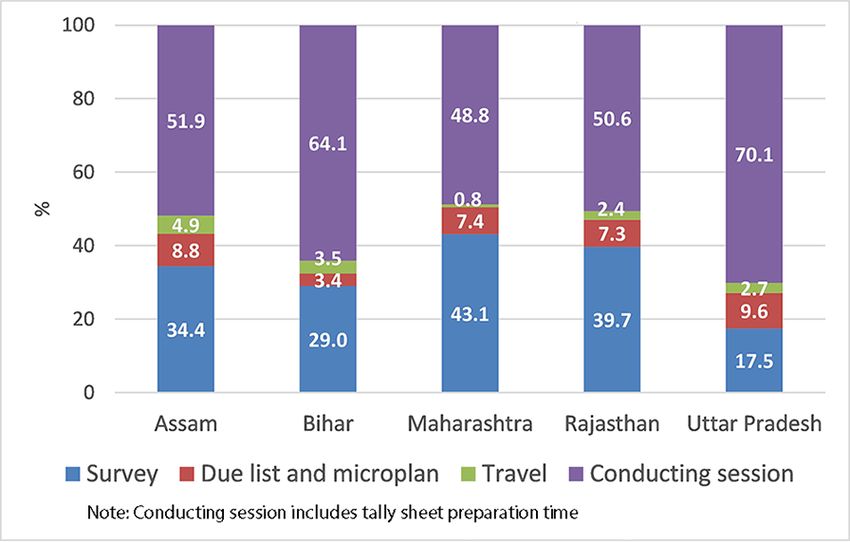
Health Policy and Planning, 2021, Vol. 36, No. 8                                                                                   1317

                                                                       programme (Brenzel et al., 2015). The IMI began in Octo-
  Key messages                                                         ber 2017 and continued until January 2018. Cost data were
                                                                       retrospectively collected by a 5-member team between July
    • Recent literature reviews indicated that several studies in      2018 and January 2019 using standardized and pre-tested
      high-, low- and middle-income countries have reported the        questionnaires. All costs were presented in 2019 US$. An
      improvement in immunization coverage through different           average exchange rate of 2019, US$1 = INR 70.394, was used
      interventions; however, the majority of those did not report     throughout the paper.
      the incremental costs of these interventions, which is a
      missed opportunity. In India, there is only one study that
      reported cost analysis of an intervention aimed to improve       Sampling methodology
      immunization coverage in one district.                           Five states with high concentration of IMI activities (Assam,
    • This study estimated incremental financial and economic          Bihar, Maharashtra, Rajasthan and Uttar Pradesh) were pur-
      cost of conducting Intensified Mission Indradhanush (IMI)        posefully selected for this study. Assam is a north-eastern state
                                                                       in India with a population of approximately 31 million as per

                                                                                                                                           Downloaded from https://academic.oup.com/heapol/article/36/8/1316/6265953 by guest on 10 September 2021
      programme, a Government of India initiative to improve
      immunization coverage of the country, by covering 40 dis-        2011 census. Bihar, the third populous and the most densely
      tricts, 90 sub-districts and 289 sub-centres across five         populated state, situated in eastern India had a population of
      states in India.                                                 approximately 104 million in 2011. Maharashtra, a western
    • Incremental economic cost per dose delivered through IMI         India state, had a population of 112 million in 2011 and is the
      programme was higher than economic cost per dose esti-           second populous state in India. Rajasthan and Uttar Pradesh
      mated in a recent routine immunization costing study in          are states in northern India. As per 2011 census, Rajasthan
      India, suggesting that it requires additional resources to       had about 68 million population while Uttar Pradesh had
      immunize children through an intensified push in hard-to-        roughly 200 million inhabitants, which makes the state the
      reach areas.                                                     most populous state in the country. Full immunization cov-
    • Time cost was the major cost contributor, and a signifi-         erage as per National Health and Family Welfare Survey
      cant proportion of the time was spent for conducting IMI         (2015–2016) was the lowest in Assam (47.1%), followed
      sessions itself. A better planning of the programme could        by Uttar Pradesh (51.1%), Rajasthan (54.8%), Maharash-
      reduce the cost. Incremental financial cost of IMI pro-          tra (56.2%) and Bihar (61.7%) (International Institute for
      gramme estimated in this study will be helpful for the           Population Sciences (IIPS) and ICF, 2017). Because of huge
      government for any future planning of such special initiative.   numbers of unvaccinated children, majority of IMI activities
                                                                       were concentrated in these five states.
                                                                          Within these five states, 34 districts where IMI programme
                                                                       was conducted were randomly selected for this study. Dur-
   Ninety seven thousand six hundred and twenty-eight vac-
                                                                       ing the sampling process, first, all IMI districts in five study
cination sessions were conducted in IMI during October
                                                                       states were grouped by division, and divisions were selected
2017 and January 2018, where 5.95 million children and                 at random using probability proportional to size sampling.
1.18 million pregnant women were vaccinated. Over 15 mil-              Up to two IMI districts per division were randomly selected.
lion antigens were delivered during this period. Gurnani et al.,       The number of sub-districts (blocks) selected per district was
(2018) described the programme in detail and its impact on             based on a rule of selecting 30% of sub-districts, with a floor
immunization coverage of the country. They found that after            of two sub-districts and a ceiling of four sub-districts. The
IMI, proportion of children with full immunization cover-              number of sub-centres (SCs) per sub-district was based on a
age increased by 18.5% as compared with pre-IMI estimates.             rule of selecting 10% of SCs, with a floor of two and a ceiling
However, they concluded that the whole increase in cover-              of four SCs. The rule of selecting sub-districts and SCs was to
age was not solely because of IMI—other similar initiatives            manage the total size of the sample to fit the data collection
also influenced the improvement. Another study conducted a             timeframe and budget.
quasi-experimental evaluation of IMI by comparing IMI and                 In addition to 34 districts, six districts with urban areas
non-IMI districts using routine administrative data on vaccine         were also selected for this study as improving immunization
doses delivered (Clarke-Deelder et al., 2021). This controlled         coverage in urban areas was a major focus of IMI programme.
interrupted time-series analysis estimated the impact of IMI           In Uttar Pradesh and Maharashtra, districts with urban areas
during the 4-month implementation period and in subsequent             were selected at random, in Bihar and Rajasthan, IMI was
months. The study found that during implementation, IMI                conducted in one district each having urban areas and those
increased the delivery of vaccine doses with a median effect of        two districts were selected for this study. Assam did not have
10.6%; however, there was no evidence of a sustained effect            any district with urban areas for IMI.
of IMI during 8 months after the implementation ended. It is              The final sample consisted 34 randomly selected IMI dis-
evident from both studies that IMI had some impact on immu-            tricts and six other IMI districts with urban areas, 90 sub-
nization coverage, and it is obvious that a special drive like         districts (about 30% of all sub-districts), 239 SCs and 50
IMI required additional resources. The objective of this study         urban auxiliary nurse midwives (ANMs) (about 3% of all
was to estimate the incremental financial as well as economic          SCs). In Indian health system, SCs are the most peripheral
cost of conducting IMI programme.                                      and first point of contact between the primary health care
                                                                       system and the community. In the field of rural health, one
                                                                       SC covers approximately 5000 population in plains and is
Methods                                                                managed by 1–2 ANMs who are primarily responsible for
A government provider perspective was used to calculate the            routine immunization in their respective areas. During IMI,
incremental economic and financial cost of conducting IMI              they were responsible for head count survey, due list and
1318 Health Policy and Planning, 2021, Vol. 36, No. 8
Table 1. Study sample
State Districts Districts with urban areas Sub-districts SCs ANMs in urban areas
Assam 5 0 10 28 0
Bihar 6 1 18 40 7
Maharashtra 5 1 18 54 8
Rajasthan 5 1 12 22 8
Uttar Pradesh 13 3 32 95 27
Total 34 6 90 239 50
ANM, Auxiliary Nurse Midwives.
microplan preparation and conducting sessions. In urban In addition to the cost items mentioned above, time spent
areas, as there are no sub-districts or SCs, ANMs are posted on each activity was multiplied by respective hourly wage to
Downloaded from https://academic.oup.com/heapol/article/36/8/1316/6265953 by guest on 10 September 2021
either in the urban health post or in urban primary health calculate the time cost related to that activity, which was part
centre. Three to four such urban units were randomly selected, of economic cost of IMI. At the district and sub-district levels,
followed by random selection of 2–3 ANMs in those units. monthly gross salary of each staff involved in IMI activities
The distribution of final sample is given in Table 1. was collected from the pay roll division. Monthly working
hours and gross monthly salary was used to calculate the
hourly wage for each staff. Average monthly gross salary of
Costing methodology different categories of staff involved in IMI programme is pre-
Both economic and financial costs were calculated to under- sented in Supplementary Appendix Table A2. Time spent in
stand the incremental cost of conducting IMI. Costs were various IMI activities was collected through face-to-face inter-
calculated based on an internationally recognized and stan- views with staff involved in IMI activities. For calculating
dardized approach, adapted for this study (Brenzel et al., the time spent by voluntary workers (e.g. ASHAs), minimum
2015). The unit of incremental cost analysis was the district wage rate of the respective states was used.
as IMI was conducted at the low-performing districts only. The goal of collecting cost data from a sample of health
At the district and sub-district levels, the activities related to facilities was to make inferences of unit cost and total costs
IMI included task force and routine review meetings, train- of the IMI programme in the sampled districts and states.
ing, supervision, report compilation, microplan compilation, To minimize bias and maximize precision in unit cost esti-
vaccine distribution and social engagement. At the SC/ANM mates, volume-weighted mean of unit costs across the sites
level, activities comprised the head count survey, due list and in the sample was used, which is a recommended method
microplan preparation, travel to the session sites, conducting for healthcare costing studies in low- and middle-income
the sessions and report preparation. countries (Clarke-Deelder et al., 2019). The volume-weighted
Data were collected at the district and sub-district levels mean unit cost was calculated as the sum of the total costs
regarding the quantity, duration and number of participants across all sites in the sample divided by the sum of delivery vol-
in each activity. Sources of data included training and meet- umes (number of doses administered during IMI; number of
ing registers, the supervision plan, the microplan for routine children vaccinated during IMI) across all sites in the sample.
immunization and IMI. At the SC level, ANMs were inter- The uncertainty in estimating cost comes from the uncer-
viewed to understand the staffing of the IMI sessions and time tainty due to selection of sample facilities at different lev-
spent for different activities related to IMI. At the district and els. One approach to obtain a correct estimate is to use
sub-district levels, antigen-wise doses delivered during IMI inverse probability weighting (Rivera-Rodriguez et al., 2018).
were gathered from administrative records. Weights are the inverse of the probability of a sample to be
Additional expenditure on vaccine transport, communi- selected from the total (Resch et al., 2020). To calculate the
cation (all activities to inform the community about IMI, uncertainty, the variance of the weighted estimate of total
e.g. banners, posters, miking and media coverage), train- costs was calculated using the methods discussed by Rivera-
ing, meeting, mobility support, payment for alternate vac- Rodriguez et al., (2018). After deriving the variance, the confi-
cine delivery (AVD)1 , incentives for Accredited Social Health dence interval (CI) was calculated using the standard formula:
Activists (ASHAs)2 , printing, waste management, supervi-
sd
sion, microplanning and mobile team were gathered from the CI = mean ± z √
financial reports of each sampled district and were included in n
both economic and financial cost calculation. Travel expenses where z is the z-score corresponding to the confidence level
to session sites were gathered from interviews of the ANMs (95%), sd is the standard error, the square root of variance,
and were also added into both cost calculations. and n is the sample size.
Vaccine and syringe costs were calculated by multiplying
number of doses of different antigens administered during
IMI, wastage rate and unit price and were added in both Results
financial and economic cost calculations. Antigen-wise unit IMI outputs
price, unit price of syringes and wastage rates were taken Considering the study districts of five study states, the incre-
from the cost analysis of India’s comprehensive multi-year mental average number of doses delivered during all sessions
plan for immunization (2018–2022) (Ministry of Health and in IMI ranged from 14 353 in Assam to 183 471 in Uttar
Family Welfare, Government of India) and are presented in Pradesh. Similar variation was observed for children vacci-
Supplementary Appendix Table A1. nated during IMI. Average children vaccinated during IMI inHealth Policy and Planning, 2021, Vol. 36, No. 8 1319
the study districts was 3784 in Assam; 6219 in Rajasthan; The percentage distribution of labour hours related to various
7690 in Maharashtra; 17 974 in Bihar and 66 619 in Uttar IMI related activities at the SC level is presented in Figure 1.
Pradesh. Most of labour hours were spent for conducting IMI sessions
Over the 4-month period of IMI, sampled ANMs in ranging from 49% in Maharashtra to 70% in Uttar Pradesh
Maharashtra conducted four sessions (1 session per ANM (Figure 1). After conducting session, a significant proportion
per month); ANMs in Assam conducted six IMI sessions; of labour hours were spent for conducting the head count sur-
in Rajasthan eight sessions; in Bihar 10 sessions; and in vey. In Maharashtra and Rajasthan, the survey accounted for
Uttar Pradesh, 24 sessions on average. These IMI sessions 43% and 40% of total labour hours, respectively. District-
were incremental to ANMs’ ongoing routine immunization wise distribution of time costs for various IMI activities at the
sessions. SC level is presented in Supplementary Appendix Table A3.1
Time cost at the sub-district and district levels
Economic cost of IMI
Time spent and time cost for IMI at the SC level The majority of labour time cost at the district and sub-district
Downloaded from https://academic.oup.com/heapol/article/36/8/1316/6265953 by guest on 10 September 2021
levels was for training and meeting related to IMI (48% of
At the SC level, most of the time was spent for conduct-
total time cost both at district and sub-district levels) and
ing the IMI session itself. Average duration of each session
extensive supervision of IMI (46% at the sub-district level
was 7 hours excluding travel time. The average round trip
and 49% at the district level). Report compilation contributed
travel time from the respective SC to the IMI session site was
about 2% of total time cost at both levels. Vaccine distribu-
71 minutes for Assam ANMs; 57 minutes for Bihar ANMs;
tion contributed about 3% of total time cost at the sub-district
23 minutes for Maharashtra ANMs; 27 minutes for Rajasthan
level; however, at the district level, there was no additional
ANMs and 26 minutes for Uttar Pradesh ANMs. Motorcycle
time cost related to vaccine distribution because during IMI,
was the most common mode of transport used for reaching
vaccines were transported and distributed along with routine
the session sites (53% session sites were reached by motor-
vaccines. District-wise distribution of time costs related to IMI
cycle) followed by walking (18% session sites), office vehicle
activities at the sub-district and district levels is presented in
(10%) and auto rickshaw (9%). In districts with urban areas,
Supplementary Appendix Tables A3.2 and A3.3, respectively.
ANMs conducted more sessions during IMI except in Uttar
Pradesh and the number ranged from 8 to 22 sessions. Travel
time to the session sites was less in urban areas of Bihar and Incremental economic cost of conducting IMI
Maharashtra but was similar in Rajasthan and Uttar Pradesh. The incremental economic cost per IMI dose and cost per child
In the urban areas, the main transport to reach the session sites vaccinated during IMI varied substantially across the study
was auto rickshaw/rickshaw (covered 43% sessions sites). The states and districts. Number of doses were antigen-wise total
other modes of transport were walking (in 27% session sites), doses delivered during IMI period and were gathered from
motorcycle (17%) and office vehicle (9%). administrative records. As one child might get more than one
During the IMI sessions, ANMs were assisted by ASHAs antigen in one visit (e.g. first dose of pentavalent, oral polio
and other staff members. The majority were present full time and rotavirus vaccine), number of doses were much higher
during the sessions, which increased total hours spent for than the number of children vaccinated during IMI sessions.
IMI sessions. Total hours spent for all activities related to Incremental economic cost of IMI was divided by total num-
IMI at the SC level varied widely across study states, with ber of doses and total children vaccinated during IMI period
the fewest hours spent in Assam (291 hours total) and the to get cost per IMI dose and cost per child vaccinated, respec-
highest in Uttar Pradesh (752 hours total). In Rajasthan SCs, tively. Unit costs were the lowest in Uttar Pradesh and highest
total 331 hours were spent for IMI activities followed by in Maharashtra (Table 2). Among all 40 study districts, the
390 hours in Maharashtra SCs and 433 hours in Bihar SCs. lowest cost per dose was in Patna district of Bihar (US$1.73)
Figure 1. Distribution of labour hours related to Intensified Mission Indradhanush (IMI) at the sub-centre level (average %).1320 Health Policy and Planning, 2021, Vol. 36, No. 8
Table 2. Weighted incremental economic cost (including vaccine cost) of conducting IMI programme (US$2019)
Incremental Cost per child
economic cost 95% CI Cost per IMI dose 95% CI vaccinated during 95% CI
State (US$ million) (LB, UB) ($2019) (LB, UB) IMI ($2019) (LB, UB)
Assam 0.49 0.43, 0.55 6.75 5.99, 7.50 24.61 21.78, 27.44
Bihar 4.18 3.15, 5.21 4.73 2.83, 6.63 12.06 7.61, 16.51
Maharashtra 2.68 1.93, 3.43 12.23 7.23, 17.23 28.24 16.75, 39.72
Rajasthan 1.25 0.96, 1.55 5.83 4.62, 7.04 18.32 14.59, 22.05
Uttar Pradesh 40.08 37.02, 43.15 3.45 2.86, 4.03 9.22 7.54, 10.91
CI, confidence interval; LB, lower bound; UB, upper bound.
Downloaded from https://academic.oup.com/heapol/article/36/8/1316/6265953 by guest on 10 September 2021
Table 3. Weighted incremental economic cost (including vaccine cost) of conducting IMI programme in study districts (US$2019)
Incremental Cost per
economic Doses Children child
cost (US$ 95% CI delivered Cost per IMI 95% CI vaccinated vaccinated 95% CI
District million) (LB, UB) during IMIa dose (LB, UB) during IMI during IMI (LB, UB)
Assam
Chirang 0.04 0.038, 0.045 3350 12.36 11.28, 13.43 947 43.71 39.90, 47.53
Darrang 0.05 0.047, 0.060 12 384 4.35 3.83, 4.88 3371 15.99 14.06, 17.92
Karbi 0.11 0.094, 0.123 17 873 6.08 5.26, 6.90 5107 21.29 18.42, 24.16
Anglong
Kokrajhar 0.05 0.048, 0.059 8559 6.21 5.57, 6.85 2374 22.39 20.10, 24.69
Nagaon 0.14 0.124, 0.156 29 600 4.73 4.18, 5.28 7119 19.67 17.38, 21.95
Bihar
East 0.17 0.171, 0.175 39 974 4.32 4.27, 4.38 15 191 11.38 11.23, 11.53
Champaran
Gaya 0.56 0.476, 0.644 75 270 7.44 6.33, 8.55 28 812 19.44 16.54, 22.34
Madhubani 0.44 0.404, 0.477 68 269 6.45 5.92, 6.99 34 020 12.95 11.87, 14.02
Nawada 0.08 0.070, 0.090 22 040 3.61 3.16, 4.07 7953 10.01 8.75, 11.28
Patna (urban) 0.09 0.085, 0.094 51 681 1.73 1.65, 1.82 20 254 4.42 4.20, 4.64
Sheohar 0.05 0.038, 0.061 15 616 3.17 2.46, 3.87 5973 8.28 6.43, 10.13
Sitamarhi 0.24 0.226, 0.263 38 368 6.37 5.89, 6.85 13 615 17.95 16.60, 19.30
Maharashtra
Ahmednagar 0.17 0.127, 0.211 11 717 14.42 10.84, 18.02 4971 34.00 25.52, 42.49
Beed 0.10 0.096, 0.113 11 970 8.74 8.02, 9.46 4448 23.52 21.58, 25.46
Jalgaon 0.40 0.315, 0.479 22 658 17.51 13.90, 21.23 10 216 38.84 30.82, 46.87
Nanded 0.20 0.157, 0.243 8588 23.26 18.28, 28.24 3913 51.05 40.12, 61.98
Solapur 0.13 0.103, 0.156 21 800 5.96 4.75, 7.18 9639 13.48 10.73, 16.23
Thane 0.11 0.086, 0.135 31 751 3.48 2.70, 4.26 12 953 8.53 6.62, 10.44
(urban)
Rajasthan
Alwar 0.13 0.119, 0.141 8015 16.22 14.83, 17.61 2541 51.15 46.77, 55.54
Jaipur 0.07 0.052, 0.094 17 504 4.15 2.94, 5.36 6425 11.32 8.02, 14.61
(urban)
Jodhpur 0.14 0.089, 0.183 44 567 3.06 2.00, 4.12 14 408 9.46 6.20, 12.73
Pali 0.09 0.079, 0.099 17 375 5.13 4.55, 5.72 5320 16.77 14.86, 18.69
Pratapgarh 0.02 0.010, 0.033 7557 2.90 1.36, 4.43 2446 8.95 4.21, 13.69
Udaipur 0.08 0.042, 0.110 21 387 3.54 1.95, 5.13 6172 12.27 6.77, 17.78
Uttar Pradesh
Bahraich 1.04 0.982, 1.105 456 742 2.28 2.15, 2,42 148 917 7.01 6.59, 7.42
Ballia 0.88 0.807, 0.955 204 078 4.32 3.95, 4.68 79 021 11.15 10.21, 12.08
Balrampur 0.51 0.490, 0.528 195 015 2.61 2.51, 2.71 65 358 7.79 7.49, 8.08
Banda 0.52 0.487, 0.556 110 446 4.72 4.41, 5.03 42 370 12.30 11.49, 13.12
Basti 0.63 0.530, 0.729 152 737 4.12 3.47, 4.77 59 507 10.58 8.91, 12.26
Chitrakoot 0.22 0.175, 0.261 59 794 3.64 2.92, 4.36 23 076 9.43 7.57, 11.30
Farrukkabad 0.53 0.469, 0.588 169 658 3.11 2.76, 3.46 65 911 8.01 7.11, 8.92
Hapur 0.28 0.205, 0.361 72 187 3.92 2.84, 5.00 28 378 9.96 7.21, 12.72
Hardoi 0.98 0.908, 1.053 291 228 3.37 3.12, 3.62 100 608 9.74 9.02, 10.46
Jaunpur 1.43 1.293, 1.558 351 853 4.05 3.67, 4.43 123 907 11.50 10.44, 12.57
Lucknow 0.39 0.276, 0.497 130 855 2.95 2.11, 3.80 47 920 8.06 5.75, 10.37
(urban)
Mau 0.64 0.600, 0.676 148 528 4.30 4.04, 4.55 60 357 10.57 9.94, 11.20
Meerut 0.16 0.146, 0.168 81 678 1.92 1.79, 2.06 35 672 4.41 4.10, 4.71
(urban)
Sidharthnagar 0.80 0.723, 0.874 219 430 3.64 3.30, 3.98 70 628 11.31 10.24, 12.37
(continued)Health Policy and Planning, 2021, Vol. 36, No. 8 1321
Table 3. (Continued)
Incremental Cost per
economic Doses Children child
cost (US$ 95% CI delivered Cost per IMI 95% CI vaccinated vaccinated 95% CI
District million) (LB, UB) during IMIa dose (LB, UB) during IMI during IMI (LB, UB)
Unnao 0.81 0.769, 0.842 205 346 3.92 3.75, 4.10 75 336 10.69 10.21, 11.17
Varanasi 0.20 0.171, 0.224 85 957 2.30 1.99, 2.60 38 939 5.07 4.39, 5.74
(urban)
CI, Confidence Interval; LB, Lower bound; UB, Upper bound.
Note: 1US$ = INR 70.394.
a
Including tetanus toxoid doses.
Downloaded from https://academic.oup.com/heapol/article/36/8/1316/6265953 by guest on 10 September 2021
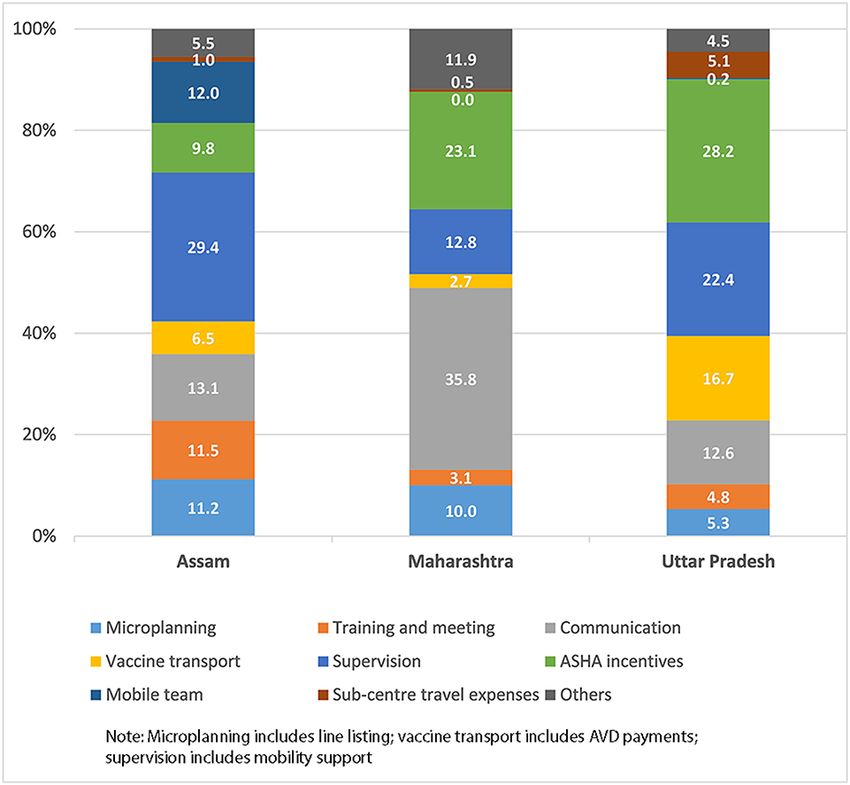
Figure 2. Distribution of financial cost of Intensified Mission Indradhanush (IMI) (average % - excluding vaccines and syringes) in selected states.
and highest in Nanded district of Maharashtra (US$23.26) distribution of financial cost was not presented for these two
(Table 3). states.
Financial cost of IMI Incremental financial cost of conducting IMI
At the district level, on average, financial cost for IMI was Incremental financial cost of IMI also varied across study
about 24% of incremental economic cost of conducting IMI, states and study districts; however, the variation was not as
which indicates the labour-intensive nature of the interven- wide as incremental economic cost. Weighted-average finan-
tion. Vaccines and syringes accounted for the major share of cial cost per dose was lowest in Rajasthan and Uttar Pradesh
financial cost (average ranging between 60% and 78%) for and highest in Assam (Table 4). Assam also had highest
the sampled IMI districts in three states: Bihar, Rajasthan financial cost per child vaccinated during IMI.
and Uttar Pradesh. In the sampled IMI districts of Assam and
Maharashtra, vaccines and syringes represented on average
Discussion
29% and 25% of financial costs, respectively. The distri-
bution of financial cost of IMI for the sampled districts in This paper estimated the incremental financial and economic
three states is presented in Figure 2. Detailed distribution of cost of conducting IMI, a flagship programme of the gov-
financial cost across the districts of Assam, Maharashtra and ernment of India, aimed to improve immunization cover-
Uttar Pradesh are presented in Supplementary Appendix Table age of the country. Time cost contributed 63–83% of total
A4. For few districts of Bihar and Rajasthan, component- incremental economic cost of conducting IMI indicating the
wise financial expenditure data were not available; therefore, labour-intensive nature of the intervention. A study calculated1322 Health Policy and Planning, 2021, Vol. 36, No. 8
Table 4. Weighted incremental financial cost (including vaccine cost) of conducting IMI programme (US$2019)
Incremental Cost per child
financial cost 95% CI Cost per IMI 95% CI vaccinated during 95% CI
State (US$ million) (LB, UB) dose ($2019) (LB, UB) IMI ($2019) (LB, UB)
Assam 0.17 0.15, 0.18 2.25 2.03, 2.46 8.16 7.35, 8.98
Bihar 0.82 0.67, 0.97 1.06 0.78, 1.33 2.72 2.07, 3.36
Maharashtra 0.39 0.30, 0.49 1.57 0.99, 2.16 3.67 2.32, 5.03
Rajasthan 0.22 0.15, 0.28 0.78 0.50, 1.06 2.43 1.56, 3.30
Uttar Pradesh 9.54 8.66, 10.42 0.78 0.48, 1.08 2.11 1.25, 2.97
CI, confidence interval; LB, lower bound; UB, upper bound.
weighted economic costs of routine immunization across During any future programme planning like IMI, the author-
Downloaded from https://academic.oup.com/heapol/article/36/8/1316/6265953 by guest on 10 September 2021
seven states in India including Bihar and Uttar Pradesh where ities should also look into the safety of the ANMs (e.g. while
the current study was also conducted (Chatterjee et al., 2018). planning vaccination at the construction sites or in forest
Incremental economic cost per IMI dose was substantially areas, ANMs should be accompanied by at least another staff
higher than the same estimated for routine immunization member) and ensure that minimum infrastructure (e.g. tables,
in these two states. The cost per dose reported for routine chairs and a proper place to sit) and facilities (e.g. toilet facil-
immunization was US$1.31 for Bihar and US$1.43 for Uttar ities) are available at the session sites. Gurnani et al., (2018)
Pradesh in 2019 US$. Incremental cost per IMI dose was also noted lack of infrastructure as one of the challenges in
US$4.73 in Bihar and US$3.45 in Uttar Pradesh in 2019 US$. new session sites during IMI. These are particularly important
The higher unit cost in IMI was because IMI aimed to reach in the coronavirus disease-2019 (COVID-19) era when along-
the unreached and hence, a lot more effort was given for side the safety of the vaccination team, the children and their
identifying the missed children through extensive household parents, maintaining and improving the coverage will also be
survey, several planning meetings were conducted to final- a challenge.
ize additional temporary session sites for vaccinating those Recent literature reviews indicated that several studies
missed children. Children were vaccinated in hard to reach in high-, low- and middle-income countries have reported
areas such as riverine islands, which remain inaccessible half the improvement in immunization coverage through differ-
of the year, and in areas dominated by migrant workers such ent interventions. However, the majority of those did not
as brick kiln, construction sites and plantation. Because of report the incremental costs of these interventions, which is a
these extensive efforts to reach to the last mile for vaccina- missed opportunity (Ozawa et al., 2018; Munk et al., 2019).
tion, time cost of the special drive was significantly higher, Without cost information, countries will not have enough
and hence, the incremental economic cost. evidence on the additional resources needed to achieve per-
During the interviews with 289 sampled ANMs, they were formance goals. The literature review identified four studies in
asked ‘in your experience how many kids is the most you can India that reported either total intervention cost for improv-
vaccinate in an hour in routine setting’, i.e. in any routine ing immunization coverage or unit costs (Pandey et al., 2007;
immunization session (fixed or outreach) if kids are taken at Rainey et al., 2009; Banerjee et al., 2010; Powell-Jackson
sites and wait in queue, how many they can vaccinate per et al., 2018); however, only one study reported the con-
hour. The ANMs reported they could vaccinate on average 13 tribution of different cost components in total cost of the
kids per hour in a typical routine immunization session while intervention. Banerjee et al., (2010) assessed the efficacy of
on average, only around two kids were vaccinated per hour non-financial incentives on immunization rates and compared
during IMI. The average time spent by the ANMs and accom- it with the effect of improving the reliability of the sup-
panied staff members per IMI session was 7 hours, which ply of services only. Reliability of supply of services implied
increased the time cost substantially. A better planning of regular availability of immunization services in the sampled
the programme could have reduced the cost. Adjusting the villages through conducting mobile immunization camps on
duration of the IMI session based on ANMs’ perception of a fixed date every month at a fixed time. This was com-
number of children that could be vaccinated per hour, the pared with another intervention where in addition to ensuring
incremental cost per dose of IMI decreased by 11–32% in the availability of immunization services through monthly immu-
study states. In geographies with a few numbers of children to nization camps, parents were offered non-financial incentives
be vaccinated during IMI sessions, these children could have per immunization administered and on completion of child’s
been vaccinated during routine sessions with the exception of full immunization. The average cost of a fully immunized
the hard-to-reach areas. If it was absolutely required to reach child was US$28 in reliable camps with incentive and US$56
those children through IMI, then the ANMs could have had in camp without incentive. The largest cost component was
greater autonomy to decide the timing and duration of the ses- salaries (29%) followed by incentives (28%) and monitoring
sions. Several sampled ANMs reported that even when they (23%) for the intervention where incentives were given for
had few kids to vaccinate as per due list, they had to wait at immunizing a child. Salary contributed 46% of total cost for
the session site for the entire planned period of time (on aver- the intervention focused only on improving the reliability of
age 6–7 hours), sometimes without proper infrastructure and supply of services followed by monitoring (37%). Salary was
facilities. Proper utilization of their time will not only reduce the largest cost component because staff was hired specifically
the incremental cost of the special drive like IMI, but health for the intervention. In IMI programme, staff contributed
workers’ time can be utilized for other productive activities. a proportion of their time for IMI activities but still timeHealth Policy and Planning, 2021, Vol. 36, No. 8 1323
cost contributed to 63–83% of total incremental economic example, in a few training and meeting registers, information
cost of conducting IMI, indicating that much more effort was available at the start and end time of the event, along
was required to reach out the missed-out children. This is with number of participants and proceedings. Given that
obvious because during IMI, ANMs reached out to several ANMs and their supervisors adhered to a schedule for dura-
hard-to-reach areas such as riverine islands, brick kiln and tion of IMI sessions, time spent for conducting sessions and
construction sites and plantation areas and because of such supervision was relatively robust, and recall bias would be
extensive effort to reach out to the last mile, time cost was minimized. Second, given the size of the cost study, there
significantly high. were gaps in information to be collected. For instance, Prat-
Apart from immunization, ANMs are also responsible for apgarh and Udaipur districts of Rajasthan did not include SC
family planning, antenatal check-ups, delivery, distribution cost data as the ANMs were on indefinite strike during data
of zinc tablets and oral rehydration solution packets. ANMs collection. Actual financial expenditure for the IMI was not
were asked whether they missed such activities during IMI available for Patna district of Bihar but was imputed by an
because of regular IMI sessions in 1 week for consecutive average of similar districts’ financial expenditure. Data collec-
Downloaded from https://academic.oup.com/heapol/article/36/8/1316/6265953 by guest on 10 September 2021
4 months and whether their missed work was conducted by tion was also not possible from two sampled sub-districts in
someone else. The majority ANMs admitted that even if they East Champaran district of Bihar because of strike of ASHAs.
missed some routine activities, they had to cover those after In urban areas, a few activities during IMI (e.g. meeting)
the IMI week was over, as there was no substitute to perform might have happened at the urban health units. As the records
their missed work. It is well recognized that Indian health of such activities were not properly maintained in some of
system runs with severe shortage of manpower (Karan et al., those units, the team was unable to collect detailed data.
2019; World Health Organization, 2021). Proper planning Finally, our analysis excludes the value of time spent of non-
of IMI sessions could help deploy and utilize staff time more health sector staff, such as participants from the education
effectively. It would also be interesting to examine whether department.
other services delivered by ANMs were affected because
of IMI.
While comparing the routine immunization microplan Conclusion
before and after IMI, it was noted that there was a change in The IMI was a Government of India initiative to improve
routine microplan for only one ANM out of 28 sampled ANM immunization coverage in the country and it was solely
in Assam. In most of the sampled IMI districts in Assam, funded by the government. In the sampled states, the incre-
because of the seasonality of brick kiln activities and inaccessi- mental economic cost of the IMI ranged from US$0.49 million
bility of riverine areas, the ANMs utilized the IMI programme to US$40.08 million, with most of the cost at the SC level.
to reach those unreached pockets. Because of uncertainty in The incremental economic cost per IMI dose was found to
reaching the population groups, it is difficult for them to be higher than a recent routine immunization costing study,
include these areas under their routine microplan; hence, min- suggesting that it requires additional resources to immunize
imum change in their routine microplan was noticed after IMI. children through an intensified push in hard-to-reach areas.
At the same time, it is equally important to reach out to these To our knowledge, this is one of the first and largest studies
population whenever they are accessible. It will be the ANMs’ that document the incremental costs of scaling up immuniza-
initiatives to ensure that children in such hard-to-reach areas tion coverage through such an intensified effort. This analysis
are vaccinated. also showed a wide variation of the costs across states and
The low percentage change in routine microplan after IMI within states. The reasons of variation of unit costs of IMI
in other study states raises the concern about the sustainability across the study districts need to be evaluated further, but
of the effects of the IMI initiative. Even though several ANMs lower baseline coverage, high population density, geography
had mentioned that because of strong motivation during IMI, and terrain and vaccinating small numbers of children per ses-
children started coming in routine sessions after IMI, this sion could account for the range of findings. Further analysis
needs to be investigated further. A recent study used a quasi- is required to understand the determinants of cost variations
experimental approach to estimate the effects of IMI during of the IMI programme, which may aid in better planning and
the implementation period and subsequent 8 months to exam- more efficient use of resources for future intensified efforts.
ine whether the effects of IMI sustained after implementation
ended (Clarke-Deelder et al., 2021). The study found that
during IMI implementation there was improvement of immu-
Supplementary data
nization coverage; however, the improvement did not sustain
after implementation. This finding is in line with the current Supplementary data are available at Health Policy and
study finding of low percentage change in routine immuniza- Planning online.
tion microplan. This implies that efforts are required to ensure
that the additional children vaccinated during a special drive
like IMI are coming into the routine immunization sessions. Data availability statement
Data for this study will be publicly available on the Harvard
Limitations EPIC DataVerse Repository.
The following limitations of the study need to be noted. First,
our data collection began 6 months after IMI was conducted.
This could result in recall bias on the time spent for different Acknowledgements
activities related to IMI. To minimize this, whenever possi- We sincerely thank the Bill & Melinda Gates Foundation
ble, additional evidence was collected to verify time spent. For for funding this work (OPP1158709). We are grateful to1324 Health Policy and Planning, 2021, Vol. 36, No. 8
the state immunization officers of five study states: Dr B countries: a systematic review and simulation study. Value in Health
Goswami (Assam), Dr N K Sinha (Bihar), Dr S Jadhav (Maha- 22: 1146–53.
rashtra), Dr S K Garg (Rajasthan) and Dr A P Chaturvedi Clarke-Deelder E, Suharlim C, Chatterjee S et al. 2021. Impact
(Uttar Pradesh) and to district immunization officers and of campaign-style delivery of routine vaccines during Intensified
facility staff for their support and co-operation during data Mission Indradhanush in India: a controlled interrupted time-
series analysis. Health Policy and Planning 1–10, accessed 26
collection. Our special thanks to Dr Christian Suharlim and
April 2021.
William Lodge for their support in developing online data
Gurnani V, Haldar, P, Aggarwal MK et al. 2018. Improving vacci-
entry platform and data cleaning and Emma Clarke-Deelder
nation coverage in India: lessons from Intensified Mission Indrad-
and Ryoko Sato for statistical inputs. We are grateful to hanush, a cross-sectoral systems strengthening strategy. BMJ 363:
the 2019 International Health Economics Association (iHEA) k4782.
congress participants for their helpful comments. Finally, we International Institute for Population Sciences (IIPS) and ICF. 2017.
extend our deepest thanks to the data collection team, com- National Family Health Survey (NFHS-4), 2015-16: India. Mum-
prising Ritul Das, Utpal Chutia (Assam), Anjana Kumari bai: IIPS.
Downloaded from https://academic.oup.com/heapol/article/36/8/1316/6265953 by guest on 10 September 2021
and Vandana Bhaskar (Bihar, Rajasthan, and Uttar Pradesh), Karan A, Negandhi H, Nair R, Sharma A, Tiwari R. 2019. Size, com-
Amol More and Shailendra Gaikwad (Maharashtra). position and distribution of human resource for health in India: new
estimates using National Sample Survey and Registry data. BMJ
Ethical approval The study was approved by the Institutional Open 9: e025979.
Review Board of Harvard University (IRB18-0400) and Sigma Ministry of Health and Family Welfare, Government of India.
(10062/IRB/D/17-18). Comprehensive Multi-Year Plan, 2018-22. https://nhm.gov.in/
New_Updates_2018/NHM_Components/Immunization/Guildeline
s_for_immunization/cMYP_2018-2022_final_pdf, accessed 15
Conflict of interest statement LB and AR are the employees March 2021.
of the Bill & Melinda Gates Foundation. Munk C, Portnoy A, Suharlim C et al. 2019. Systematic review of the
costs and effectiveness of interventions to increase infant vaccination
coverage in low- and middle-income countries. BMC Health Services
Notes Research 19: 741.
1. Alternate vaccine delivery (AVD) is a vaccine delivery system intro- Ozawa S, Yemeke TT, Thompson KM. 2018. Systematic review of
duced by the government to deliver vaccines from the nearest cold the incremental costs of interventions that increase immunization
chain point to immunization session sites in each session day. coverage. Vaccine 36: 3641–9.
During IMI as well as routine immunization sessions, the person Pandey P, Sehgal AR, Riboud M, Levine D, Goyal M. 2007. Informing
responsible for AVD received US$1.1 per session and US$2.2 per resource-poor populations and the delivery of entitled health and
session in hard-to-reach areas for delivering vaccines. social services in rural India: a cluster randomized controlled trial.
2. An ASHA is a trained female community health worker acts as JAMA 298: 1867–75.
an interface between the public health system and community. Powell-Jackson T, Fabbri C, Dutt V, Tougher S, Singh K. 2018. Effect
Performance-based incentives are given to ASHAs for different and cost-effectiveness of educating mothers about childhood DPT
activities including immunization. During IMI, ASHAs received vaccination on immunisation uptake, knowledge, and perceptions in
Uttar Pradesh, India: a randomised controlled trial. PLoS Medicine
incentives for preparing due list of children, mobilizing the children
15: e1002519.
at session sites.
Rainey JJ, Bhatnagar P, Estivariz CF et al. 2009. Providing monovalent
oral polio vaccine type 1 to newborns: findings from a pilot birth-
dose project in Moradabad district, India. Bulletin of the World
References Health Organization 87: 955–9.
Banerjee AV, Duflo E, Glennerster R, Kothari D. 2010. Improving Resch S, Menzies N, Portnoy A et al. 2020. How to Cost
immunisation coverage in rural India: clustered randomised con- Immunization Programs: A Practical Guide on Primary Data
trolled evaluation of immunisation campaigns with and without Collection and Analysis. http://immunizationeconomics.org/recent-
incentives. BMJ 340: c2220. activity/2019howtocost, accessed 26 April 2021.
Brenzel L, Young D, Walker DG. 2015. Costs and financing of routine Rivera-Rodriguez CL, Resch S, Haneuse S. 2018. Quantifying and
immunization: approach and selected findings of a multi-country reducing statistical uncertainty in sample-based health program
study (EPIC). Vaccine 33: A13–20. costing studies in low- and middle-income countries. Sage Open
Chatterjee S, Das P, Nigam A et al. 2018. Variation in cost and per- Medicine 6: 1–7.
formance of routine immunisation service delivery in India. BMJ World Health Organization. The Health Work Force in India. Human
Global Health 3: e000794. Resources for Health Observer Series no. 16. 2016. https://
Clarke-Deelder E, Vassall A, Menzies NA. 2019. Estimators used www.who.int/hrh/resources/16058health_workforce_India.pdf,
in multisite healthcare costing studies in low- and middle-income accessed 15 March 2021.You can also read