Public finance of universal routine childhood immunization in India: district-level cost estimates
←
→
Page content transcription
If your browser does not render page correctly, please read the page content below
Health Policy and Planning, 00, 2021, 1–9
DOI: https://doi.org/10.1093/heapol/czab114
Advance access publication date: 15 September 2021
Original Article
Public finance of universal routine childhood immunization
in India: district-level cost estimates
Emily Schueller1 , Arindam Nandi1,2,* , Amit Summan1 , Susmita Chatterjee3,4,5 , Arindam Ray6 ,
Downloaded from https://academic.oup.com/heapol/advance-article/doi/10.1093/heapol/czab114/6370293 by guest on 29 October 2021
Pradeep Haldar7 and Ramanan Laxminarayan8,9
1
Center for Disease Dynamics, Economics & Policy, 5636 Connecticut Ave NW, PO Box 42735, Washington, DC 20015, USA
2
The Population Council, 1 Dag Hammarskjold Plaza, New York, NY 10017, USA
3
The George Institute for Global Health, 311-312, Third Floor, Elegance Tower, Plot No. 8, Jasola District Centre, New Delhi, India
4
University of New South Wales, Sydney NSW 2052, Australia
5
Prasanna School of Public Health, Manipal Academy of Higher Education, Madhav Nagar, Eshwar Nagar, Manipal, Karnataka 576104, India
6
Bill & Melinda Gates Foundation, India Country Office, Capital Court, 5th Floor, Olof Palme Marg, Munirka, New Delhi, Delhi 110067, India
7
Ministry of Health and Family Welfare, Government of India, Nirman Bhawan, New Delhi 110011, India
8
Center for Disease Dynamics, Economics & Policy, B-25, 3rd Floor, Lajpat Nagar 2, Lala Lajpat Rai Marg, New Delhi 110024, India
9
High Meadows Environmental Institute, Guyot Hall, Room 129, Princeton University, Princeton, NJ 08544, USA
*Corresponding author. The Population Council, 1 Dag Hammarskjold Plaza, New York, NY 10017, USA; Center for Disease Dynamics, Economics & Policy, 5636
Connecticut Ave NW, PO Box 42735, Washington, DC 20015, USA. E-mail: nandi@cddep.org
Accepted on 14 September 2021
Abstract
India’s Universal Immunization Programme (UIP) is among the largest routine childhood vaccination programmes in the world. However, only an
estimated 65% of Indian children under the age 2 years were fully vaccinated in 2019. We estimated the cost of raising childhood vaccination
coverage to a minimum of 90% in each district in India. We obtained vaccine price data from India’s comprehensive multi-year strategic plan for
immunization. Cost of vaccine delivery by district was derived from a 2018 field study in 24 districts. We used propensity score matching methods
to match the remaining Indian districts with these 24, based on indicators from the National Family Health Survey (2015–16). We assumed the
same unit cost of vaccine delivery in matched pair districts and estimated the total and incremental cost of providing routine vaccines to 90% of
the current cohort of children in each district. The estimated national cost of providing basic vaccinations—one dose each of Bacillus Calmette–
Guerin (BCG) and measles vaccines, and three doses each of oral polio (OPV) and diphtheria, pertussis and tetanus vaccines—was $784.91 million
(2020 US$). Considering all childhood vaccines included in UIP during 2018–22 (one dose each of BCG, hepatitis B and measles–rubella; four
doses of OPV; two doses of inactivated polio; and three doses each of rotavirus, pneumococcal and pentavalent vaccines), the estimated national
cost of vaccines and delivery to 90% of target children in each district was $1.73 billion. The 2018 UIP budget for vaccinating children, pregnant
women and adults was $1.17 billion (2020 US$). In comparison, $1.73 billion would be needed to vaccinate 90% of children in all Indian districts
with the recommended schedule of routine childhood vaccines. Additional costs for infrastructural investments and communication activities,
not incorporated in this study, may also be necessary.
Keywords: India, UIP, Universal Immunization Programme, cMYP
Introduction Government of India, 2017). Vaccines included in UIP are
India’s Universal Immunization Programme (UIP) began in provided by the Indian central government at no cost to the
1985 with the goal of vaccinating all pregnant women consumer.
and 85% of infants against six vaccine-preventable diseases Although UIP is among the largest childhood vaccina-
(VPDs) by 1990 (Lahariya, 2014). The programme was tion programmes in the world, with a target population of
expanded in 2011–17 with the introduction of Haemophilus ∼26 million children each year, large gaps in vaccination cov-
influenzae type b (Hib), rotavirus (RVV), measles–rubella erage persist. India’s full immunization coverage rate (defined
(MR), inactivated polio vaccine (IPV) and pneumococcal as the proportion of 12- to 23-month-old children who have
conjugate (PCV) vaccines. As of 2018, UIP included the received one dose each of the BCG and measles vaccines and
following childhood vaccines: oral polio vaccine (OPV), three doses each of OPV and DPTCV) was estimated at 65%
diphtheria–pertussis–tetanus conjugate vaccine (DPTCV), in 2019 (UNICEF, 2020), and the number of children who
Bacillus Calmette–Guérin (BCG), measles conjugate vac- received three doses of DPTCV (another commonly used mea-
cine (MCV), hepatitis B, pentavalent (DPTCV, hepatitis B sure of full vaccination status) was estimated at 91% (World
and Hib), IPV, RVV, MR, PCV and, in endemic areas, Health Organization, 2019). National coverage rates of indi-
Japanese encephalitis (Ministry of Health and Family Welfare, vidual vaccines were higher, at 92% for BCG, 90% for three
© The Author(s) 2021. Published by Oxford University Press in association with The London School of Hygiene and Tropical Medicine.
This is an Open Access article distributed under the terms of the Creative Commons Attribution License (https://creativecommons.org/licenses/by/4.0/),
which permits unrestricted reuse, distribution, and reproduction in any medium, provided the original work is properly cited.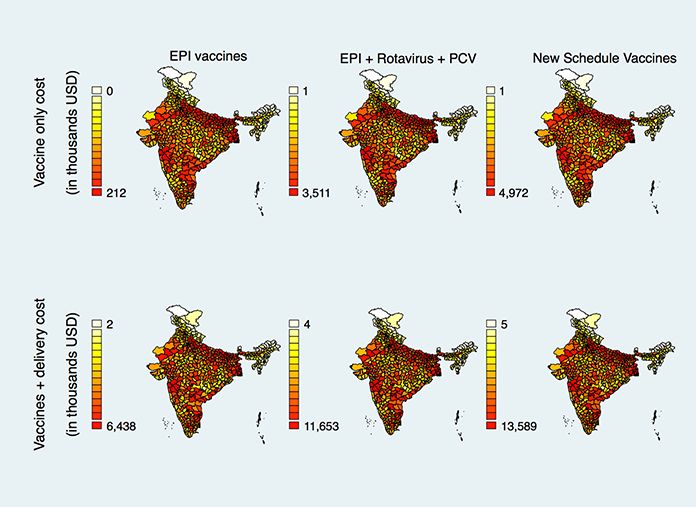
2                                                                                       Health Policy and Planning, 2021, Vol. 00, No. 0

                                                                           An assessment of the cost of full vaccination coverage in
    Key messages                                                       India, especially at the district and state levels, is needed
                                                                       to inform UIP budgeting and operations. Previous UIP bud-
     • While substantial progress toward universal child immu-         gets were based on the assumption that the average cost to
       nization in India has been made since the advent of the         vaccinate an Indian child would be constant over time and
       Universal Immunization Programme (UIP) in 1985, vaccina-        geography, considering only the national average expendi-
       tion rates vary greatly among Indian districts. There is also   ture on vaccines, personnel, equipment and other expenses
       heterogeneity in the cost of vaccination delivery between       (Chatterjee et al., 2016; 2018a). The 2013–17 comprehen-
       Indian districts and states.                                    sive multiyear plan (cMYP) assumed an average cost of $25
     • The estimated national cost of providing basic vaccinations

                                                                                                                                           Downloaded from https://academic.oup.com/heapol/advance-article/doi/10.1093/heapol/czab114/6370293 by guest on 29 October 2021
                                                                       (2017 US$) to immunize each Indian child with BCG, hepati-
       was 784.91 million US$ in 2020. The estimated national          tis B, OPV, DPTCV or pentavalent, and MCV vaccines, not
       cost of providing all vaccinations included in the Govern-      taking into account regional or local variation in the cost of
       ment of India’s schedule of routine childhood immunization      delivery (Ministry of Health and Family Welfare, 2014). A
       was $1.73 billion US$.                                          field study of the public cost of delivering routine vaccines in
     • To achieve universal immunization, the budget for India’s       24 districts across seven Indian states during 2013–14 found
       UIP should be increased from its 2020 level of 1.58 billion     substantial variation in average cost per DPTCV3-immunized
       US$. Variation in district- and state-level costs should be     child and per fully immunized child (Chatterjee et al., 2018a).
       taken into consideration when considering expenditure           These estimates were incorporated into budget estimates for
       needed to increase vaccination coverage in underserved          the 2018–22 cMYP (Ministry of Health and Family Welfare,
       areas.                                                          Government of India, 2017).
                                                                           To the best of our knowledge, this is the first study to
                                                                       estimate the district-level aggregate cost of universal child-
                                                                       hood vaccination coverage in India. We used data from the
doses of OPV, 91% for three doses of DPTCV and 95% for                 24-district field study (Chatterjee et al., 2018a) and other
one dose of MCV (World Health Organization, 2019). Birth               sources to estimate the cost of 90% full-immunization cover-
doses of OPV, DPTCV and BCG had the highest coverage                   age among children in each Indian district. We also estimated
rates, indicating that attrition remains a serious barrier to          the cost of 90% coverage of new vaccines—RVV, PCV, pen-
achieving full immunization coverage. Data from the 2015–16            tavalent, IPV and MR, with pentavalent and MR replacing
National Family Health Survey (NFHS-4)—the most recent                 DPTCV and MCV, respectively.
source of subnational data from all states—showed large vari-
ations across regions, with full immunization rates of 35.4%
in the state of Nagaland to 89% in the state of Punjab
(International Institute for Population Sciences, 2017).               Methods
   Gaps in vaccination coverage likely contribute to the con-          Data
tinued burden of VPDs in India. An estimated 1.2 million               We used data from the fourth round of the NFHS-4, which
Indian children under the age of 5 years die every year, the           was conducted in 2015–16 and represents the most recent
highest in the world (Liu et al., 2019). In 2015, VPDs such            data on childhood immunization in all Indian states and dis-
as pneumonia, diarrhoeal diseases, measles and meningitis              tricts (International Institute for Population Sciences, 2017).
accounted for >400 000 under-five deaths in India (Fadel               NFHS-4 collected data on a variety of health, educational,
et al., 2017). Under-five mortality varies greatly within the          socioeconomic and other metrics from a representative sam-
country: in 2015, the northeastern states saw an estimated             ple of 723 875 women from 601 509 households in all Indian
39.6 deaths per 1000 children aged 1–59 months, compared               states and territories. The survey covered all 640 districts of
with 9.97 deaths per 1000 in the southern states (Liu et al.,          India at the time of the survey in 2015–16. We matched newer
2019).                                                                 districts that were created after the survey and the new union
   To address the persistently low vaccination rates in                territory of Ladakh (created from Jammu and Kashmir in
rural and marginalized communities, the Indian government              2019) retrospectively with NFHS-4 district for this analysis.
launched the special immunization campaigns of Mission                 The fifth round of the survey (NFHS-5) is being completed in
Indradhanush in 2014 and Intensified Mission Indradhanush              2021, and data are not yet available for all states and districts
in 2017. These programmes redirected resources to districts            in India.
and urban areas with historically low vaccination rates to                District-wise vaccination rates for BCG, OPV, DPTCV,
vaccinate children who were not reached by routine immu-               MCV and hepatitis B were constructed from these data as the
nization services (Clarke-Deelder et al., 2021). Surveys were          proportion of 12- to 23-month-old children whose mothers or
conducted to identify children who had missed doses of                 vaccination cards indicated they had received each vaccine.
routine vaccines, and vaccination sessions were planned to             Full immunization was defined as the receipt of all vaccines
accommodate the families of these children. Mobile teams               in the Expanded Programme on Immunization (EPI) of the
were formed to provide vaccination sessions to children in             World Health Organization (WHO): one dose of the BCG
remote areas of targeted districts. Analyses of these pro-             and MCV vaccines, three doses of DPTCV and at least three
grammes indicate that MI increased the full immunization               doses of OPV. Although DPTCV has been recently replaced
coverage rate in targeted districts by 27% (Summan et al.,             by the pentavalent vaccine, we included DPTCV in our anal-
2021), and IMI increased full immunization coverage by                 ysis of EPI vaccines to demonstrate the cost of achieving full
10.6–18.5% (Gurnani et al., 2018; Clarke-Deelder et al.,               immunization coverage under the WHO definition (Ministry
2021), but this effect did not persist 8 months after implemen-        of Health and Family Welfare, Government of India, 2017).
tation (Clarke-Deelder et al., 2021).                                  The rollout of the pentavalent vaccine began in selected
Health Policy and Planning, 2021, Vol. 00, No. 0 3
states prior to NFHS-4 but it was uneven, and NFHS-4 col- probability of intervention assignment [in our case, inclu-
lected data on DPTCV vaccination rather than vaccination sion in the Chatterjee et al.’s (2018a) study]. The predicted
with the pentavalent vaccine. We assumed that only DPTCV probability—known as the propensity score—can be used
and not pentavalent vaccine was given in our baseline of to match districts in the Chatterjee et al.’s (2018a) study to
already-vaccinated children. Additionally, we assumed zero the remaining districts of India, which were observationally
percent coverage of PCV and RVV, which have recently been similar but not included in the study.
introduced into UIP for all Indian states. First, we created a binary indicator to identify districts
Using NFHS-4 data, we estimated the size of the 12- to 23- in the field study. This indicator was then regressed, using
month-old age cohort in each district as a proportion of the a probit model, on a set of district-level indicators: average
Downloaded from https://academic.oup.com/heapol/advance-article/doi/10.1093/heapol/czab114/6370293 by guest on 29 October 2021
district and national populations. This relative cohort size was household size, age of the household head and proportions
used in conjunction with 2020 national population estimates of households from rural areas, those belonging to socioeco-
from the United Nations Population Division to estimate the nomically disadvantaged groups (Scheduled Caste, Scheduled
number of children under the age 2 years in each district in Tribe, and Other Backwards Classes), religion (Hindu, Mus-
2020 (United Nations, Department of Economic and Social lim, Christian and Sikh), those without access to sanitation
Affairs, Population Division, 2019). and those with a female household head. Household stan-
Vaccination delivery cost estimates per dose and per fully dard of living was captured through quintiles of a composite
immunized child were obtained from a field study (Chatterjee national index of ownership of assets such as TV, radio, bicy-
et al., 2018a) that covered a representative sample of 255 pri- cle and car (Pollitt et al., 1993; Filmer and Pritchett, 2001).
mary, secondary and tertiary public health facilities across 24 Covariates also included average age of the district popula-
districts in Bihar, Gujarat, Kerala, Meghalaya, Punjab, Uttar tion, proportion of women in the district, average years of
Pradesh and West Bengal. Microcost data on vaccines and schooling completed by mothers of under-five children, pro-
supplies, personnel, training, transport, overhead expenses portion of under-two children who were fully immunized and
and capital expenditures, such as cold chain infrastructure proportion of children who received most vaccines in a gov-
and vehicles, were collected during 2013–14 from each facil- ernment facility. For each district not included in Chatterjee
ity. These data were used to estimate the cost per fully et al.’s (2018a) study, we used the predicted probability
immunized child and cost per dose of delivering each vaccine from this regression (propensity score) to match it with the
(Chatterjee et al., 2018a). The costs of social mobilization, district in Chatterjee et al.’s (2018a) study that had the clos-
communication and various demand-side activities were out- est propensity score (one-to-one nearest neighbour matching
side the scope of this study, as district-level unit costs of these with replacement). After matching, we assumed that the unit
activities have not been estimated. cost of delivering vaccines in that district was the same as that
We obtained prices for individual vaccines (BCG, DPTCV, in its matched counterpart from Chatterjee et al.’s (2018a)
OPV, MCV, hepatitis B, RVV, PCV, IPV, MR and pen- study.
tavalent vaccines) from the 2018–22 cMYP (Ministry of We estimated four cost indicators at the district and state
Health and Family Welfare, Government of India, 2017). levels for 2020: (1) the cost of delivering only vaccines
We also obtained wastage rates for each vaccine from cMYP (excluding all other supplies, personnel and equipment) to
2018–22 (Ministry of Health and Family Welfare, Govern- 90% of 12- to 23-month-old children (target children); (2)
ment of India, 2017) and assumed these to be uniform the incremental cost of delivering vaccines to undervaccinated
throughout India. Costs were converted to January 2020 children, where the rate of undervaccination was defined as
INR using consumer price index data (Organization for the difference between 90% coverage and the district’s vac-
Economic Co-operation and Development, 2020) and to USD cination coverage level for a given vaccine; (3) the full cost
using the International Monetary Fund’s reported exchange (inclusive of supplies, personnel, etc.) of vaccinating 90% of
rate (US$1 = INR 71.5) on 31 January 2020 (International the target children in each district and (4) the incremental
Monetary Fund, 2020). cost of fully vaccinating the undervaccinated children in each
district.
Statistical analysis We estimated the four cost indicators for the EPI vaccines
We used propensity score matching to pair 616 districts for (BCG, DPTCV, MCV and OPV). In additional analyses, we
which vaccine delivery unit costs were not available with estimated these indicators after including RVV and PCV (i.e.
one of the 24 districts covered under an earlier field study those vaccines currently being rolled out nationwide) along
(Rosenbaum and Rubin, 1983; Heckman et al., 1997; Dehejia with the EPI vaccines. Finally, we computed a third set of
and Wahba, 1999; 2002; Chatterjee et al., 2018a). In observa- cost estimates by including the full set of vaccines that were
tional studies, matching based on propensity scores is a widely due to be included under UIP nationwide by the end of 2019
used technique for reducing potential differences in the char- (cMYP 2018–22) (Ministry of Health and Family Welfare,
acteristics of two groups (e.g. intervention and control groups Government of India, 2017): one dose of BCG, four doses
in a cohort study), which might affect the outcome. Match- of OPV, one dose of hepatitis B, three doses of pentavalent,
ing over the entire joint distribution of characteristics (or two doses of IPV, three doses of RVV, three doses of PCV and
covariates) could lead to the so-called dimensionality prob- one dose of MR vaccine (Table 1). All vaccine prices paid by
lem where some subgroups of the data may have very few UIP were taken from cMYP 2018–22 (Ministry of Health and
or no observations. For example, a within-state matching of Family Welfare, Government of India, 2017) and converted to
Chatterjee et al.’s (2018a) study districts with the remain- 2020 US$. In calculating the costs of providing only vaccines,
ing districts would not be possible for states not covered in we included the cost of each vaccine and its wastage rate.
the study. Propensity score matching reduces the dimension Delivery costs (without vaccine price) were taken from the
from many covariates to a single indicator—the predicted 2018 field study, and they included cost per fully immunized4 Health Policy and Planning, 2021, Vol. 00, No. 0
Table 1. Vaccination scenarios Pradesh contained the districts with the lowest district-level
vaccination rates for BCG (28%), DPTCV1 (25%), DPTCV2
cMYP 2018–22 (19%) and measles (19%) vaccines; the large northern state of
schedule vaccines
EPI vaccines plus (new schedule
Uttar Pradesh accounted for districts with the lowest district
EPI vaccines only RVV and PCV vaccines) vaccination rate for DPTCV3 (14%).
BCG (one dose) BCG (one dose) BCG (one dose)
OPV (four doses) OPV (four doses) OPV (four doses) Estimated cost of achieving 90% coverage
MCV (one dose) MCV (one dose) MR vaccine (one (vaccines only)
dose)
Considering only the price of vaccines (including wastage fac-
Downloaded from https://academic.oup.com/heapol/advance-article/doi/10.1093/heapol/czab114/6370293 by guest on 29 October 2021
DPTCV (three doses) DPTCV (three doses) Pentavalent vaccine
(three doses) tors) and excluding personnel, equipment and other expenses
RVV (three doses) RVV (three doses) associated with their delivery, we estimated the cost of provid-
PCV (three doses) PCV (three doses) ing EPI (BCG, OPV, DPTCV and measles) vaccines to 90%
IPV (two doses) of target children in every district at a total of $21.43 million
Birth dose hepatitis B (Table 2, Column 2). District-level costs ranged from $56
(one dose)
in Dibang Valley district, Arunachal Pradesh, to $212 024
Note: BCG = Bacillus Calmette–Guérin; OPV = oral polio vaccine; MCV = in Thane district, Maharashtra, and were driven by a large
measles conjugate vaccine; DPTCV = diphtheria, pertussis, tetanus con- variation in population between districts (Figure 1 and Sup-
jugate vaccine; RVV = rotavirus vaccine; IPV = inactivated polio vaccine;
MR = measles–rubella; PCV = pneumococcal conjugate vaccine. Pentava- plementary Appendix Table A9).
lent vaccine includes diphtheria, pertussis, tetanus, hepatitis B and Hib. When RVV and PCV were included, the national cost of
90% vaccine coverage was estimated to be $354.92 million,
and the cost of 90% vaccine coverage of the full cMYP 2018–
child and cost per dose of vaccine delivered in each district
22 schedule of vaccines was estimated at $502.55 million
(Chatterjee et al., 2018a). We added delivery cost per fully
(Table 2, Column 2). The cost of 90% vaccine coverage of
immunized child to the price of EPI vaccines to construct vac-
the full cMYP schedule ranged from $1305 in Dibang Valley
cine and delivery costs for EPI vaccines. For other scenarios,
district, Arunachal Pradesh, to $4.97 million in Thane dis-
we used delivery cost per dose and individual vaccine prices
trict, Maharashtra (Figure 1 and Supplementary Appendix
to calculate the additional cost of vaccinating children with
Table A11).
RVV, PCV and IPV. Construction of vaccine only costs is
illustrated in Supplementary Appendix Tables A1 and A2,
and construction of vaccine and delivery costs is shown in Incremental cost of achieving 90% coverage
Supplementary Appendix Tables A2 and A3. (vaccines only)
For constructing incremental costs under the cMYP 2018– Again considering only the price of vaccines (including
22 schedule (full set of new vaccines), we assumed that there wastage factors) and excluding expenses associated with
would be no additional delivery cost to replace DPTCV with delivery, the national estimated cost of increasing coverage of
pentavalent vaccine, i.e. that the delivery cost for a dose of EPI vaccines from NFHS-4 levels to 90% in each Indian dis-
pentavalent vaccine is equivalent to that for DPTCV. There- trict was $2.14 million (Table 2, Column 4). In 59 districts,
fore, we took baseline coverage rates for the first, second and vaccination rates for all four vaccines were already above
third doses of DPTCV from NFHS-4 and assumed the cost 90%, and there was no unmet need for EPI vaccines. (This
difference between pentavalent vaccine and DPTCV would does not necessarily translate to a full immunization coverage
be the only additional cost in replacing DPTCV with pentava-
lent in the population that has received DPTCV. Similarly, we
assumed the only additional cost of replacing MCV with MR
vaccine would be the price difference between MCV and MR
vaccines, and we used the baseline coverage rate for MCV to
calculate incremental costs for MR vaccine. For RVV, PCV
and IPV, we assumed a baseline coverage of zero. We did not
include Japanese encephalitis vaccine in our analysis because
it is given to children in endemic districts only (Muniaraj and
Rajamannar, 2019). Additional details of cost construction
are presented in Supplementary Appendix Tables A1–A4.
Results
National cost estimates are presented in Table 2. Detailed
state-level estimates are presented in Supplementary Appendix
Tables A5 through A8, and district-level estimates are shown
in Supplementary Appendix Tables A9 through A11. All cost
estimates are presented in 2020 US$.
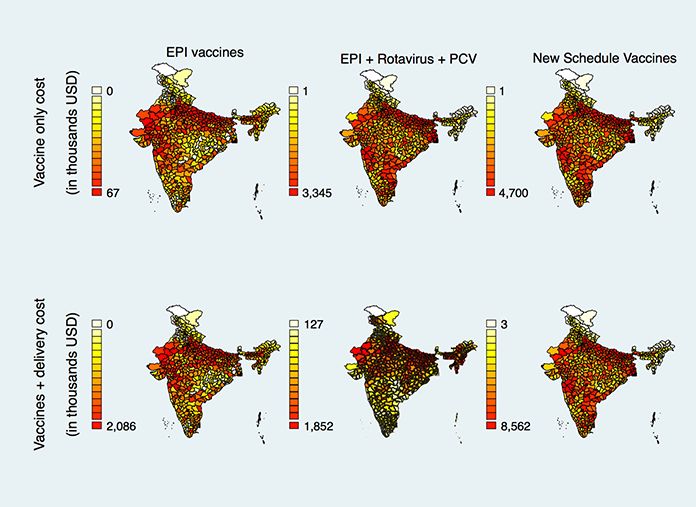
Figure 1. Estimated cost (2020 US$) of 90% coverage of routine
vaccines among 12- to 23-month-old Indian children, by district
District vaccination rates Note: Estimates are in 2020 US$, with reference to a baseline of no coverage.
EPI vaccines include BCG, DPTCV, OPV and MCV. New schedule vaccines
Vaccination rates varied widely across districts, even within include BCG, OPV, IPV, PCV, MR, RVV, Hep B birth dose and Hib-containing
the same state. The small northeastern state of Arunachal pentavalent.Health Policy and Planning, 2021, Vol. 00, No. 0 5
Table 2. Estimated cost (2020 US$) of 90% coverage of vaccines among 12- to 23-month-old Indian children in all districts
Incremental cost, current Incremental cost, current
Cost of 90% coverage, Cost of 90% coverage, coverage to 90%, vaccine coverage to 90%, vaccine
Scenario vaccine only vaccine and delivery only and delivery
EPI vaccines only 21 432 537 784 910 044 2 136 163 51 217 951
EPI vaccines, RVV and 354 917 164 1 466 697 524 335 620 801 733 005 419
PCV
New cMYP schedule 502 548 302 1 730 429 635 471 543 840 1 055 728 860
vaccines
Downloaded from https://academic.oup.com/heapol/advance-article/doi/10.1093/heapol/czab114/6370293 by guest on 29 October 2021
Note: EPI vaccines include one dose each of BCG and MCV, three doses of DPTCV and at least three doses of OPV. New cMYP schedule vaccines include
one dose of BCG, four doses of OPV, one dose of hepatitis B, three doses of pentavalent, two doses of IPV, three doses of RVV, three doses of PCV and one
dose of measles–rubella vaccine. Current coverage was calculated from NFHS-4 (2015–16) data.
district, Arunachal Pradesh, which had an average cost of
$20.23 to vaccinate a child with EPI vaccines, to $6.44 million
in Allahabad (now Prayagraj) district, Uttar Pradesh, with
an average unit cost of $53.65 (Figure 1 and Supplementary
Appendix Table A9). When we included vaccine and delivery
costs for RVV and PCV in the analysis, the national cost of
90% coverage was estimated to be $1.47 billion (Table 2, Col-
umn 3). The cost of vaccinating 90% of children in all districts
with the cMYP 2018–22 schedule of vaccines was estimated at
$1.73 billion nationally (Table 2, Column 3) and ranged from
$5311 in Upper Siang district, Arunachal Pradesh, with a cost
of $54.58 per child, to $13.59 million in Allahabad (Praya-
graj) district, Uttar Pradesh, with a unit cost of $113.23 per
child (Figure 1 and Supplementary Appendix Table A11).
Incremental cost of achieving 90% coverage
Figure 2. Estimated cost (2020 US$) of 90% incremental coverage of
routine vaccines among 12- to 23-month-old Indian children, by district (vaccines plus delivery)
Note: Estimates are in 2020 US$, with reference to a baseline of no coverage. Weighted average delivery cost per dose ranged from $1.00
EPI vaccines include BCG, DPTCV, OPV and MCV. New schedule vaccines in Lucknow district, Uttar Pradesh, to $4.82 in Banaskan-
include BCG, OPV, IPV, PCV, MR, RVV, Hep B birth dose and Hib-containing
pentavalent. tha district, Gujarat, in the 2018 field study (Chatterjee et al.,
2018a). We estimated the national cost of raising EPI vac-
cination rates to 90% from the NFHS-4 baseline in every
rate of 90% in these districts, since children may have received district at $51.22 million (Table 2, Column 5). Excluding the
some vaccines and not others.) Of districts with vaccination 59 districts that had vaccination rates above 90%, this cost
rates below 90%, the estimated cost of vaccines was the high- ranged from $11 in North District, Sikkim, to $2.09 million
est at $66 961 in Bahraich district, Uttar Pradesh, which in Bahraich district, Uttar Pradesh (Figure 2 and Supplemen-
had a full immunization coverage rate of 9% and an esti- tary Appendix Table A9). When RVV and PCV were included,
mated unmet need for 560 398 doses of BCG, DPTCV, MCV the estimated national cost of closing the vaccination gap was
and OPV vaccines (Figure 2 and Supplementary Appendix $733 million (Table 2, Column 5). The estimated cost of clos-
Table A9). With the addition of RVV and PCV, the national ing the vaccination gap for the cMYP 2018–22 schedule was
incremental cost from a zero baseline was $335.62 million $1.06 billion (Table 2, Column 5), ranging from $3385 in
(Table 2, Column 4). The incremental national cost for the Dibang Valley district, Arunachal Pradesh, to $8.56 million
full cMYP 2018–22 schedule of vaccines was $471.54 million in Allahabad (Prayagraj) district, Uttar Pradesh (Figure 2 and
(Table 2, Column 4), which ranged from $1232 in Supplementary Appendix Table A11).
Dibang Valley district, Arunachal Pradesh, to $4.7 million in
Thane, Maharashtra (Figure 2 and Supplementary Appendix Sensitivity analysis: exchange rates and scaling up
Table A11.
The INR–USD exchange rate increased from 71.5 in Jan-
uary 2020 to 75.1 in April 2020 (rate of the last day of
Estimated cost of achieving 90% coverage the month), coinciding with the coronavirus disease 2019
(vaccines plus delivery) (COVID-19) pandemic. Using the April rate, national costs
The weighted average cost of vaccination per fully immu- (vaccines and delivery) to achieve 90% vaccination coverage
nized child (inclusive of vaccines, supplies, personnel and in all Indian districts for EPI vaccines only, EPI vaccines with
other expenses) varied widely among districts, from $12.43 PCV and RVV, and the new schedule of vaccines would be
to $55.36. Assuming the same unit costs for the matched $742.83 million, $1.39 billion and $1.64 billion, respectively.
pairs, the national cost of vaccinating 90% of children with Incremental national costs (vaccines and delivery) to achieve
the EPI vaccines was estimated to be $784.91 million (Table 2, 90% vaccination coverage from NFHS-4 rates for EPI vac-
Column 3). This cost ranged from $1968 in Upper Siang cines only, EPI vaccines with PCV and RVV, and the new6 Health Policy and Planning, 2021, Vol. 00, No. 0
schedule of vaccines were $48.47 million, $693.71 million 90% vaccination rates for EPI vaccines in all districts. Com-
and $999.13 million, respectively. paratively, the newly introduced vaccines PCV and RVV cost
We also analysed the cost of closing the vaccination gap $3.10 per dose and $1.19 per dose, respectively, and the UIP
over 4 years, using NFHS-4 coverage rates and 2020 Indian schedule necessitates three doses of each vaccine. We assumed
population estimates as a baseline. Using predicted population a baseline coverage rate of zero for these vaccines as they
growth in each Indian state and union territory from 2020 have been introduced recently. Therefore, the introduction of
to 2024, we calculated the undervaccinated population for PCV alone will cost $227 million for the entire target pop-
each dose of the EPI and new vaccine schedules. We then esti- ulation, and the cost of providing PCV and RVV to 90%
mated the cost of vaccination (vaccines and delivery) to 25% of children in all districts constitutes a large majority of the
Downloaded from https://academic.oup.com/heapol/advance-article/doi/10.1093/heapol/czab114/6370293 by guest on 29 October 2021
of this population in 2021, 50% in 2022, 75% in 2023 and incremental national cost for EPI vaccines, RVV and PCV.
the entire undervaccinated population in 2024. The total cost In addition to the high costs of RVV and PCV vaccines, the
from 2021 to 2024 was $131.83 million for EPI vaccines and new cMYP schedule has introduced two doses of IPV, which
$2.88 billion for the new schedule vaccines, using the January costs $1.51 per dose, and replaces DPTCV and MCV with
2020 exchange rate (Supplementary Appendix Table A8). the more expensive pentavalent and MR vaccines. Delivery
costs for the introduction of eight new doses (three doses of
RVV, three doses of PCV and two doses of IPV) account for an
Discussion additional $464 million for the national population. Although
expensive, these vaccines are expected to have a large benefit
Barriers to vaccination vary widely throughout India, and in a country where in 2015, 192 000 children under 5 years of
geographic and socioeconomic disparities in vaccination rates age were estimated to have died of pneumococcal pneumonia
persist across localities, even within states (Barman and (Wahl et al., 2020).
Partha, 2017). Various studies have found that socioeconomic
We found substantial variation in district-level costs driven
status, membership in a religious or ethnic minority and living
by differences in population, delivery costs and vaccina-
in a rural or slum area are associated with the lower likelihood
tion rates. The population of Indian children aged 0–
of vaccination (Singh, 2013; Shrivastwa et al., 2015; Zuhair
6 years (2011 census) ranged from 1084 in Dibang Val-
and Roy, 2017; Francis et al., 2018). Immunization special
ley district, Arunachal Pradesh, (Directorate of Census
drives such as Mission Indradhanush and Intensified Mission
Operations, Arunachal Pradesh, 2014) to 1 327 146 in Thane
Indradhanush have succeeded in increasing vaccination rates
district, Maharashtra (Directorate of Census Operations,
in underserved districts (Gurnani et al., 2018; Clarke-Deelder
Maharashtra, 2014), and these districts had the lowest and
et al., 2021; Summan et al., 2021). A study of IMI costs in
highest costs, respectively, in our vaccine-only scenarios.
five Indian states found very high per-dose and per-vaccinated
When we also considered the cost of delivery, the varying costs
child costs, particularly in the large state of Maharashtra
of delivery per fully immunized child and per dose affected the
(Chatterjee et al., 2021). Factors driving these high costs com-
district-level estimates, but the population continued to play
pared with routine immunization include large labour costs
a substantial role in variation between districts. Upper Siang
for healthcare workers, extensive household surveys to locate
district, Arunachal Pradesh, was the second-least populated
missed children, local planning meetings to set up temporary
district and had the lowest costs for vaccines and delivery.
vaccination sites and transportation to areas such as islands
However, Allahabad district, Uttar Pradesh, had the highest
and plantations that are often inaccessible (Chatterjee et al.,
costs for vaccines and delivery despite its status as the 15th
2021).
most populated district in the country. This was due to the
MI and IMI have demonstrated that vaccination rates can
high per-dose and per-fully-immunized child cost of delivery
be improved in the short term through concerted effort and
in the district—although other districts were more populous
coordinated activities (Summan et al., 2021). However, the
cost of achieving these short-term goals is high, given the cost than Allahabad, low unit costs of vaccine delivery resulted in
of labour and planning to reach missed children, as well as lower aggregate costs in those districts. This variation high-
the logistical challenges of reallocating resources across states lights the importance of regional and district-level differences
(Chatterjee et al., 2021; Clarke-Deelder et al., 2021). Achiev- in vaccine delivery costs, as they can play a large role in
ing and sustaining high levels of immunization coverage will funding needs for large districts.
require investments such as the establishment of permanent or Total baseline UIP expenditure in 2017–18, inclusive of
seasonal clinics in underserved areas. Cost-effective demand- adult vaccination, supplemental immunization activities and
side activities are also essential, as the high costs of locating social mobilization, was $1.13 billion (2020 US$), calculated
children with missed vaccine doses are not feasible in a routine with an assumed national average cost of $25 (2017 US$)
immunization programme. Fixed costs of establishing local per child. Although projected UIP expenditure increased to
clinics, training staff and generating demand are not included $1.58 billion for 2020, we found the portion of this expen-
in our analysis but will play an essential role in gradually diture dedicated to routine immunization of children under
expanding immunization coverage in India. 12 months ($1.17 billion, 2020 US$) to be insufficient for vac-
The vaccines included in the EPI schedule are basic and cinating children against the nine VPDs evaluated here. By
inexpensive. The total price of vaccine doses needed to vacci- our estimates, fully vaccinating 90% of children in all Indian
nate one child with the entire EPI schedule (one dose of BCG, districts with BCG, hepatitis B, pentavalent, OPV, IPV, MR,
three doses of DPTCV, four doses of OPV and one dose of RVV and PCV vaccines will cost ∼ $1.73 billion for the 2020
MCV) adds up toHealth Policy and Planning, 2021, Vol. 00, No. 0 7
(including EPI vaccines; booster doses; tetanus toxoid for Chatterjee et al. used and cited in our paper is the most com-
pregnant women; Japanese encephalitis vaccine in endemic prehensive effort to date, estimating vaccination costs across
districts; and PCV, RVV and MR in states where they had several locations and facility types and stratified according
been introduced) accounted for $208 million in 2017, of to geographic location and level of development (Chatterjee
which Gavi and other partners contributed 47% (Ministry et al., 2018a). However, those estimates were limited in
of Health and Family Welfare, Government of India, 2017). scope: they included only 7 states and 24 districts from India’s
The high cost of new vaccines such as PCV will necessitate 29 states and 640 districts. Transportation costs, density of
higher spending by the Indian government as partner sup- immunization facilities, accessibility of healthcare workers
port is reduced. This is reflected in cMYP 2018–22, which and other factors have a large influence on vaccination costs
Downloaded from https://academic.oup.com/heapol/advance-article/doi/10.1093/heapol/czab114/6370293 by guest on 29 October 2021
projects a 111% increase in expenditures on vaccines and (Chatterjee et al., 2018b), but accurate and representative
an 80% increase in total immunization expenditures between data for these costs across India are lacking.
2017 and 2022 (Ministry of Health and Family Welfare, Analysis of the determinants of vaccination cost has sug-
Government of India, 2017). gested that the costs of scaling up immunization coverage
Our estimates for the cost of vaccinating 90% of tar- do not follow a predictable curve and that the marginal
get children are higher than projected government expendi- cost of increasing coverage may vary based on local factors
ture because we used district-level cost estimates rather than (Chatterjee et al., 2021). Furthermore, the introduction of
national or state estimates. Whereas the national per-dose cost new vaccines into UIP will likely necessitate additional costs in
of vaccine delivery was $2.37 (2020 US$), district unit costs the form of social mobilization, advocacy, training of health-
ranged from $0.97 in Lucknow, Uttar Pradesh, to $4.73 in care workers and communication to effectively increase the
Banaskantha, Gujarat (Chatterjee et al., 2018a). Although uptake of the new vaccines. The cost of training has been built
only one-third of the 24 districts with cost estimates available into delivery costs in our estimates, but the cost of specialized
had per-dose delivery costs above the national average, more training and social mobilization for new vaccines specifically
than half of all districts were assigned district costs above has not yet been fully quantified at the subnational level in
the national average through propensity score matching. The India. A new study from five Indian states has estimated
large proportion of matched districts with high delivery costs the cost of communication and social mobilization under the
suggests that previous national estimates of vaccination costs Intensified Mission Indradhanush campaign to range from
may underestimate the true cost of vaccine delivery in many 12.6% to 35.6% of the total cost (Clarke-Deelder et al.,
districts. 2021). If we assumed similar additional costs for increasing
Our analysis was limited by the availability of data on coverage under the UIP, the national cost of 90% coverage of
both vaccination rates and the variable cost of vaccination. EPI vaccines (including delivery) would be $883.81 million–
District-level estimates of vaccination coverage in India are $1.06 billion, while 90% coverage of cMYP 2018–22 sched-
based on large and standardized household surveys such as ule of vaccines would cost $1.95–$2.35 billion. Additional
the NFHS, which are available at 5-yearly or longer intervals. microcosting studies may be required to gain a more compre-
Vaccination policies and programmes in India have evolved hensive national and subnational cost of UIP.
since the NFHS-4 survey in 2015–16, with the introduction of Studies of immunization financing in other low- and
several new vaccines and the introduction of Mission Indrad- middle-income countries (LMICs) show that vaccines consti-
hanush and Intensified Mission Indradhanush (Ministry of tute at least 40% expenses and variable costs that also include
Health and Family Welfare, Government of India, 2017). labour and supplies account for up to 98% of immunization
The fifth round of NFHS, planned for 2018–19, has been costs (Sarker et al., 2018; Sim et al., 2021). However, analyses
delayed due to the COVID-19 pandemic but is likely to pro- vary in their inclusion of facility costs, and many programmes
vide a more accurate estimate of the current state of the child rely on temporary immunization facilities rather than health-
vaccination coverage in India. At present, NFHS-5 summary care facilities. An analysis of six LMICs found that small-scale
statistics on immunization coverage have been released for 22 vaccination sites had substantial variation in average costs and
states and Union Territories and are therefore not available for had higher average costs than large-scale sites, indicating a
an aggregate analysis of district-level costs in all Indian dis- larger fixed cost (e.g. building health facilities) required for
tricts. NFHS-5 summary sheets do not provide data on every reaching underserved or rural communities (Menzies et al.,
dose of vaccine administered and do not provide estimates 2012). Our analysis partially incorporates the additional fixed
of children who received one or two doses of OPV, DPTCV, costs of scaling up routine immunization in areas that may
pentavalent vaccine, etc. or estimates of PCV or IPV coverage. require infrastructural investments. Chatterjee et al.’s (2018a)
Additionally, district-level information on the socioeconomic study covered a range of districts that had full immuniza-
characteristics we used for matching districts are not yet avail- tion rates from below 50% (e.g. in Bihar) to over 90% (e.g.
able from NFHS-5. Given these constraints, NFHS-4 is the in Punjab). The unit costs from the high-coverage districts
most recent available complete data set of vaccination in all in Chatterjee et al.’s (2018a) study and their matched coun-
Indian districts. Our baseline district-wise vaccination rates terparts among the remaining districts of India may already
could be underestimates because of the potential gains made reflect past infrastructural investments. Due to the lack of
between 2016 and 2020, as estimated by two recent survey data, we could not model these fixed costs separately in our
studies of Mission Indradhanush (Pramanik et al., 2016) and analysis. Initially, the fixed costs may increase the cost of
Intensified Mission Indradhanush (Gurnani et al., 2018). immunization in underserved areas, although such invest-
Previous studies have estimated the cost of vaccination in ments will likely decrease the unit cost of vaccination over the
one Indian locality or state, presenting estimates that vary sub- long term. Improvements in digital recordkeeping of vaccine
stantially based on geography and facility type (Rheingans stocks through the Electronic Vaccine Intelligence Network
et al., 2014; Prinja et al., 2017; 2018). The 2018 study by (Ministry of Health and Family Welfare, Government of8 Health Policy and Planning, 2021, Vol. 00, No. 0
India, 2018) and other health system–strengthening initiatives Government of India. All other authors declare no conflict of
will likely reduce marginal costs to some degree, although interest.
this may be offset by increased costs of last-mile delivery, as
indicated by the high costs of IMI (Chatterjee et al., 2021).
Finally, the COVID-19 pandemic has increased the cost Author contributions
of routine vaccination. WHO-recommended practices for A.N. and R.L. designed the study. E.S. and A.N. collected the
conducting vaccinations during the pandemic include train- data, conducted the analysis and wrote the first version of the
ing on infection prevention and control, fewer children manuscript. All authors interpreted the findings and critically
per immunization session, screening for possible illness and evaluated and edited the manuscript. All authors approved
Downloaded from https://academic.oup.com/heapol/advance-article/doi/10.1093/heapol/czab114/6370293 by guest on 29 October 2021
personal protective equipment (World Health Organization, the final draft for publication.
2020). Implementing such modifications is estimated to cost
$6000–$15 000 per facility for the first year of the pandemic
(Portnoy and Resch, 2020). While the long-term impact of References
the COVID-19 pandemic on immunization programmes is
Barman S, Partha D. 2017. Socio-economic inequality of child immu-
unknown, the combination of high costs for recommended
nization in the eastern and north-eastern states of India. Demogra-
interventions and the large number of children requiring phy India 16–26.
catch-up vaccinations (UNICEF, 2021) will present challenges Chatterjee S, Das P, Nigam A et al. 2018a. Variation in cost and per-
for national immunization programmes in the coming years. formance of routine immunisation service delivery in India. BMJ
Lessons from IMI may prove useful in increasing catch-up vac- Global Health 3: e000794.
cination rates after the COVID-19 pandemic wanes (Gurnani Chatterjee S, Das P, Pinheiro A et al. 2021. The incremental cost of
et al., 2018). improving immunization coverage in India through the Intensified
Mission Indradhanush programme. Health Policy and Planning 36.
Chatterjee S, Ghosh A, Das P, Menzies NA, Laxminarayan R. 2018b.
Conclusion Determinants of cost of routine immunization programme in India.
Vaccine 36: 3836–41.
Our study is the first to provide comprehensive national, state Chatterjee S, Pant M, Haldar P, Aggarwal MK, Laxminarayan R. 2016.
and district-level estimates of the government cost of provid- Current costs & projected financial needs of India’s Universal Immu-
ing a near-universal 90% coverage of child vaccinations in nization Programme. The Indian Journal of Medical Research 143:
India. We found that the expenditure necessary to achieve 801–8.
this target in all districts ($1.73 billion) exceeds the 2020 bud- Clarke-Deelder E, Suharlim C, Chatterjee S et al. 2021. Impact of
get for India’s immunization programme. Future UIP budgets campaign-style delivery of routine vaccines: a quasi-experimental
should consider the high levels of variation in the district-level evaluation using routine health services data in India. Health Policy
cost of delivering vaccines. and Planning 36: 454–63.
Dehejia RH, Wahba S. 1999. Causal effects in nonexperimental stud-
ies: reevaluating the evaluation of training programs. Journal of the
American Statistical Association 94: 1053–62.
Supplementary data Dehejia RH, Wahba S. 2002. Propensity score-matching methods for
Supplementary data are available at Health Policy and nonexperimental causal studies. The Review of Economics and
Planning online. Statistics 84: 151–61.
Directorate of Census Operations, Arunachal Pradesh. 2014. District
Census Handbook: Dibang Valley. No. 13. New Delhi: Census of
Data availability statement India 2011.
Directorate of Census Operations, Maharashtra. 2014. District Census
The data underlying this article are publicly available Handbook, Thane. No. 28. Mumbai: Registrar General and Census
from the Demographic and Health Surveys (https://dhs Commissioner, Government of India.
program.com/data/) and https://dx.doi.org/10.1136/bmjgh- Fadel SA, Rasaily R, Awasthi S et al. 2017. Changes in cause-specific
2018-000794. neonatal and 1–59-month child mortality in India from 2000 to
2015: a nationally representative survey. The Lancet 390: 1972–80.
Filmer D, Pritchett LH. 2001. Estimating wealth effects without expen-
Funding diture data-or-tears: an application to educational enrollments in
states of India. Demography 38: 115–32.
This work was supported, in whole, by the Bill & Melinda Francis MR, Nohynek H, Larson H et al. 2018. Factors associated with
Gates Foundation [OPP1183738]. Under the grant condi- routine childhood vaccine uptake and reasons for non-vaccination
tions of the Foundation, a Creative Commons Attribution in India: 1998–2008. Vaccine 36: 6559–66.
4.0 Generic License has already been assigned to the Author Gurnani V, Haldar P, Aggarwal MK et al. 2018. Improving vaccination
Accepted Manuscript version that might arise from this sub- coverage in India: lessons from Intensified Mission Indradhanush, a
mission. The funders had no role in study design, data col- cross-sectoral systems strengthening strategy. BMJ 363: k4782.
lection and analysis, decision to publish or preparation of the Heckman JJ, Ichimura H, Todd PE. 1997. Matching as an economet-
manuscript. ric evaluation estimator: evidence from evaluating a job training
programme. Review of Economic Studies 64: 605–54.
International Institute for Population Sciences. 2017. National Family
Ethical approval. This study uses secondary data from pub- Health Survey (NFHS-4) 2015–2016: India. Mumbai: IIPS.
lished sources. No ethical approval was necessary. International Monetary Fund. 2020. Representative exchange rates for
selected currencies for January 2020.
Conflict of interest statement. A.R. is an employee of Bill Lahariya C. 2014. A brief history of vaccines & vaccination in India.
& Melinda Gates Foundation and P.H. is an employee of the Indian Journal of Medical Research 139: 491–511.Health Policy and Planning, 2021, Vol. 00, No. 0 9
Liu L, Chu Y, Oza S et al. 2019. National, regional, and state-level Rosenbaum PR, Rubin DB 1983. The central role of the propensity
all-cause and cause-specific under-5 mortality in India in 2000– score in observational studies for causal effects. Biometrika 70:
15: a systematic analysis with implications for the Sustainable 41–55.
Development Goals. The Lancet Global Health 7: e721–34. Sarker AR, Sultana M, Mahumud RA, Van Der Meer R, Morton A
Menzies NA, Cohen T, Lin -H-H, Murray M, Salomon JA. 2012. 2018. Cost-effectiveness analysis of introducing universal child-
Population health impact and cost-effectiveness of tuberculosis diag- hood rotavirus vaccination in Bangladesh. Human Vaccines &
nosis with Xpert MTB/RIF: a dynamic simulation and economic Immunotherapeutics 14: 189–98.
evaluation. PLoS Medicine 9: e1001347. Shrivastwa N, Gillespie BW, Kolenic GE, Lepkowski JM, Boul-
Ministry of Health and Family Welfare. 2014. Multi-year strategic plan ton ML. 2015. Predictors of vaccination in India for children
2013–17 Universal Immunization Program. New Delhi. aged 12–36 months. American Journal of Preventive Medicine 49:
Downloaded from https://academic.oup.com/heapol/advance-article/doi/10.1093/heapol/czab114/6370293 by guest on 29 October 2021
Ministry of Health and Family Welfare, Government of India. 2017. S435–44.
Comprehensive multi-year plan (cMYP) 2018–22 - Universal Immu- Sim SY, Watts E, Constenla D et al. 2021. Costs of immunization pro-
nization Programme. grams for 10 vaccines in 94 low- and middle-income countries from
Ministry of Health and Family Welfare, Government of India. 2018. 2011 to 2030. Value in Health 24: 70–7.
Techno-economic assessment of electronic vaccine intelligence net- Singh PK 2013. Trends in child immunization across geographical
work. regions in India: focus on urban-rural and gender differentials
Muniaraj M, Rajamannar V. 2019. Impact of SA 14-14-2 vaccination Bhutta ZA (ed). PLoS One 8: e73102.
on the occurrence of Japanese encephalitis in India. Human Vaccines Summan A, Nandi A, Deo S, Laxminarayan R. 2021. Improving vac-
& Immunotherapeutics 15: 834–40. cination coverage and timeliness through periodic intensification
Organization for Economic Co-operation and Development. 2020. of routine immunization: evidence from Mission Indradhanush.
Consumer price index: all items for India. Annals of the New York Academy of Sciences 1–11.
Pollitt E, Gorman KS, Engle PL, Martorell R, Rivera J. 1993. Early UNICEF. 2020. Immunization: One of the Most Effective
supplementary feeding and cognition: effects over two decades. and Cost-effective Ways to Protect Children’s Lives and
Monographs of the Society for Research in Child Development 58: Futures. UNICEF India. https://www.unicef.org/india/what-we-
1–99; discussion 111–8. do/immunization, accessed 22 September 2021.
Portnoy A, Resch SC. 2020. Estimating the Additional Cost for UNICEF. 2021. Immunization Services Begin Slow Recovery from
Maintaining Facility-Based Routine Immunization Programs in the COVID-19 Disruptions, though Millions of Children Remain at
Context of COVID-19. ImmunizationEconomics.org, accessed 20 Risk from Deadly Diseases. Geneva/New York: WHO, UNICEF,
September 2021. Gavi.
Pramanik S, Agrahari K, Srivastava A et al. 2016. Integrated child United Nations, Department of Economic and Social Affairs, Popu-
health and immunization survey, rounds 1 & 2 report. lation Division. 2019. World population prospects 2019: online
Prinja S, Bahuguna P, Faujdar DS et al. 2017. Cost-effectiveness of edition.
human papillomavirus vaccination for adolescent girls in Punjab Wahl B, Knoll MD, Shet A et al. 2020. National, regional, and state-
state: implications for India’s universal immunization program. level pneumonia and severe pneumonia morbidity in children in
Cancer 123: 3253–60. India: modelled estimates for 2000 and 2015. The Lancet Child &
Prinja S, Monga D, Rana SK et al. 2018. District level analysis of routine Adolescent Health 4: 678–87.
immunization in Haryana state: implications for Mission Indrad- World Health Organization. 2019. India: WHO and UNICEF estimates
hanush under Universal Immunization Programme. Indian Journal of immunization coverage: 2019 revision.
of Community Medicine : Official Publication of Indian Association World Health Organization. 2020. Guiding principles for immuniza-
of Preventive & Social Medicine 43: 209–14. tion activities during the COVID19 pandemic, Interim guidance.
Rheingans R, Anderson JD, Anderson B et al. 2014. Estimated impact Zuhair M, Roy RB. 2017. Socioeconomic determinants of the utiliza-
and cost-effectiveness of rotavirus vaccination in India: effects of tion of antenatal care and child vaccination in India. Asia Pacific
geographic and economic disparities. Vaccine 32: A140–50. Journal of Public Health 29: 649–59.You can also read