Cost and greenhouse gas emissions of current, healthy, flexitarian and vegan diets in Aotearoa (New Zealand) - BMJ Nutrition, Prevention ...
←
→
Page content transcription
If your browser does not render page correctly, please read the page content below
Open access Original research
Cost and greenhouse gas emissions of
BMJNPH: first published as 10.1136/bmjnph-2021-000262 on 9 June 2021. Downloaded from http://nutrition.bmj.com/ on October 12, 2021 by guest. Protected by copyright.
current, healthy, flexitarian and vegan
diets in Aotearoa (New Zealand)
Bruce Kidd, Sally Mackay, Stefanie Vandevijvere, Boyd Swinburn
To cite: Kidd B, Mackay S, ABSTRACT health and environmental terms. In Aotearoa
Vandevijvere S, et al. Cost Objective To compare the costs and climate impact (New Zealand), the environmental impact
and greenhouse gas (greenhouse gas emissions) associated with current and
emissions of current, healthy,
of the food system is similarly represented
healthy diets and two healthy and environmentally friendly and an increase in soil degradation, deple-
flexitarian and vegan diets
dietary patterns: flexitarian and vegan.
in Aotearoa (New Zealand). tion of fish stocks and damage to ecosystems
Design Modelling study
BMJ Nutrition, Prevention & is predicted.2–4 The agricultural sector in
Health 2021;0. doi:10.1136/ Setting Aotearoa (New Zealand).
Main outcome measures The distribution of the cost Aotearoa accounted for 48% of gross green-
bmjnph-2021-000262
and climate impact (kgCO2e/kg of food per fortnight) of house gas emissions in 2019. Their share of
►► Additional online 2 weekly current, healthy, vegan and flexitarian household environmental damage among Organisation
supplemental material is diets was modelled using a list of commonly consumed for Economic Co- operation and Develop-
published online only. To view,
foods, a set of quantity/serves constraints for each, and ment (OECD) countries from 2000 to 2010
please visit the journal online
constraints for food group and nutrient intakes based was the highest in Aotearoa for nitrogen
(http://dx.doi.org/10.1136/
bmjnph-2 021-000262). on dietary guidelines (Eating and Activity Guidelines for balance (average annual percentage change)
healthy diets and EAT-Lancet reference diet for vegan and
and contribution of GHG emissions.5 6
Department of Epidemiology flexitarian diets) or nutrition survey data (current diets).
There is an imperative in Aotearoa to move
and Biostatistics, School of Results The iterative creation of 210–237 household
Population Health, The University dietary intakes for each dietary scenario was achieved population diets towards being healthy and
of Auckland, Auckland, New using computer software adapted for the purpose sustainable.
Zealand (DIETCOST). There were stepwise differences between The environmental impact of the food
Correspondence to
diet scenarios (p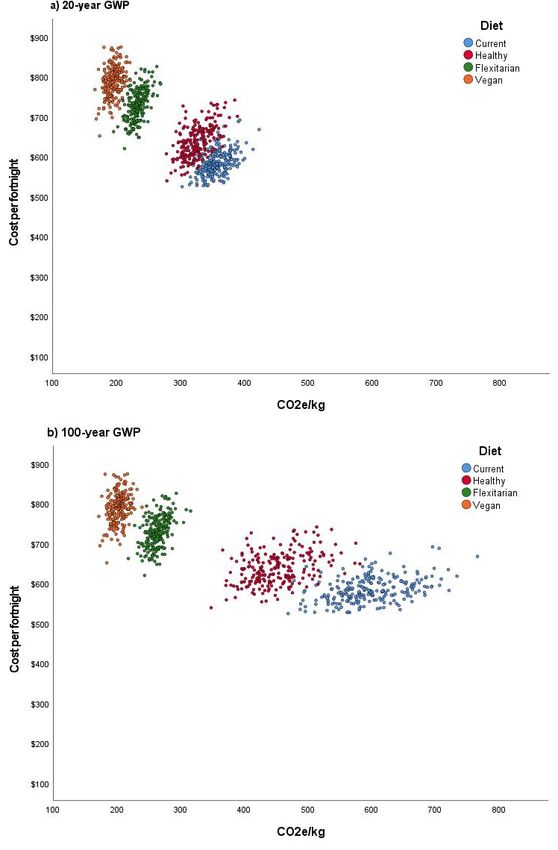
BMJ Nutrition, Prevention & Health
interact with the food system such as learnt experiences Patient and public involvement
BMJNPH: first published as 10.1136/bmjnph-2021-000262 on 9 June 2021. Downloaded from http://nutrition.bmj.com/ on October 12, 2021 by guest. Protected by copyright.
with food, the broader physical, social, cultural and policy This modelling study was based on population-level data
environments related to food, and food cost and afford- and averages, which did not require the involvement of
ability.9 10 Cost is a universal concern and significant members of the public in the study conception, design,
determinant of food choices in affording healthier foods data analysis or reporting. The public was not included
compared with unhealthy foods.11–13 in advisory or consultation roles and was not invited to
The EAT- Lancet Commission proposed a planetary comment on the paper before submission.
reference diet which includes global targets for healthy The programme uses Python24 to model the costs asso-
diets from sustainable food systems aligning with the UN ciated with different scenarios for 2 weekly household
Sustainable Development Goals and Paris Agreement.14 diets. The programme algorithm uses the Mersenne
Diets similar to the planetary diet such as vegetarian, Twister as a random number generator to specify the
have an association with reduced risk of adverse health starting meal plan and the starting value in grams for
outcomes including diabetes, ischaemic heart disease, each of the common foods (figure 1). Within the accept-
and cancer risk, and are projected to confer large able range for each food item, a starting value in grams
healthcare system cost savings in Aotearoa.15 16 Early for the common foods is generated to start building
developments towards addressing SHDs in Aotearoa a diet output. If successful in meeting the constraints,
have occurred including the creation of an NZ- spe- this results in a generated diet output. The serving sizes
cific life-cycle assessment (LCA) database, sustainability already incorporated in the DIETCOST programme
recommendations from the Ministry of Health to the were determined by the NZ Eating and Activity Guide-
health sector, assessing attitudes towards SHDs and lines (NZEAG) and Nutrient Reference Values for
meat reduction among different sectoral professionals Australia and NZ. Serving sizes from the NZEAG were
and the public, and optimisation modelling of SHD altered for the vegan and flexitarian diet scenarios by
scenarios.16–20 the EAT-Lancet ‘Planetary Diet’ reference values. Serving
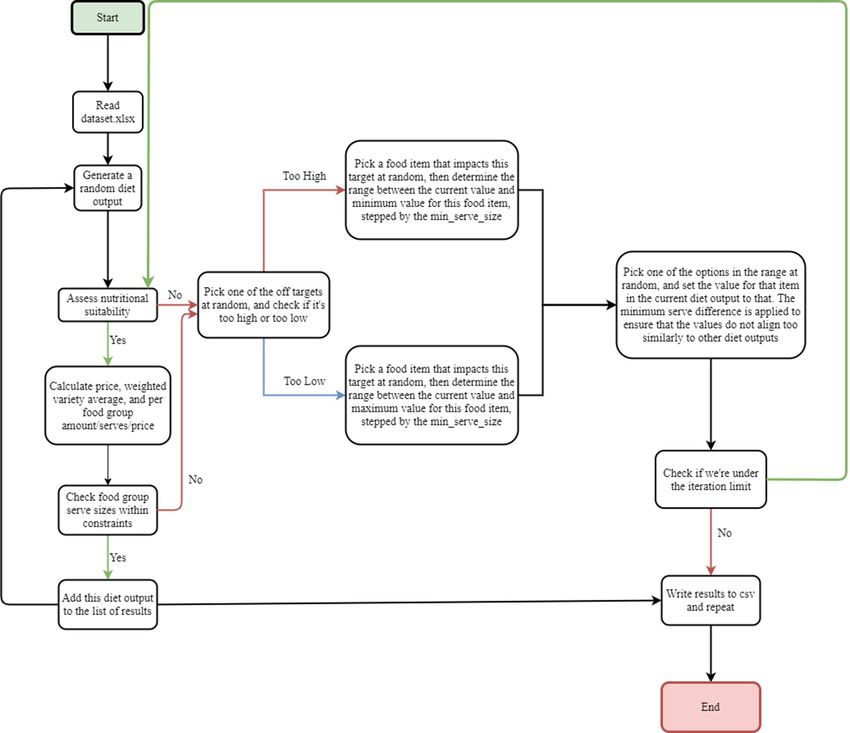
We used the DIETCOST programme (a python-based, size targets for current diets were from average intakes
iterative, multiple solution solver that finds diet outputs found in the Ministry of Health 2002 National Children’s
that fit various constraints21 to answer the question: What Nutrition Survey25 and 2008/2009 NZ Adult Nutrition
are the differences in costs and GHG emissions between Survey.26 The minimum serve size difference between any
four dietary patterns in Aotearoa: current (based on two generated individual meal plans was set at half a serve
national nutrition surveys); healthy (based on dietary for any common food in this study. There was 106, 105,
guidelines); and flexitarian and vegan (based on the EAT- 62 and 66 individual food items in the current, healthy,
Lancet planetary diet)? flexitarian and vegan diet scenarios, respectively. Online
supplemental files provide more information on the types
of food items and the nutritional breakdown of the diet
scenarios included.
METHODS The DIETCOST programme’s iterative process is a
The DIETCOST programme and its embedded data and methodological improvement compared with linear
modelling syntax and algorithm were originally devel- modelling as multiple diets in the form of diet outputs
oped by Vandevijvere et al21 to model the cost differential can be generated, and the potential variance between
between healthy and current (less healthy) household modelled diets can be analysed. Multiple diet outputs
diets. This was an extension to the original Food Prices therefore allow the data to be analysed and compared
module and protocol of International Network for Food both within and between modelled diet scenarios. The
and Obesity/NCDs Research, Monitoring and Action process of the DIETCOST programme producing itera-
Support.22 The existing data sources (programme tive diet outputs involves the programme going through
inputs) include food composition data (FOODfiles),23 consecutive iterations to see whether the constraints
online supermarket food price data, a list of commonly (as listed previously in minimum and maximum serve
consumed foods, minimum and maximum quantities/ size differences) can or cannot be achieved to generate
serves constraints for each included food item, and a diet output. Acceptability and variety were incorpo-
food group and nutrient intakes based on dietary guide- rated into the process of DIETCOST generating a diet
lines (healthy diets) and nutrition survey data (current output through the researchers collating a selection of
diets). common foods that the programme could select within
DIETCOST uses iterative modelling where multiple a diet output and ensuring that the selected common
diet outputs are generated for each diet scenario. Iter- foods were not too high or low in quantity within each
ative modelling contrasts to linear modelling where a diet output.
single optimised diet output for a diet scenario is gener- Overall a new climate impact measure, revised food
ated. The programme’s original reference household was prices, and two new dietary scenarios were incorporated
retained for this study (adult male aged 45 years, adult in the existing DIETCOST programme (figure 2). A
female aged 45 years, adolescent boy aged 14 years and a recently published (2020) LCA database for NZ foods
girl aged 7 years).21 was used to create the climate impact measure of kg of
2 Kidd B, et al. bmjnph 2021;0. doi:10.1136/bmjnph-2021-000262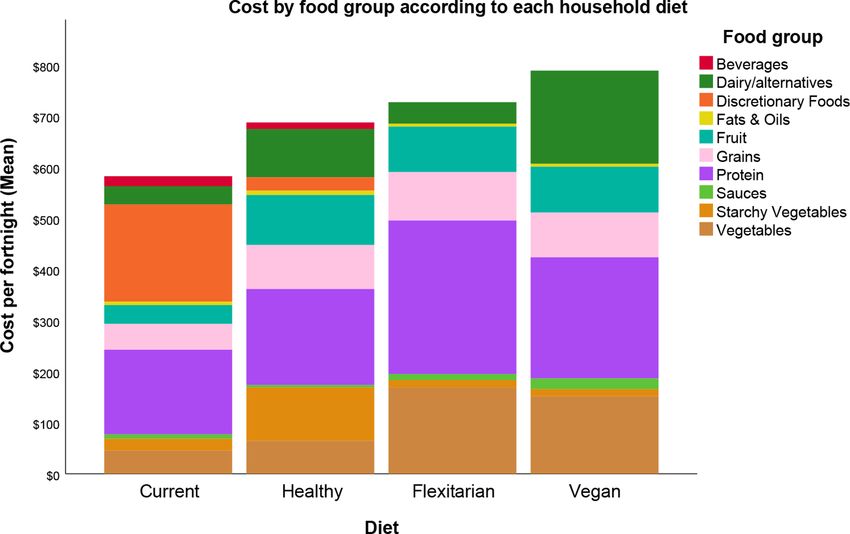
BMJ Nutrition, Prevention & Health

                                                                                                                             BMJNPH: first published as 10.1136/bmjnph-2021-000262 on 9 June 2021. Downloaded from http://nutrition.bmj.com/ on October 12, 2021 by guest. Protected by copyright.
Figure 1     DIETCOST programme algorithm as adapted from Vandevijvere et al.21

CO2equivalent emissions per kg of food product.16 The            food item). These values were then modified according
final LCA value for each food was selected from the data-        to the NZ context according to the lifecycle stages that
base, and depending on the justification, was predomi-           contributed most to overall emissions (ie, farming and
nately a single LCA value deemed to be the most credible         processing), and when the NZ context was likely to differ
and robust, while others were a median or average value          from the original LCA values (emission estimates for
(if multiple LCA figures were deemed credible for a single       transportation and electricity usage).

Figure 2     New data sources to revise the existing DIETCOST programme. WRAP, Waste and Resources Action Programme.

Kidd B, et al. bmjnph 2021;0. doi:10.1136/bmjnph-2021-000262                                                            3
BMJ Nutrition, Prevention & Health
Foods such as dairy and meat had NZ- specific LCA Energy requirements for the healthy, flexitarian and
BMJNPH: first published as 10.1136/bmjnph-2021-000262 on 9 June 2021. Downloaded from http://nutrition.bmj.com/ on October 12, 2021 by guest. Protected by copyright.
figures, while foods with no NZ-specific LCA figures used vegan diet scenarios for adults were fixed at the same
data from the UK. Values from the UK were used given range to ensure the diet output maintains a healthy
that the potential differences in LCA figures between the body weight (as healthiness is incorporated within these
UK and Aotearoa are likely to be insignificant as reported scenarios). This was calculated using the Body Weight
by Drew et al.16 The LCA values from the UK were also Calculator based on a weight derived from a BMI of 23
adjusted to the New Zealand context in the other stages kg/m2, a mean population height, and moderate physical
that are likely to differ (eg, transport and electricity). The activity.28 29 Similarly for children, energy was based on the
20-year and 100-year global warming potential (GWP) was recommended energy requirements per KJ/kg per day
the outcome measure of emissions, with 100-year GWP from FAO/WHO/UNU for moderate physical activity.28
figures commonly used in the literature, and 20- year For the current diet scenario, the energy requirement for
GWP figures also used to incorporate shorter-lived but adults was based on the current BMI. A moderate physical
more highly potent GHGs such as methane. Both figures activity level (PAL) was selected as an average PAL was
were used to account for methane especially being a large unknown for the population but half of adults met the
pollutant from agriculture in the food system. An ID was physical activity guidelines.28 The energy requirement for
created for each food group in the LCA database to align children for the current diet scenario was based on actual
with the products in DIETCOST, with no major assump- weight and moderate physical activity, because most chil-
tions necessary. dren met the physical activity guidelines.30 More details
Estimates of the emissions from food waste (the propor- on the methods of the energy requirements has been
tion of food wasted upstream that is, not on the consumer published previously.31
level) were incorporated from the Waste and Resources The current dietary scenario exceeds recommendations
Action Programme 2017 report27 as used by Drew et al16 for sodium, has insufficient dietary fibre, wholegrains,
by multiplying the overall climate impact of each product fruits and vegetables, and is high in UPF. The healthy
by the added food waste for each gram included in a diet dietary scenario was created to align with the 2015 dietary
output. Online food prices were collected in 2019 during guidelines (NZEAG).32 The percentage range required
spring for each item from the three largest supermarkets: for the different macronutrients was the Acceptable
Pak‘nSave, Countdown and New World. For each food Macronutrient Distribution Range recommended by the
item, the product with the lowest price was selected. This Nutrient Reference Values for NZ and Australia.33 The
cost was then calculated per 100 g to offset the packet size flexitarian dietary scenario was based on the EAT-Lancet
for each food item. Commission’s criteria for a planetary diet and a vegan
Food and drink purchased from restaurants and take- version of this was created to show the diverse range of
aways and alcohol were not included, while ultrapro- dietary patterns within SHDs. See a description of the diet
cessed foods (UPF)(discretionary foods) and beverages scenarios below (table 1).
were included in the current diet, and, to a lesser extent, Data analysis involved statistical comparison alongside
in the healthy diet scenarios. This was to remove the regression analysis. Statistical comparison comprised
influence of varying amounts of alcohol and takeaways calculating the SD, mean and their corresponding confi-
between diet scenarios to focus on sustainability. This dence intervals across the diet scenarios. Regression anal-
influence is demonstrated in previous research using the ysis involved calculating the household level data and
DIETCOST programme showing that when takeaways examining the relationships between the diet scenario,
and alcohol were included the average cost between climate impact and cost using one-way analysis of variance
the healthy and current diet was $105 more expensive and regression analyses. The overall cost and average cost
over a fortnight compared with NZ$70 when takeaways according to each food group was calculated. GHG emis-
and alcohol were not included.21 Assessing the impact sions were calculated at each life-cycle stage and then
of increasing the sustainability of foods on diet cost was overall emissions for both the 100-year and 20-year GWP.
the main factor of interest, and to do this, the large influ- The stages included: farming and processing (100-year
ence alcohol and takeaways have on cost needed to be GWP and 20- year GWP), transit packaging, consumer
avoided. packaging, transport, warehouse/distribution, refrigera-
The most recent food composition data23 was used to tion and supermarket overheads.
create mean nutrient intakes for macronutrients (protein,
fat, carbohydrates) and selected micronutrients (sodium
and fibre). In establishing the total fortnightly dietary RESULTS
intake, maximum and minimum constraints of ±30% The persona diet outputs generated by the DIETCOST
of the mean macro and sodium intakes were created. programme were combined to create a household diet
These constraints are relative to the energy of the total output, with between 210 and 237 different fortnightly
fortnightly dietary intake. The ±30% constraint was not diets generated for each of the four diet scenarios. Data
applied for energy intake in the healthy, flexitarian and were calculated in the DIETCOST programme at the
vegan scenarios which require tighter control to ensure persona and household level, with costs and emissions
the diet outputs maintain a healthy body weight. modelled for each diet.
4 Kidd B, et al. bmjnph 2021;0. doi:10.1136/bmjnph-2021-000262BMJ Nutrition, Prevention & Health
Table 1 Description of diet scenarios
BMJNPH: first published as 10.1136/bmjnph-2021-000262 on 9 June 2021. Downloaded from http://nutrition.bmj.com/ on October 12, 2021 by guest. Protected by copyright.
Diet scenario Description
Current ►► Survey data from the most recent NZ National Nutrition Survey (2008/2009).
►► Used to represented ‘current’ diets in Aotearoa.
►► Meets energy requirements to meet the current mean BMI of the population group of the
household member (weight for children).
Healthy ►► 2015 New Zealand Eating and Activity Guidelines.
►► Solely uses a human health lens.
►► Does not currently incorporate sustainability.
►► Meets energy requirements of a person of a healthy weight and moderately active.
Flexitarian ►► Modelled from the EAT-Lancet ‘Planetary Diet’ guidelines.
►► Primarily vegetarian diet with the occasional inclusion of meat or fish.
►► Incorporates both a human and planetary health lens.
►► Meets energy requirements of a person of a healthy weight and moderately active.
Vegan ►► Modelled from the EAT-Lancet ‘Planetary Diet’ guidelines.
►► No animal-based products (eg, meat or dairy).
►► Incorporates both a human and planetary health lens.
►► Meets energy requirements of a person of a healthy weight and moderately active.
BMI, body mass index.
The nutritional composition of the scenarios involved per fortnight), followed by healthy (NZ$637), flexi-
the overall energy levels (kJ) for the flexitarian, vegan tarian (NZ$728) and vegan (NZ$789) (table 2). The top
and healthy scenarios for each persona generated diet three contributing foods groups for each scenario were:
outputs that maintained a healthy BMI due to the health- current (discretionary foods, 33%; protein, 28%; grains,
iness constraints included. The mean fortnightly house- 9%); healthy (protein, 30%; fruit, 15%; dairy/alterna-
hold energy intake was 43 301 kJ (current), 39 919.5 kJ tives, 15%); flexitarian (protein, 41%; vegetables, 23%;
(healthy), 38 962 kJ (flexitarian), and 39 215 kJ (vegan). grains, 13%); vegan (protein, 30%; dairy/alternatives,
The total fibre content (g/day) for the flexitarian and 31%; vegetables, 20%) (figure 3). The minimum and
vegan diet scenarios was very high (ie, vegan household maximum values for each diet scenario show none of the
234 g/day vs healthy household 164 g/day) compared flexitarian or vegan diet outputs were cheaper than the
with the other diet scenarios. Household sodium content mean cost of the current diet.
(mg/day) varied between the diet scenarios with the Larger servings of high protein plant foods, for
flexitarian scenario being the lowest (4175), followed by example, legumes, nuts and seeds, compared with the
vegan (4974), healthy (7562) and current (14 388). For
current and healthy diets were needed to meet protein
more details of the data at the persona and household
requirements in vegan and flexitarian diet scenarios and
level, see online supplemental files. The remainder of the
were thus more expensive. A comparison of the plant and
results are presented at the household level, with the vari-
animal-based protein sources used in the diet scenarios
ables of cost and climate impact analysed.
showed that on average, plant-based sources had nearly
Cost half the protein content per 100 g. Roughly twice the
Statistically significant differences were found between volume of food is therefore required from plant-based
the costs of the various household diet scenarios with compared with animal-based protein sources. This was
more constraints resulting in diets being more expensive. also similar for the vegetables food group where the
The current diet scenario had the lowest cost (NZ$584 contribution was highest in the vegan (NZ$151) and
Table 2 Cost of fortnightly household diet scenarios
Household diet scenario Mean cost per fortnight (95% CI) Minimum Maximum Range
Current NZ$584 (NZ$580 to NZ$588) NZ$524 NZ$691 NZ$167
Healthy NZ$637 (NZ$632 to NZ$642) NZ$538 NZ$740 NZ$202
Flexitarian NZ$728 (NZ$723 to NZ$734) NZ$619 NZ$825 NZ$206
Vegan NZ$789 (NZ$784 to NZ$794) NZ$650 NZ$873 NZ$223
Kidd B, et al. bmjnph 2021;0. doi:10.1136/bmjnph-2021-000262 5 BMJ Nutrition, Prevention & Health
BMJNPH: first published as 10.1136/bmjnph-2021-000262 on 9 June 2021. Downloaded from http://nutrition.bmj.com/ on October 12, 2021 by guest. Protected by copyright.
Figure 3 Contribution of food groups to household diet scenario cost.
flexitarian (NZ$169) scenarios, and more than double Associations between climate impact, cost and diet
the healthy scenario (NZ$64). This difference was due Climate impact and cost
to larger serving requirements of vegetables in the EAT- Across diets, there was a negative relationship between
Lancet planetary diet guidelines compared with the the cost of 2 weekly household diets and their climate
NZEAG. impact for 20-year and 100-year GWP figures (regression
Another contributor to the higher cost of the vegan coefficient (r)=−0.471 and r=−1.170, pBMJ Nutrition, Prevention & Health
DISCUSSION
BMJNPH: first published as 10.1136/bmjnph-2021-000262 on 9 June 2021. Downloaded from http://nutrition.bmj.com/ on October 12, 2021 by guest. Protected by copyright.
We aimed to understand the interactions between the
healthiness, cost and climate impact of different dietary
patterns in Aotearoa. The least healthy diets (current
diets) had the highest climate impact and proportion
of UPF but the lowest cost. Of the three healthy dietary
patterns, the patterns with the lower climate impact
(vegan and flexitarian) also had a higher monetary cost
compared with the healthy diet. In general, the greater
the constraints on a dietary pattern, with vegan being the
most constrained, the higher the cost of the diets. This is
in part due to trade-offs made to ensure meeting guide-
lines for healthy sustainable diets, variety and accept-
ability. However, within each dietary pattern, the lower the
climate impact, the lower the cost, generally reflecting the
lower cost and climate impact of legumes and vegetables
compared with higher cost and climate impact of prod-
ucts such as red meat. These results provide a new insight
into the climate impact and cost distribution across diets
in Aotearoa.
The farming and processing stage was the largest
contributing LCA stage of each diet scenario overall
but was much higher for the current and healthy diets
due to the increased presence of animal-based products.
There were also higher emissions from transport and
distribution related to more plant-based products in the
flexitarian and vegan diets but the contribution from the
farming and processing stage was much more significant
to overall emissions. This contribution of farming and
processing of animal- based products directly contrib-
utes to the emissions profile of Aotearoa, regardless of
whether the product itself is exported globally.34
Figure 4 Grouped scatter plot of relationship between cost National consumption rates of meat reflect the scale of
and climate impact. GWP, Global Warming Potential. the agricultural industry in Aotearoa as a critical factor
within the food system of the continuation of unsustain-
Climate impact and diet able diets.5 As stratified by type of meat, Aotearoa is thir-
The relationship between climate impact and diet was posi- teenth for beef and veal consumption globally, seventh
tive meaning that within diets, lower climate impact diets for poultry meat and third for sheep meat. For example,
were less expensive. This contrasts to the inverse relation- sheep meat, has the second- highest environmental
ship between climate impact and cost when all diets were impact of meats from corresponding production, and
included in the analyses (figure 4). All correlations within New Zealanders consume 4.7 kg per capita per year, far
and across diet scenarios were statistically significant at the exceeding the OECD average.5
20-year GWP and 100-year GWP (p BMJ Nutrition, Prevention & Health
to flexitarian diet would spend NZ$144 more each fort- GHG emissions decreased diet cost, but occurred when
BMJNPH: first published as 10.1136/bmjnph-2021-000262 on 9 June 2021. Downloaded from http://nutrition.bmj.com/ on October 12, 2021 by guest. Protected by copyright.
night, with the climate benefit of 334 kgCO2e less GHG the nutritional constraints only applied to macronutri-
emissions. This cost is far higher than the current price ents. Once nutritional constraints included all macro-
of carbon in Aotearoa (NZ$37.30/tonne),35 emphasising nutrients and micronutrients, this relationship was not
the need for action within the food system to address seen.49 Overall more constraints placed on diets resulted
this inequity. Further research is required to analyse the in greater difficulty to reduce diet cost which is similar to
potential impact of increased food expenditure on house- our results.
holds, weighing this increased food expenditure against Consuming an SHD is an effective tool to protect
the climate benefits, and whether the increased food the environment and reduce the large health burden
expenditure is inequitable for specific groups. related to chronic diseases.50 This research indicates
Opposing conclusions on the relationship between cost that a large amount of effort is required to achieve the
and diet impact reflect: (1) the increasing constraints on dietary shift towards SHD. The transition towards a
the foods included in these diets and (2) higher costs in healthier, more sustainable diet involves large reductions
shifting populations from their currently unhealthy and in UPF (currently about one-third of the diet) and large
unsustainable dietary patterns. Although, at any level of reductions in red meat and dairy. Consideration is also
constrained dietary pattern (eg, flexitarian), the higher needed to address the large role that animal-based prod-
the plant-animal based product ratio, the lower the cost. ucts (meat and dairy) contribute to exports in Aotearoa
This is one of the few studies assessing relationships alongside a shift to reduce domestic consumption.34
between climate impact and cost within different dietary These are huge shifts at the population level and raise
scenarios. Other studies that have conducted model- major equity challenges in achieving SHDs. Public health
ling similar to this research did not include the feature policies and interventions to enable the transition to SHD
of generating numerous iterations of their modelling are needed: (1) Incorporate sustainability in the NZEAG
data. That current eating patterns (as reflected in the to inform policies and interventions; (2) Promote (ie,
current diet scenario) in Aotearoa are unsustainable and social marketing) of sustainable, nutritious and low-cost
unhealthy is similarly found for other high-income coun- foods such as legumes; (3) Implement a national nutri-
tries.36–38 As most studies include 100-GWP figures for tion survey in Aotearoa among adults and children with
measuring GHG emissions, the finding that there was no questions about dietary patterns; (4) Conduct further
substantial difference in GHG emissions in the healthy monitoring and advocacy towards encouraging the shift
(according to nutrition guidelines) compared with the to SHD; (5) Provide more support to grow plant protein
current diets is also found in the literature.16 37 39–43 The sources (ie, legumes) in Aotearoa and (6) Develop educa-
high-fibre content of the flexitarian and vegan diets is tional tools (ie, Front-of-pack labelling of climate impact)
similar to other diets that have been modelled in the liter- to allow consumers to make informed decisions.
ature.20 38 44 45 Healthy diets having slightly less GHG emis-
sions is reflected from Springmann et al,46 who found that Strengths and weaknesses
modelling the environmental implications of adopting Strengths of this research include the LCA database of
national dietary guidelines (such as the NZEAG) showed the most recent and robust sources of data available in
work was needed to integrate sustainability into the Aotearoa. Data from the UK were used to inform the LCA
guidelines. figures for selected foods when NZ- specific data were
Trade-offs were evident in the results and are reflected unavailable, but these potential differences in LCA figures
in the literature with the first being a trade-off between between the UK and NZ are likely insignificant. Avoid-
daily food cost and low emissions foods. For example, able food waste emissions (ie, emissions from food that is
nutritionally dense foods such as dairy milk were substi- discarded unnecessarily or expires prior to consumption)
tuted for more expensive but lower GHG emission alter- was accounted for in the emissions for each food product,
natives, such as soy milk, to supplement the nutritional but it was not possible to account for the unavoidable
density lost from the original substitution.20 It has been food waste emissions from food waste directed to landfill.
shown that some products, such as milk, are GHG emis- The DIETCOST programme can generate many outputs
sions intensive but more efficient in their environmental for different diets compared with other optimisation
footprint when accounting for nutrient provision in terms techniques where a single figure for the various scenarios
of nutrients per GHG emissions generated.47 assessed such as cost is included. Limitations associ-
Wilson et al20 found trade- offs between increasing ated with data inputs into the DIETCOST programme
dietary variety and likely acceptability with increasing includes the survey data used to develop the current
cost. This trade-off is similarly discussed in Reynolds et diet scenario is outdated, as the data originated from the
al48 when optimising low cost and low GHG diets whereby 2008/2009 Adult Nutrition Survey and the 2002 National
people on higher incomes achieved greater dietary variety Children’s Nutrition Survey. It is uncertain how the diets
and acceptability (when compared with their existing of the population have changed since these surveys were
diets) compared with those on lower incomes. Nutri- completed. Alcohol and takeaways were excluded from
tional adequacy has also been discussed, with modelling the diet outputs to focus on the transition of increasing
from Perignon et al49 finding that stepwise reductions in sustainability in the diet scenarios but contribute to 27%
8 Kidd B, et al. bmjnph 2021;0. doi:10.1136/bmjnph-2021-000262BMJ Nutrition, Prevention & Health
of household food expenditure in Aotearoa.51 Future sustainability throughout the NZEAG, promoting sustain-
BMJNPH: first published as 10.1136/bmjnph-2021-000262 on 9 June 2021. Downloaded from http://nutrition.bmj.com/ on October 12, 2021 by guest. Protected by copyright.
research could assess the sustainability of household able, nutritious and low-cost foods, updating the national
takeaways and alcohol purchases. Only one indicator of nutrition survey, further support to grow plant protein
climate impact was incorporated into the DIETCOST sources and further monitoring and advocacy. These
programme (GHG emissions) when there are other indi- would ensure that the economic drivers are towards
cators such as land and water use. This study does not healthier, lower carbon food purchases to promote public
consider the impacts on the food system (ie, changes in health and protect our planet.
food imports and exports) of a population transition to
the other three diets included in our modelling (healthy, Dissemination to participants and related patient and public
flexitarian and vegan). communities
The results of the study are accessible to the public and
will be disseminated and shared with interested parties.
CONCLUSION Approval to access the full dataset will not be publicly
In Aotearoa, unhealthy diets are the leading cause of available but will be shared to third parties when deemed
health loss and subsequent inequity and food systems appropriate by the study authors.
are the largest source of GHG emissions and other envi-
ronmental damage. At a population level, our modelling Twitter Bruce Kidd @bk3611
shows that shifting existing unsustainable and unhealthy Contributors BK contributed to the study conception and design, and led the data
diets to being sustainable and healthier imposes collection, analysis and writing of the manuscript. SM contributed to the study
increasing constraints to populations. These constraints conception and design, data analysis and assisted with writing and critically revised
the manuscript. SV contributed to the study conception and design, and critically
involve factors such as nutritional adequacy, cost, climate revised the manuscript. BS contributed to the study conception and design and
impact, acceptability and dietary variety. In terms of cost, critically revised the manuscript.
the most expensive dietary pattern was the vegan diet Funding The funding source of the contributing authors included the main author
which also had the lowest GHG emission footprint. This receiving the University of Auckland Research Masters Scholarship as part of
was followed by the flexitarian, then the healthy diet with completing the research in the Master of Public Health programme at the University
of Auckland. No other funding sources were involved.
the current diet having the lowest cost and the highest
GHG footprint. Although, within existing diets (eg, flex- Disclaimer This study is based on population level data that cannot be attributed
to individuals and is publicly available. No patients or members of the public were
itarian) households that are not transitioning from one involved in the study.
dietary pattern to another, are generally able to reduce
Competing interests None declared.
diet costs with increasing the proportion of plant-based
foods in their diet. These findings are locally specific and Patient consent for publication Not required.
country dependent given the primary setting of Aotearoa. Provenance and peer review Not commissioned; externally peer reviewed by
Malcolm Riley, CSIRO Australia.
Key public health policies and interventions are needed
to enable the transition to SHD such as incorporating Data availability statement The data from this research will not be publicly
available as it is specific to the DIETCOST programme and would have little
relevance to the public. Third parties will be allowed to ask for permission to access
the data if deemed appropriate to do so by the study authors.
Key messages Supplemental material This content has been supplied by the author(s). It has
not been vetted by BMJ Publishing Group Limited (BMJ) and may not have been
What is already known on this topic peer-reviewed. Any opinions or recommendations discussed are solely those
►► Globally the food system contributes significantly to damaging our of the author(s) and are not endorsed by BMJ. BMJ disclaims all liability and
environment in biodiversity loss, deforestation, and in GHG emis- responsibility arising from any reliance placed on the content. Where the content
sions, and contributing to poor diet being a large cause of health includes any translated material, BMJ does not warrant the accuracy and reliability
of the translations (including but not limited to local regulations, clinical guidelines,
loss.
terminology, drug names and drug dosages), and is not responsible for any error
►► Cost is a universal concern and large determinant of food choices in and/or omissions arising from translation and adaptation or otherwise.
affording healthier food compared with unhealthy food.
Open access This is an open access article distributed in accordance with the
►► A transition to sustainable healthy diets is necessary and must be
Creative Commons Attribution Non Commercial (CC BY-NC 4.0) license, which
equitable. permits others to distribute, remix, adapt, build upon this work non-commercially,
and license their derivative works on different terms, provided the original work is
What this study adds
properly cited, appropriate credit is given, any changes made indicated, and the use
►► The modelling showed that the transition from unsustainable and is non-commercial. See: http://creativecommons.org/licenses/by-nc/4.0/.
unhealthy diets to more sustainable and healthy diets imposes in-
creasing constraints, associated with increasing cost.
►► Although, within existing diets (eg, flexitarian) households are gen-
erally able to reduce diet costs by increasing the proportion of plant- REFERENCES
based foods in their diet. 1 Swinburn BA, Kraak VI, Allender S, et al. The global Syndemic of
►► Further action is required such as monitoring and advocacy, sup- obesity, undernutrition, and climate change: the Lancet Commission
port for growers to supply plant protein sources (ie, legumes) in report. Lancet 2019;393:791–846.
2 Royal Society Te Apārangi. Human health impacts of climate change
Aotearoa, integrating sustainability into the dietary guidelines, an for new Zealand, 2017.
updated national nutrition survey and promoting sustainable and 3 Metcalfe S, Woodward A, Macmillan A, et al. Why New Zealand
healthy food choices. must rapidly halve its greenhouse gas emissions. N Z Med J
2009;122:72–95.
Kidd B, et al. bmjnph 2021;0. doi:10.1136/bmjnph-2021-000262 9 BMJ Nutrition, Prevention & Health
4 Hollis M. Climate change: IPCC fifth assessment report New Zealand 30 Ministry of Health. Nutrition survey. Wellington, New Zealand:
BMJNPH: first published as 10.1136/bmjnph-2021-000262 on 9 June 2021. Downloaded from http://nutrition.bmj.com/ on October 12, 2021 by guest. Protected by copyright.
findings. Auckland, New Zealand, 2014. Ministry of Health, 2011.
5 Organisation for Economic Co-operation and Development. 31 Mackay S, Buch T, Vandevijvere S, et al. Cost and affordability of
Agricultural output - Meat consumption - OECD Data [Internet], diets modelled on current eating patterns and on dietary guidelines,
2019. Available: https://data.oecd.org/agroutput/meat-consumption. for new Zealand total population, Māori and Pacific households. Int J
htm Environ Res Public Health 2018;15:1255.
6 Ministry for the Environment. New Zealand’s Greenhouse Gas 32 Ministry of Health. Eating and activity guidelines for new Zealand
Inventory 1990-2019. Wellington, New Zealand, 2021. adults. Wellington, New Zealand: Ministry of Health, 2015.
7 Steffen W, Richardson K, Rockström J, et al. Sustainability. planetary 33 National Health and Medical Research Council. Australian
boundaries: guiding human development on a changing planet. Government, Department of Health and Ageing. New Zealand
Science 2015;347:1259855. Ministry of Health. Nutrient reference values for Australia and New
8 Ministry of Health. Longer, Healthier Lives: New Zealand’s Health Zealand including recommended dietary intakes. Canberra, Australia,
1990-2017 [Internet]. Wellington, New Zealand, 2020. https://www. 2006.
health.govt.nz/publication/longer-healthier-lives-new-zealands- 34 Statistics New Zealand. Records all round for dairy and meat
health-1990-2017 exports [Internet], 2020. Available: https://www.stats.govt.nz/news/
9 Food and Agriculture Organisation of the United Nations. World records-all-round-for-dairy-and-meat-exports [Accessed 19 May
health organisation. sustainable healthy diets: guiding principles. 2021].
Rome, Italy: FAO and WHO, 2019. 35 Carbon Forest Services. Indicative Carbon Prices [Internet].
10 Contento I. Overview of determinants of food choice and dietary Available: https://www.carbonforestservices.co.nz/carbon-prices.
change: Implications for nutrition education. In: Nutrition education: html [Accessed 16 Apr 2021].
linking research, theory and practice. 2nd edn. Sudbury, MA: Jones & 36 Donati M, Menozzi D, Zighetti C, et al. Towards a sustainable diet
Bartlett Learning, 2011: 176–9. combining economic, environmental and nutritional objectives.
11 French SA. Pricing effects on food choices. J Nutr 2003;133:841S–3. Appetite 2016;106:48–57.
12 Glover M, Wong SF, Fa’alili-Fidow J, et al. Ranked Importance of 37 Green R, Milner J, Dangour AD, et al. The potential to reduce
Childhood Obesity Determinants: Parents’ Views across Ethnicities in greenhouse gas emissions in the UK through healthy and realistic
New Zealand. Nutrients 2019;11:2145. dietary change. Clim Change 2015;129:253–65.
13 Lennernäs M, Fjellström C, Becker W, et al. Influences on food 38 Fresán U, Martínez-González MA, Sabaté J, et al. Global
choice perceived to be important by nationally-representative sustainability (health, environment and monetary costs) of three
samples of adults in the European Union. Eur J Clin Nutr 1997;51 dietary patterns: results from a Spanish cohort (the sun project). BMJ
Suppl 2:S8–15. Open 2019;9:e021541.
14 Willett W, Rockström J, Loken B, et al. Food in the Anthropocene: 39 Hitaj C, Rehkamp S, Canning P, et al. Greenhouse gas emissions in
the EAT-Lancet Commission on healthy diets from sustainable food the United States food system: current and healthy diet scenarios.
systems. Lancet 2019;393:447–92. Environ Sci Technol 2019;53:5493–503.
15 Oussalah A, Levy J, Berthezène C, et al. Health outcomes associated 40 Horgan GW, Perrin A, Whybrow S, et al. Achieving dietary
with vegetarian diets: an umbrella review of systematic reviews and recommendations and reducing greenhouse gas emissions:
meta-analyses. Clin Nutr 2020;39:3283–307. modelling diets to minimise the change from current intakes. Int J
16 Drew J, Cleghorn C, Macmillan A, et al. Healthy and climate-friendly Behav Nutr Phys Act 2016;13:46.
eating patterns in the New Zealand context. Environ Health Perspect 41 Song G, Li M, Fullana-I-Palmer P, et al. Dietary changes to mitigate
2020;128:17007. climate change and benefit public health in China. Sci Total Environ
17 Lentz G, Connelly S, Mirosa M, et al. Gauging attitudes and 2017;577:289–98.
behaviours: meat consumption and potential reduction. Appetite 42 Tyszler M, Kramer G, Blonk H. Just eating healthier is not enough:
2018;127:230–41. studying the environmental impact of different diet scenarios for
18 Kemper JA. Motivations, barriers, and strategies for meat reduction Dutch women (31–50 years old) by linear programming. Int J Life
at different family lifecycle stages. Appetite 2020;150:104644. Cycle Assess 2016;21:701–9.
19 Jones R, Wham C, Burlingame B. New Zealand's food system is 43 Vieux F, Perignon M, Gazan R, et al. Dietary changes needed to
Unsustainable: a survey of the divergent attitudes of agriculture, improve diet sustainability: are they similar across Europe? Eur J Clin
environment, and health sector professionals towards eating Nutr 2018;72:951–60.
guidelines. Front Nutr 2019;6:99. 44 van Dooren C, Tyszler M, Kramer G, et al. Combining low price, low
20 Wilson N, Nghiem N, Ni Mhurchu C, et al. Foods and dietary patterns climate impact and high nutritional value in one Shopping basket
that are healthy, low-cost, and environmentally sustainable: a through diet optimization by linear programming. Sustainability
case study of optimization modeling for new Zealand. PLoS One 2015;7:12837–55.
2013;8:e59648. 45 Seves SM, Verkaik-Kloosterman J, Biesbroek S, et al. Are more
21 Vandevijvere S, Young N, Mackay S, et al. Modelling the cost environmentally sustainable diets with less meat and dairy
differential between healthy and current diets: the New Zealand case nutritionally adequate? Public Health Nutr 2017;20:2050–62.
study. Int J Behav Nutr Phys Act 2018;15:16. 46 Springmann M, Spajic L, Clark MA, et al. The healthiness and
22 Lee A, Mhurchu CN, Sacks G, et al. Monitoring the price and sustainability of national and global food based dietary guidelines:
affordability of foods and diets globally. Obes Rev 2013;14 Suppl modelling study. BMJ 2020;370:m2322.
1:82–95. 47 Drewnowski A. The contribution of milk and milk products to
23 The New Zealand Institute for Plant and Food Research Limited, micronutrient density and affordability of the U.S. diet. J Am Coll Nutr
Ministry of Health. The Concise New Zealand food composition 2011;30:422S–8.
tables, 2018. 48 Reynolds CJ, Horgan GW, Whybrow S, et al. Healthy and sustainable
24 Python Software Foundation. Python [Internet], 2019. Available: diets that meet greenhouse gas emission reduction targets and are
https://www.python.org/ affordable for different income groups in the UK. Public Health Nutr
25 Parnell W, Scragg R, Wilson N. NZ Food NZ Children Key results of 2019;22:1503–17.
the 2002 National Children’s Nutrition Survey, 2003. 49 Perignon M, Masset G, Ferrari G, et al. How low can dietary
26 University of Otago, Ministry of Health. A Focus on Nutrition: Key greenhouse gas emissions be reduced without impairing nutritional
findings of the 2008/09 New Zealand Adult Nutrition Survey [Internet]. adequacy, affordability and acceptability of the diet? A modelling
Wellington, 2011. http://www.moh.govt.nz study to guide sustainable food choices. Public Health Nutr
27 Tom Q, Liam M. Household food and drink waste: A product focus 2016;19:2662–74.
[Internet], 2014. Available: https://wrap.org.uk/sites/files/wrap/ 50 Saxe H. Diet as a Healthy and Cost-Effective Instrument in
Product-focused report v5_3.pdf Environmental Protection. In: Nriagu JO, ed. Encyclopedia of
28 Ministry of Health. Annual update of key results 2013/14: new environmental health. Elsevier Science, 2011: 70–82.
Zealand health survey. Wellington, New Zealand: Ministry of Health, 51 Statistics New Zealand. Kiwis growing taste for takeaways and
2014. eating out | Stats NZ [Internet], 2020. Available: https://www.stats.
29 National Institute of Diabetes and Kidney Diseases. Body weight govt.nz/news/kiwis-growing-taste-for-takeaways-and-eating-out
planner 2017 [Internet] [Accessed cited 2019 Sep 16]. [Accessed 19 May 2021].
10 Kidd B, et al. bmjnph 2021;0. doi:10.1136/bmjnph-2021-000262You can also read