AGRICULTURE AND ALLIED INDUSTRIES - For updated information, please visit www.ibef.org - IBEF Presentation

Page created by Adam Torres
 
CONTINUE READING
AGRICULTURE AND ALLIED INDUSTRIES - For updated information, please visit www.ibef.org - IBEF Presentation
AGRICULTURE AND ALLIED
INDUSTRIES

                                                          May 2021
                     For updated information, please visit www.ibef.org
AGRICULTURE AND ALLIED INDUSTRIES - For updated information, please visit www.ibef.org - IBEF Presentation
Table of Contents

        Executive Summary                   3

        Advantage India                     4

        Market Overview – Agriculture       6

        Market Overview – Food Processing   12

        Recent Trends and Strategies        17

        Growth Drivers                      20

        Opportunities                       30

        Key Industry Contacts               34

        Appendix                            36

 2
AGRICULTURE AND ALLIED INDUSTRIES - For updated information, please visit www.ibef.org - IBEF Presentation
Executive summary

 1 Global standing
 •   India is the largest producer of spices,
     pulses, milk, tea, cashew and jute, and the                                                                      5 Record production of
     second-largest producer of wheat, rice,
     fruits and vegetables, sugarcane, cotton                                                                         food grains
     and oilseeds.                                                                                                    •       During the 2020-21 crop year, food grain
 •   India is currently the world’s fourth-largest
                                                                                                           5
                                                                                                                              production reached a record of 303.34
     producer of agrochemicals.                                                                                               million tonnes. For FY 2021-22, the

                                                                        1
 •   India had the largest livestock population                                                                               government has set a target to increase
     of around 535.8 million, which translated to                                                                             production by 2%
     around 31% of the world’s livestock
     population in 2019.

 2 Favourable conditions                                                                                                  4 Rising consumption
                                                                                                                          expenditure
                                                                                                               4
 •   India has the second-largest arable
     land resources in the world. With 20
     agri-climatic regions, all 15 major
                                                                  2                                                       •    Consumer spending in India will return
                                                                                                                               to growth in 2021 post the pandemic-
     climates in the world exist in India. The                                                                                 led contraction, expanding by as
     country also possesses 46 of the 60                                                                                       much as 6.6%.

                                                                                         3
     soil types in the world.                                                                                             •    Private consumption expenditure (at
                                                                                                                               constant prices) was estimated at Rs.
 •   Strategic geographic location and                                                                                         83.25 lakh crore (US$ 1.18 trillion) in
     proximity to food importing nations                                                                                       FY20# against Rs. 79.08 lakh crore
     favour India in terms of exporting                                                                                        (US$ 1.12 trillion) in FY19.
     processed foods.                               3 Increasing farm mechanisations
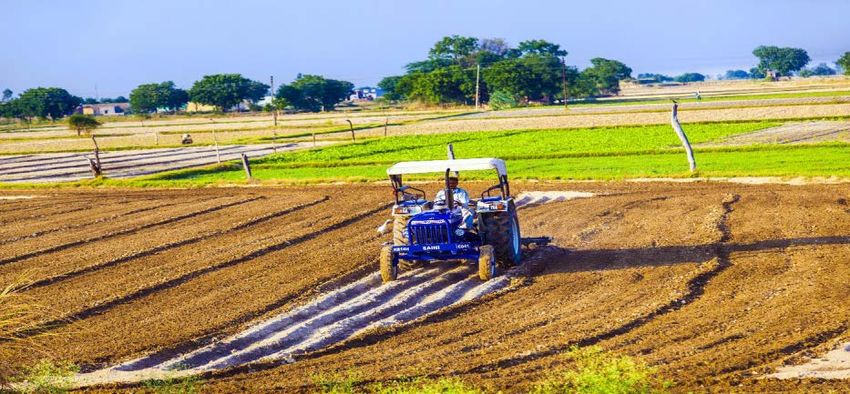
                                                   •   India is among the largest manufacturers of farm equipment like
                                                       tractors, harvesters and tillers. India accounts for nearly one-third
                                                       of the overall tractor production globally.
                                                   •   In 2020, production of tractors in the country stood at 863,125
                                                       units, with sales of 880,048 units and exports of 77,378 units.
 Note: #- as per provisional estimate
 Source: Ministry of Agriculture, Government of India, MOSPI, PIB, Tractor and Mechanization Association

 3
AGRICULTURE AND ALLIED INDUSTRIES - For updated information, please visit www.ibef.org - IBEF Presentation
Advantage India

4
AGRICULTURE AND ALLIED INDUSTRIES - For updated information, please visit www.ibef.org - IBEF Presentation
Advantage India

  1 Robust demand                                              4 Attractive opportunities
  ► Large population and rising urban                          ► Increase in demand for agricultural
    and rural income have added to                               inputs such as hybrid seeds and
    growth in demand for agriculture                             fertilizers.
    products.                                                  ► India can be among the top five
  ► Demand for processed food is                                 exporters of agro-commodities by
    rising with increase in disposable                           shifting its focus on cultivation and
    income,      urbanisation,   young                           effectively handholding farmers:
    population and nuclear families.                             World Trade Centre
  ► Changing lifestyle and increasing
    expenditure     on   health   and
                                           1               4   ► Investment opportunities to arise in
                                                                 agriculture, food infrastructure and
    nutritional foods have also added                            contract farming.
    to growth.
                                               ADVANTAGE
  2 Competitive advantage                         INDIA        3 Policy support
  ► India benefits from a large
                                           2               3   ► The govt. announced a PLI scheme
    agriculture    sector,   abundant                            for the food processing sector with
    livestock and cost competitiveness.                          an incentive outlay of Rs 10,900
  ► Lured by the size and returns of                             crore (US$ 1,484 million) over a
    the Indian market, foreign firms                             period of six years from FY22.
    have strengthened their presence                           ► Government of India is also aiming
    in India.                                                    to double farmers’ income by
  ► High proportion of agricultural land                         2022.
    (157 million hectares) and diverse                         ► Pradhan Mantri Fasal Bima Yojana
    agro-climatic conditions encourage                           aims to support sustainable
    cultivation of different crops.                              production in agriculture by
                                                                 providing financial support to
 Source: DPIIT, JLL India
                                                                 farmers who have incurred crop
                                                                 losses/damages.

 5
AGRICULTURE AND ALLIED INDUSTRIES - For updated information, please visit www.ibef.org - IBEF Presentation
Market Overview – Agriculture

MARKET OVERVIEW

 6
AGRICULTURE AND ALLIED INDUSTRIES - For updated information, please visit www.ibef.org - IBEF Presentation
Growth in agriculture

    In India, agriculture is the primary source of livelihood for ~54.6% of                            Gross Value Added by Agriculture and Allied sectors
     the population.                                                                                         (US$ billion) (at constant 2011-12 prices)

    The agriculture, forestry and fishing gross value added (GVA) growth
                                                                                                                                       CAGR 4.80%
     is likely to be 3% in the second quarter of FY21.

    Agriculture and allied activities recorded a growth rate of 3.4% at                             290.00
     constant prices in FY21.

                                                                                                                                             283.68
    Share of agriculture and allied sectors in gross value added (GVA) of                           280.00
     India at current prices stood at 17.8 % in FY20.

                                                                                                                                                               276.37
    Gross Value Added by agriculture, forestry and fishing was                                      270.00
     estimated at Rs. 19.48 trillion (US$ 276.37 billion) in FY20*.

                                                                                                                                                      267.90
                                                                                                                              266.48
                                                                                                     260.00
    As per the Union Budget 2021-22, Rs. 1.33 lakh crore (US$ 18.41
     billion) was allocated to the Ministry of Agriculture.
                                                                                                     250.00
    Between April 2020 and January 2021, principal agricultural

                                                                                                                     250.62
     commodities export stood at US$ 32.12 billion.
                                                                                                     240.00

                                                                                                     230.00

                                                                                                                     FY16

                                                                                                                              FY17

                                                                                                                                             FY18

                                                                                                                                                      FY19*

                                                                                                                                                               FY20**
 Notes: GDP - Gross Domestic Product, MOSPI – Ministry of Statistics and Programme Implementation;
 Source: Ministry of Agriculture, Print Release, RBI, MOSPI, Central Statistics Office (CSO), Union Budget 2021-22

 7
AGRICULTURE AND ALLIED INDUSTRIES - For updated information, please visit www.ibef.org - IBEF Presentation
Major seasons: Kharif and Rabi

                Rabi area sown in 2020-21 (million hectares)                                 Kharif area sown in 2020-21 (million hectares)
                          (as of January 29, 2021)                                                        (as on July 31, 2020)

                                     3.5
                                                                                                              10.9                      Rice
                               5.2
                                                                 Wheat                                                                  Pulses
                                                                                                        5.2              26.7
                         8.4                                     Pulses
                                                                                                                                        Coarse
                                                     34.6        Oilseeds                                                               Cereals
                                                                 Coarse Cereals                       15.0                              Oilseeds

                                                                 Rice                                                                   Sugarcane
                           16.7
                                                                                                                       11.2
                                                                                                                14.8                    Cotton

    There are two major agricultural seasons in India: Kharif and Rabi.
    Kharif season lasts from April to September (summer) - rice (paddy) is the season’s main crop and rabi season lasts from October to March
     (winter) - wheat is the season’s main crop.

      As of January 29, 2021, the total area sown with rabi crops was 68.5 million hectares, ~3% more than the previous season.

      According to the Ministry of Agriculture, 44% of wheat and other rabi crops were harvested out of a total of 97 lakh hectares sown area in the
       2020-21 rabi season.

      A total of 50.90 lakh hectares of kharif crops will be sown in the kharif season of 2021-22.

      For FY 2021-22, the government has set a production target of 151.43 million tonnes for the kharif season and 155.88 million tonnes for the rabi
       season.
 Source: Ministry of Agriculture and Farmers’ Welfare, Edelweiss’ Farm Facts Sector Update

 8
Increasing production

                                                                                                     Foodgrains and Commercial Crops Production (MT)
                     India’s Horticulture Production (MMT)
                                                                                                      Crop                          2018-19*   2019-20**   2020-21***
                                          CAGR 2.88%                                                  Rice                           116.48     117.94       102.36
        330.0
                                                                                                      Wheat                         103.67      107.18         -

                                                                                    326.6
        320.0
                                                                                                      Total Cereals                 263.14      272.66      135.21

                                                                       320.8
        310.0
                                              311.7
                                                                                                      Total Pulses                   22.08      23.01         9.31

                                                           311.1
        300.0
                                                                                                      Total Foodgrains              285.21      295.67      144.52
                                  300.6

        290.0
                                                                                                      Total Oilseeds                 31.52      33.50        25.73
        280.0
                      283.4

                                                                                                      Sugarcane                     405.41      358.13      399.83
        270.0
                                                                                                      Cotton (million bales of
        260.0                                                                                                                        28.04      36.04        37.12
                                                                                                      170 kg each)
                      FY16

                                  FY17

                                              FY18

                                                                                    FY20***
                                                           FY19#

                                                                       FY20#
                                                                                                      Jute & Metsa (million bales
                                                                                                                                      9.82       9.92         9.66
                                                                                                      of 180 kg each)

    Since 2010, production as well as yield of both major crops - rice and wheat have increased significantly. As per the first advance estimates,
     production of rice was estimated at record 102.36 million tonnes (MT), while production of food grains was estimated at 144.52 MT in 2020-21***
     crop year.

    The government has set a target to buy 42.74 million tonnes from the central pool in 2021; this is 10% more than the quantity purchased in 2020.

    For FY22, the government has set a record target for farmers to raise food grain production by 2% with 307.31 million tonnes of food grains. In
     FY21, production was recorded at 303.34 million tonnes against a target of 301 million tonnes

    The Economic Survey of India 2020-21 report stated that in FY20, the total food grain production in the country was recorded at 296.65 million
     tonnes—up by 11.44 million tonnes compared with 285.21 million tonnes in FY19.

    Area under horticulture is projected to rise by 2.7% in FY21.

 Note: * as per 4th revised estimate, ** as per 2nd advance estimate,*** as per 1st advance estimates, # as per final estimate
 Source: Ministry of Agriculture and Farmers’ Welfare

 9
Surge in demand of Indian agricultural products…(1/2)

    The total agricultural exports stood at US$ 37.31 billion between               Agricultural Exports from India (US$ billion)
     April 2020 and February 2021.

    The principal commodities that posted significant positive growth in                                CAGR 2.27%
                                                                             45.00
     exports between FY20 and FY21 were the following:
       •   Wheat and Other Cereals: 727% from Rs. 3,708 crore (US$ 505       40.00
           million) to Rs. 5,860 crore (US$ 799 million)

                                                                                                                      38.54
                                                                                                           38.21
       •   Non-Basmati Rice: 132% from Rs. 13,130 crore (US$ 1,789) to       35.00

                                                                                                                               35.09
           Rs. 30,277 crore (US$ 4,126 million)

                                                                                                 33.87
       •   Soya Meal: 132% from Rs. 3,087 crore (US$ 421 million) to Rs.

                                                                                                                                        32.12
                                                                                        32.08
                                                                             30.00
           7,224 crore (US$ 984 million)
       •   Raw Cotton: 68% from Rs. 6,771 crore (US$ 923 million) to Rs.     25.00
           11,373 crore (US$ 1,550 million)
       •   Sugar: 39.6% from Rs. 12,226 crore (US$ 1,666 million) to Rs.
                                                                             20.00
           17,072 crore (US$ 2,327 million)
       •   Spices: 11.5% from Rs. 23,562 crore (US$ 3,211 million) to Rs.
                                                                             15.00
           26,257 crore (US$ 3,578 million)
    The new Agriculture Export Policy aims to increase India’s              10.00
     agricultural export to US$ 60 billion by 2022 .

    The Government of India has come out with the Transport and              5.00
     Marketing Assistance (TMA) scheme to provide financial assistance
     for transport and marketing of agriculture products in order to boost    0.00
                                                                                      FY16      FY17      FY18     FY19       FY20     FY21*
     agriculture export.

    Government aims to raise fishery export from India to Rs. 1 lakh
     crore (US$ 14.31 billion) by 2024-25.
 Notes: CAGR is up to FY20, * From April 2020 until January 2021
 Source: World Trade Organisation, APEDA, DGCIS

 10
Surge in demand of Indian agricultural products…(2/2)

   Marine products, rice and spices are the largest agricultural export             Key Agricultural and Allied Sector Exports from India
    items in terms of value. Other major export items are buffalo meat,                                  (US$ billion)
    sugar, cotton, and oil products.
                                                                                     8.0
   Exports of marine products stood at US$ 4.97 billion, followed by
    non-basmati rice at US$ 3.51 billion and basmati rice at US$ 3.27                7.0
    billion in FY21*.
                                                                                           6.7
                                                                                     6.0
    In FY21*, buffalo meat exports stood at US$ 2.62 billion and sugar
     exports stood at US$ 1.92 billion.                                              5.0
                                                                                                 5.0
                                                                                     4.0                           4.4
   Key agricultural and allied sector exports from India in FY21*
                                                                                                             3.5                3.6
                                                                                     3.0                                 3.3          3.2     3.2
  Crop                                                             US$ billion                                                                      2.6
                                                                                     2.0
  Rice                                                                  6.78                           2.0                                                2.0 1.9
                                                                                     1.0
  Marine Products                                                       4.97                                                                                        1.1 1.3
                                                                                     0.0
  Spices                                                                3.19

  Buffalo Meat                                                          2.62

  Sugar                                                                 1.92

  Cotton Raw Including Waste                                            1.28                                             FY20         FY21*
  Oil Meal                                                              1.15

 Notes: * From April 2020 until January 2021
 Source: Ministry of Agriculture and Farmers’ Welfare, APEDA, Ministry of Commerce

 11
Market Overview – Food Processing

MARKET OVERVIEW

 12
Food processing industry in India…(1/2)

    Food and grocery market in India is the sixth-largest in the world.                          Foreign direct investments (FDI) in India's food processing sector
     Food processing industry contributes 32% to this food market and is                           stood at US$ 904.7 million in FY20.
     also one of the largest industries in the country, contributing 13% to
     total export and six% of industrial investment.                                              According to National Accounts Division, Ministry of Statistics and
                                                                                                   Programme Implementation, food processing units in India is
    The Indian food processing industry is expected to reach US$ 535                              growing at 7.68% annually.
     billion by 2025-26 on the back of government initiatives such as
     planned infrastructure worth US$ 1 trillion and Pradhan Mantri Kisan
     Sampada Yojna.

    The cold chain infrastructure created by 183 completed cold chain
     projects until December 31, 2019, were the following:
                                                                                                 Requirement of cold chain
      •   6.19 lakh MT of Cold Storage, Controlled Atmosphere
          (CA)/Modified Atmosphere (MA) Storage and Deep Freezer.                                                                                                Approximate
                                                                                                 Component                    Existing Capacity
      •   176.50 MT per hour of Individual Quick Freezing (IQF).                                                                                                 Requirement

      •   78.61 Lakh Litres Per Day (LLPD) Milk Processing/Storage.                              Integrated Pack
                                                                                                                                 250 numbers                    70,000 numbers
      •   990 reefer vehicles.                                                                   Houses

    Out of the total 39 mega food parks that were sanctioned, 22 mega
     food parks are operational, as of January 2021.                                             Reefer Trucks                < 10,000 numbers                  62,000 numbers

    In November 2020, the government inaugurated a mega food park in
     Punjab worth Rs. 107.83 crores (US$ 14.6 million) that will be spread
                                                                                                 Cold store (Bulk &
     across over 55 acres of land.                                                                                             32 million tonnes               35 million tonnes
                                                                                                 distribution hubs)
    Milk production in the country is expected to increase to 208 MT in
     FY21 from 198 MT in FY20, registering a growth of 10% y-o-y. Milk                           Ripening
     processing capacity is expected to double from 53.5 MMT to 108                                                              800 numbers                     9000 numbers
                                                                                                 Chambers
     MMT by 2025.

    The food processing industry employs about 1.77 million people.

 Source: USDA - India’s Food Processing Sector Poised for Growth 2019, Ministry of Agriculture and Farmers’ Welfare, Ministry of Food Processing Industries, Crisil

 13
Food processing industry in India…(2/2)

    Sales of processed food in the domestic market have been increasing    FDI inflows1 in Food Processing Industries between April and
     at a faster pace. India’s food and beverage packaging industry is                       December 2020 (US$ billion)
     expected to reach US$ 122.78 billion by 2025.
                                                                                                                                                              1.07 10.24
    The food processing sector allows 100% FDI under the automatic          10.00
                                                                                                                                                      0.63
     route.                                                                   9.00                                                            0.90
                                                                              8.00                                                    0.73
    The sector has also recorded a sharp increase in investments with                                                        0.51
                                                                              7.00                                    0.52
     cumulative FDI inflows of US$ 10.24 billion between April 2000 and                                       3.98
                                                                              6.00
     December 2020.
                                                                              5.00
    The processed food market in India is expected to grow to Rs.            4.00
     3,451,352.5 crore (US$ 470 billion) by 2025, from Rs. 1,931,288.7        3.00
     crore (US$ 263 billion) in FY20.                                         2.00   1.23 0.18 0.40
                                                                              1.00
    In April 2021, the Government of India approved a PLI scheme for the
                                                                              0.00
     food processing sector with an incentive outlay of Rs 10,900 crore

                                                                                                FY12

                                                                                                       FY13

                                                                                                               FY14

                                                                                                                       FY15

                                                                                                                               FY16

                                                                                                                                       FY17

                                                                                                                                               FY18

                                                                                                                                                       FY19

                                                                                                                                                                FY20

                                                                                                                                                                       FY01-21*
                                                                                      FY01-11
     (US$ 1,484 million) over a period of six years starting from FY22.

 Notes: * until December 2020
 Source: DPIIT, Crisil

 14
Export of processed food and related products

   Exports of Processed Food and Related Products (US$ million)                    Top Importers of Processed Items from India in 2019-20

                                                660                                Product                                  Countries
      700                                                            647
                                        583
      600                                             554.37

      500                                                                          Processed Vegetables         USA, France, Germany, UK, Belgium
                                                               402
      400       354          371.32
                       312                                                 304.5
      300                                                                                                       USA, Netherlands, Saudi Arabia, UK,
                                                                                   Processed Fruits & Juices
                                                                                                                             Germany
      200

      100                                                                                                      United Arab Emirates, Myanmar, Qatar,
                                                                                   Processed Meat
         0                                                                                                               Maldives, Bhutan
                   Processed              Miscellaneous        Processed Fruits,
                   Vegetables             Preparations          Juices & Nuts

                                   FY19       FY20     FY21*

   Miscellaneous preparations export reached US$ 660 million in FY20,
    followed by processed fruits, juices & nuts at US$ 647 million and
    processed vegetables at US$ 312 million.

 Notes: * From April 2020 until December 2020
 Source: APEDA

 15
Food processing segments and private players

      1   Fruits, Vegetables and Processed Grains

      2   Milk and Milk Products

      3   Meat, Poultry and Marine Products

      4   Consumer Food(Alcoholic Beverages, Soft Drinks,
          Packaged Drinking Water, Packaged Food)

 16
Recent Trends and Strategies

RECENT TRENDS AND STRATEGIES

 17
Rising demand of Indian products in international market
 1 CHANGING CONSUMER TASTES                                                               8 HORTICULTURE
 •    Wide array of products, coupled with increasing                                     OUTPUT/OUTLOOK
      global connectivity, has led to a change in the                                 •   Production of horticulture crops in India reached a record
      taste and preference of domestic consumers.                                         326.6 million metric tonnes (MMT) in 2020-21*, an
                                                                                          increase of 5.81 million metric tonnes over FY20.

                                                                1                8
 2 EXPANSION OF                                                                                          7 STRENGTHENING
 INTERNATIONAL COMPANIES                                                                                 PROCUREMENT VIA DIRECT
 •    Italian confectionery major, Ferrero, will
      invest Rs. 2,000 crore (US$ 310.3
                                                                                                         FARMER-FIRM LINKAGES
      million) by the end of 2021 to make                                                                •    Contract farming has helped both the
      India a hub for developing new
      products.                                    2                                            7             processing companies, via increasing
                                                                                                              sales and therefore increasing their
 •    Nestle India will invest Rs. 700 crore                                                                  incomes, as well as Indian farmers by
      (US$ 100.16 million) in construction in                                                                 providing access to better technology
      its ninth factory in Gujarat by the end of                                                              and fetching better prices in the market.
      2021.
 3 RISING DEMAND ON                                                                                       6 PRODUCT INNOVATION AS
 INDIAN PRODUCTS IN                                3                                            6         THE KEY TO EXPANSION
 INTERNATIONAL MARKET                                                                                     •   Heritage Foods, a Hyderabad-based
 •    In November 2019, Haldiram entered                                                                      company, has plans to add five more
      into an agreement for Amazon's                                                                          milk processing units in the next five

                                                                4                5
      global selling program to E-tail its                                                                    years for an investment of US$ 22.31
      delicacies in the United States.                                                                        million as part of its expansion plan to
                                                                                                              achieve US$ 1 billion turnover by 2022.

 4 EMPHASIS ON HEALTHIER INGREDIENTS                                   5 HIGHER CONSUMPTION OF HORTICULTURE
 •    Food processing companies are serving health and wellness as
      a new ingredient in processed food because of it being low on
                                                                       CROPS
      carbohydrates and cholesterol, for example, zero-% trans fat     •   There is a surge in demand for fruits and vegetables as a result of shift in
      snacks and biscuits, slim milk, and whole wheat products, etc.       consumption. Accordingly, Indian farmers are also shifting production.
 Notes: * 1st advance estimate
 Source: News Article

 18
Strategies adopted

 1 Rising business and                                                                                           3 Low-cost price strategy
 product innovation                                                                                              •   Low-cost price strategy is adopted so as to make
                                                                                                                     the product affordable to consumers by
 •    Companies have been moving up the                                                                              guaranteeing them value for money. The main aim
      value chain, for example, cooperatives                                                                         is to provide quality products to consumers at
      are transitioning from being pure                                                                              minimum cost like Amul Milk. Parle and Sunfeast
      producers of milk to offering a wide                                                                           have been working on their cost and pricing
      range of dairy products.                                                                                       strategy to market economical products.
 •    Both domestic and global firms have
      been focusing on product innovation to
      cater to domestic tastes while also
      introducing international flavours. For
      example, Ruchi Soya is innovating by
      entering into the ready-to-cook segment
      to meet the needs of people with
      significant time constraint and provide a
      rich source of protein in the breakfast
      category.

                                                                                          2 Research
                                                                                          •   Crop protection, soil enhancement, and increased productivity are the
                                                                                              major segments for the industry.
                                                                                          •   As per the Union Budget 2021-22, Rs. 8,514 crore (US$ 1.17 billion) was
                                                                                              allocated to the Department of Agricultural Research and Education.

 Source: Ministry of Agriculture and Farmers’ Welfare, Government of India, News Sources, Union Budget 2021-22

 19
Growth Drivers

GROWTH DRIVERS

 20
Growth drivers of Indian agriculture

                                             1 Demand-side drivers
                                              Population and income growth

                                              Increasing exports
  2 Supply-side drivers                       Favourable demographics

   Hybrid and genetically modified seeds

   Favourable climate for agriculture and
    wide variety of crops

   Mechanisation

   Irrigational facilities

   Green revolution in Eastern India
                                                          3 Policy support
                                                           Growing institutional credit

                                                           Increasing MSP

                                                           Introduction of new schemes like
                                                            Paramparagat Krishi Vikas Yojana,
                                                            Pradhanmantri Gram Sinchai Yojana,
                                                            and Sansad Adarsh Gram Yojana

                                                           Opening exports of wheat and rice

                                                           Approval of National Mission on Food
                                                            Processing

 Source: News Article

 21
Growing area under irrigation

    Gross irrigated area under food grains was estimated to reach 64.8                                            Gross irrigated area (million hectares)
     million hectares in FY19.

    Of the wide variety of crops in India, rice and wheat are the most                                 70.00
     irrigated.

    With growing investments in irrigation, the dependence on monsoon                                  68.00

                                                                                                                                                         68.40
     has declined considerably over the years.
                                                                                                        66.00
    As per Union Budget 2021-22, Rs. 4,000 crore (US$ 551.08 million)
     was allocated towards implementing Pradhan Mantri Krishi

                                                                                                                                                                  64.80
                                                                                                        64.00
     Sinchayee Yojana (PMKSY-PDMC).

    A long-term irrigation fund has been set up under NABARD. A                                        62.00
     dedicated micro-irrigation fund will be set up under NABARD to

                                                                                                                                                61.63
                                                                                                                                     61.07
     achieve the goal, ‘per drop more crop’. The government has                                         60.00
     allocated Rs. 5,000 crore (US$ 709.32 million) for the year 2020-21.
                                                                                                        58.00
    During FY16-FY20, an area of 4.69 million hectare was covered

                                                                                                                       58.12
     under Micro Irrigation through PMKSY-PDMC.
                                                                                                        56.00
    In May 2019, NABARD announced an investment of Rs. 700 crore
     (US$ 100 million) venture capital fund for equity investments in                                   54.00
     agriculture and rural-focused start-ups.

    In November 2020, Netafim India, a leading smart irrigation solutions                              52.00
                                                                                                                    FY10           FY11        FY13     FY18     FY19
     provider, launched FlexNet, a revolutionary mainline and sub-
     mainline piping for above and below-ground drip irrigation systems
     for Indian farmers.

 Source: Food and Agricultural Organisation US, Ministry of Agriculture, *Ministry of Agriculture and Farmers’ Welfare Annual Report 2018-19

 22
Institutional credit and investments on a rise

   Agricultural credit target is set at Rs.16.5 lakh crore (US$ 226 billion)   Credit to Agriculture & Allied Activities (outstanding) (US$
    in FY22.                                                                                               billion)

   Agricultural credit disbursal stood at Rs. 11.75 lakh crore (US$ 167
                                                                                250
    billion) in FY20 and Rs. 15 lakh crore (US$ 204 ) in FY21.

   In October 2019, Pioneering Ventures (PV) announced the launch of
                                                                                                                                      226
    ‘Rural India Impact’ fund of US$ 70 million, targeted to make growth
                                                                                200
    capital available to companies it has been backing so far.                                                                204

                                                                                                                       167
                                                                                150                    160     159
                                                                                                154
                                                                                        137

                                                                                100

                                                                                  50

                                                                                  -
                                                                                       FY16    FY17    FY18   FY19    FY20   FY21    FY22

 Source: Ministry of Agriculture and Farmers’ Welfare, RBI, AgFunder

 23
Rising income and growing middle class to drive demand for
processed food

   Strong growth in per capita income has resulted in greater demand
                                                                                                              GDP per capita at current prices (US$)
    for food items.

   Per capita GDP of India is expected to reach US$ 3,277 in 2024 from                        3,500
    US$ 2,036 in 2018.

                                                                                                                                                                          3,277
   Packaged food industry in India is expected to cross US$ 65 billion
                                                                                               3,000

                                                                                                                                                                  3,023
    by 2020 and become the third-largest market for packaged foods
    globally.

                                                                                                                                                          2,791
                                                                                               2,500

                                                                                                                                                  2,578
   The Ministry of Food Processing has been allocated Rs. 1,308.66

                                                                                                                                          2,379
    crore (US$ 180.26 million) in the Union Budget 2021-22.

                                                                                                                                  2,199
                                                                                               2,000
   There has also been a shift in demand:

                                                                                                                          2,036
                                                                                                                  2,014
      •   from carbohydrates to meat products (in line with the various

                                                                                                          1,762
                                                                                               1,500
          phases of economic growth)

      •   and to convenience foods, and organic and diet foods
                                                                                               1,000

                                                                                                 500

                                                                                                    0

                                                                                                          2016

                                                                                                                  2017

                                                                                                                          2018

                                                                                                                                  2019

                                                                                                                                          2020

                                                                                                                                                  2021

                                                                                                                                                          2022

                                                                                                                                                                  2023

                                                                                                                                                                          2024
 Source: International Monetary Fund, World Economic Outlook Database, April 2019, Euromonitor, Union Budget 2021-22

 24
Competitive advantage

   India’s comparative advantage lies in its favourable climate, large                         Product                  Production in 2019-20 (MT)
    agriculture sector and livestock base, long coastline and inland water
    resources.                                                                                  Milk                                208
   India also has an edge in cost of production compared to its
    competitors in Asia and the developed world.                                                Pulses                             23.01

   The Government of India targets production of 32 million tonnes of
                                                                                                Meat                                7.7
    pulses by 2030.

                                            Units                   Global Rank                 Banana                              31.7

 Arable land                                                                                    Mango                               20.8
                                             161                           2
 (million hectares)

  Area under irrigation                                                                         Tea (million kgs)                  1350
                                              55                           1
 (million hectares)

  Coastline                                                                                     Rice                              117.94
                                              7.5                          7
 ('000 kilometers)

 Cattle (million)                                                                               Sugarcane                         358.13
                                              3.1                          1
                                                                                                Wheat                              102.2

 Source: Ministry of Agriculture and Farmers’ Welfare, Tea Board, Department of Animal Husbandry, Dairying & Fisheries

 25
Favourable policies are supporting the sector growth … (1/3)

      1               Agriculture Export
                      Policy, 2018
                                                    •
                                                    •
                                                        New export policy was cleared by the Government of India in December 2018.
                                                        Targets increasing India’s agricultural export to over US$ 60 billion by 2022.

                                                    •   Prime Minister of India launched the Pradhan Mantri Kisan Samman Nidhi Yojana (PM-Kisan) and
                      Pradhan Mantri Kisan

      2               Samman Nidhi Yojana
                      (PM-Kisan)
                                                        transferred Rs. 2,021 crore (US$ 284.48 million) to bank accounts of more than 10 million
                                                        beneficiaries on February 24, 2019. As per the Union Budget 2021-22, Rs. 65,000 crore (US$ 8.9
                                                        billion) was allocated to Pradhan Mantri Kisan Samman Nidhi (PM-Kisan).

                      Pradhan Mantri                •   Pradhan Mantri Annadata Aay SanraksHan Abhiyan' (PM-AASHA) is an umbrella scheme to ensure

      3               Annadata Aay                      minimum support price (MSP) to farmers. It comprises the previous price support scheme (PSS), with
                      SanraksHan Abhiyan'               few modifications and introduction of new schemes, including price deficiency payment scheme
                      (PM-AASHA)                        (PDPS) and pilot of private procurement and stockist scheme (PPSS).

                      Pradhan Mantri Krishi •           As per the Union Budget 2021-22, Rs. 11,588 crore (US$ 1.5 billion) was allocated to Pradhan Mantri

      4               Sinchai Yojana
                      (PMKSY)
                                                        Krishi Sinchai Yojana (PMKSY).

                      Model Contract                •   In May 2018, the Government finalised the Model Contract Act to include all services in the agriculture

      5               Farming & Services
                      Act 2018
                                                        value chain under its ambit along with contract farming activity. The act has laid special emphasis on
                                                        protecting farmers’ rights in the country.

 Source: Ministry of Agriculture and Farmers’ Welfare, Union Budget 2021-22

 26
Favourable policies are supporting the sector growth … (2/3)

                                                      •   A minimum fixed pension of Rs. 3000 (US$ 42.92) will be provided to eligible small and marginal
                      Pradhan Mantri                      farmers on attaining the age of 60 years, subject to certain exclusion clauses.

      6               Kisan Maan-Dhan
                      Yojana (PM-KMY)
                                                      •   The beneficiary is required to make a monthly contribution between Rs. 55 to Rs. 200 (US$ 0.78 to
                                                          2.86) to the Pension Fund depending on the age of entry into the scheme and a provision of equal
                                                          contribution by the Central Government.

                      National Animal
                                                      •   In order to eradicate the Foot & Mouth Disease (FMD) and Brucellosis amongst the livestock, the
                      Disease Control

       7              Programme for Foot
                      and Mouth Disease
                      and Brucellosis
                                                      •
                                                      •
                                                          scheme was launched in September 2019.
                                                          The scheme is aiming at ensuring 100% vaccination of cattle, buffalo, sheep, goat and pig.
                                                          In May 2020, Rs. 13,343 crore (US$ 1.89 billion) was allocated to the scheme.

                                             •            The sector has been assigned a priority status for bank credit.
                      Pradhan Mantri         •            60 Agri Export Zones (AEZ) have been set up across the country.

       8              Formalization of Micro •
                      Food Processing
                      Enterprises (PM FME)
                                             •
                                                          Between FY15-20, around 1303 cold storages with 45 lakh tonnes have been established.
                                                          In May 2020, Government announced the launch of animal husbandry infrastructure development
                                                          fund of Rs. 15,000 crore (US$ 2.13 billion).

                                                      •   The Electronic National Agriculture Market (e-NAM), which was launched in April 2016 to create a

      9               APMC farmers go
                      cashless
                                                          unified national market for agricultural commodities by networking existing APMCs. It had 16.9 million
                                                          farmers and 157,778 traders registered on its platform until February 2021. Over 1,000 mandis in
                                                          India are already linked to e-NAM and 22,000 additional mandis are expected to be linked by 2021-22.

                                                      •   Moreover, the Government plans to launch a programme named 'SAMPADA' for the food processing

   10                 Focus on R&D and
                      modernisation
                                                          sector with investments worth US$ 892.46 million to integrate current with new schemes, and with an
                                                          aim to reduce waste and double farmer's income.

 Source: Ministry of Agriculture & Farmers' Welfare

 27
Favourable policies are supporting the sector growth … (3/3)

                                                      •   The sector has been assigned a priority status for bank credit.
                                                      •   60 Agri Export Zones (AEZ) have been set up across the country.

      11              Focus on
                      infrastructure
                                                      •
                                                      •
                                                          Between FY15-20, around 1303 cold storages with 45 lakh tonnes have been established.
                                                          In May 2020, Government announced the launch of animal husbandry infrastructure development
                                                          fund of Rs. 15,000 crore (US$ 2.13 billion).

                                                      •   Ministry of Food Processing Industries (MOFPI) launched a new centrally sponsored scheme (CSS),

      12              National Mission on
                      Food Processing
                                                          National Mission on Food Processing, to promote facilities for post-harvest operations, including
                                                          setting up of food processing industries in India. In Union Budget 2019-20, the Government
                                                          announced to spend Rs. 110 crore (US$ 15.74 million) in Union Territories only.

                                                      •   Announced in December 2020.

      13              Agricultural Pump
                      Power Policy
                                                      •   As of March 2021, a total of 582,114 farmers in Maharashtra have paid the arrears of agricultural
                                                          pump electricity bills amounting to Rs. 511.26 crore (US$ 63.37 million).

                                                      •   Aims to support sustainable production in agriculture by providing financial support to farmers who
                                                          have incurred crop losses/damages due to unforeseen events. This will help stabilise the income of
   14                 Pradhan Mantri Fasal
                      Bima Yojana (PMFBY)                 farmers, ensure continuance in farming, encourage them to adopt innovative and modern agricultural
                                                          practices and ensure flow of credit to the agriculture sector.

 Source: Ministry of Agriculture & Farmers' Welfare

 28
Highlights of Union Budget 2021-22

    The Budget identified agriculture sector as one of the key drivers of the economy.

    It ensured MSP at a minimum 1.5x the production cost across all commodities.

    SWAMITVA scheme will be extended to all states/UTs, 1.80 lakh property-owners in 1,241 villages have already been provided
      cards.

    For FY22, the agricultural credit target was enhanced to Rs. 16.5 lakh crore (US$ 226.29 billion), with animal husbandry, dairy and
      fisheries as the focus areas.

    The Rural Infrastructure Development Fund will be enhanced to Rs. 40,000 crore (US$ 5.49 billion) from Rs. 30,000 crore (US$
      4.11 billion).

    The ‘Micro Irrigation Fund’ will be doubled to Rs. 10,000 crore (US$ 1.37 billion).

    The ‘Operation Greens’ scheme will be extended to 22 perishable products to boost value-addition in agriculture and allied sectors.

    Through e-NAM (National Agriculture Market), ~1.68 crore farmers were registered and trade worth Rs. 1.14 lakh crore (US$ 15.63
      billion) was carried out; 1,000 more mandis will be integrated to achieve transparency and bring competitiveness.

    Customs duty on cotton was increased from 0% to 10% and raw silk and silk yarn from 10% to 15%.

    Agriculture Infrastructure and Development Cess (AIDC) was added to numerous items.

    APMCs will be able to access the agriculture infrastructure funds to augment infrastructure facilities.

  Source: Union Budget 2021-22

 29
Opportunities

OPPORTUNITIES

 30
Opportunities

 2 Supply chain                                                                1 Farm management
 infrastructure and                                                            services
 contract farming                                                               New agri business, which provides inputs
                                                                                 such as seeds and fertilizers along with
  1,303 cold storages with a capacity of

                                                   1
                                                                                 providing advice and training farmers on
   45 lakh MT have been established                                              latest agricultural practices.
   since 2015.
                                                                                In December 2019, the Department of
  Private warehouse operators are                                               Agriculture, Cooperation and Farmers
   supported by multiple income streams,                                         Welfare created a task force to develop a
   subsidy and availability of credit.                                           complete farmers’ database for better
                                                                                 planning, monitoring, strategy formulation
  It is expected that 4% growth in the
                                                                                 and smooth implementation of schemes

                                               2
   food grain storage capacity would

                                                            3
                                                                                 for the entire country.
   restructure agricultural sector over the
   next few years.
  Investment potential of US$ 22 billion
   in food processing infrastructure; 100%
   FDI in this area.                                                                3 Potential global
  The Government’s main focus is on                                                outsourcing hubs
   supply chain-related infrastructures like
   cold storage, abattoirs and food parks.          Huge opportunity exists for agri input segments like seeds and plant
                                                     growth nutrients.
                                                    As of January 2021, out of the 37 approved mega food parks in the
                                                     country, 22 were operational.
                                                    In Sept 2019, the World Bank sanctioned Rs. 3,000 crore (US$ 429.25
                                                     million) to finance mini and mega food parks in the country.
 Source: News Article

 31
Government initiatives that will further prop up the sector … (1/2)

    In March 2021, the Union Cabinet, chaired by Prime Minister Narendra Modi, approved a memorandum of understanding (MoU) between the
     Ministry of Agriculture and Farmers' Welfare of India and the Ministry of Agriculture of Fiji for co-operation in the field of agriculture and allied
     sectors.

    In December 2020, Indian Council of Agricultural Research won the ‘International King Bhumibol World Soil Day Award' from the United Nation's
     Food and Agriculture Organisation for raising awareness about importance of soil health among all stakeholders.

    In the next five years, the central government will aim US$ 9 billion in investments in the fisheries sector under PM Matsya Sampada Yojana. The
     government is targeting to raise fish production to 220 lakh tonnes by 2024-25.

    In November 2020, the agricultural ministry inaugurated the cooperative ‘Nafed’ programme to help in setting up “Honey Farmer Producers
     Organisations” for beekeepers in West Bengal, Bihar, Madhya Pradesh, Uttar Pradesh and Rajasthan.

    In November 2020, Minister of Consumer Affairs, Food and Public Distribution, Mr. Piyush Goyal announced that the Food Corporation of India
     and state agencies are set to procure a record quantity of 742 LMT (lakh metric tonnes) paddy during the ongoing Kharif crop season as against
     627 LMT paddy last year.

    In October 2020, the Tribal Cooperative Marketing Development Federation of India (TRIFED) included 100 new Forest Fresh Organic Products
     sourced from tribes across India on its e-marketplace (tribesindia.com).

    In October 2020, Agri-lender Nabard (National Bank for Agriculture and Rural Development) proposed plans to set up a subsidiary to provide
     guarantee for loans under agriculture and rural development.

    In October 2020, the government announced that it is putting up a common data infrastructure for farmers in the country. PMFBY (Pradhan Mantri
     Fasal Bima Yojana), PM-Kisan and the Soil Health Card will be integrated through a common database, along with land record details.

    In September 2020, National Cooperative Development Corporation (NCDC) sanctioned Rs.19,444 crore (US$ 2.7 billion), as first instalment, to
     Chhattisgarh, Haryana and Telangana for kharif paddy procurement under minimum support price (MSP) operations.

  Source: Press Information Bureau, Ministry of Agriculture and Farmers’ Welfare, DIPP; Note: RFID - Radio Frequency Identification, News Sources, Edelweiss’ Farm Facts Sector Update

 32
Government initiatives that will further prop up the sector … (2/2)

    In September 2020, the government launched the PM Matsya Sampada Yojana, e-Gopala App and several initiatives in fisheries production,
     dairy, animal husbandry and agriculture. Under this scheme, an investment of Rs. 20,000 crore (US$ 2.7 billion) will be made in the next 4-5 years
     in 21 states.

    In May 2020, the Government of India announced an infrastructure development fund of Rs. 15,000 crore (US$ 2.31 billion) to promote
     investments by private players and MSMEs in segments such as dairy, meat processing and animal feed plants.

    Allocation of US$ 3.9 billion for RFID, US$ 234 million for long - term rural credit fund, US$ 7.03 billion for short - term cooperative rural credit
     finance fund, and US$ 3.9 billion for short - term RRB refinance fund.

    Food Processing Industries have taken few initiatives for developing the food processing sector that would enhance the exports of agro and
     processed foods and income of farmers.

    The Government is planning to invest US$ 8 billion to revive four fertilizer plants and setting up two plants to produce farm nutrients.

    Financial outlay of US$ 35.47 million has been announced under the National Dairy Development Board (NDDB) to boost milk output and per
     animal production of milk.

    Almost 138.43 LMT of food grains have been lifted and transported through 4,944 rail rakes, 277.73 LMT through roads, and 21,724 MT grains
     through 14 ships under Atmanirbhar Bharat Package until June 2020.

    As per reports available from Food Corporation of India, all States and Union Territories combined have lifted about 118 LMT food grains from FCI
     depots/central pool and distributed over 111.52 LMT of allocated food grains among NFSA beneficiaries for the period April-June 2020.

  Source: Ministry of Agriculture and Farmers’ Welfare, DIPP; Note: RFID - Radio Frequency Identification, News Sources

 33
Key Industry Contacts

34
Key Industry Contacts

                Agency                                                           Contact Information

                         National Institute of         Rajendranagar, Hyderabad-500 030, Andhra Pradesh
                                                       Phone: 91 -040-24594509
                         Agricultural Extension        E-mail: helpline@manage.gov.in
                         Management                    Website: https://www.manage.gov.in/

                         National Institute of         Bambala, Kota Road, Jaipur-302033, Rajasthan
                                                       Phone: 0141-2770027
                         Agricultural Marketing
                                                       Fax: 0141-2771938, 2770027
                         (NIAM)                        E-mail: dgccsniam@gmail.com
                                                       Website: https://www.ccsniam.gov.in/
                         Central Insecticides Board
                                                       Machinary Store Building, N.H.IV Faridabad
                         and Registration Committee
                                                       Phone: 0129 -2413002

                                                       Kera Bhavan, SRVHS Road, Kochi, Kerala-682011
                         Coconut Development           Phone: 0484-2375216, 0484-2377737
                         Board                         Fax: 91 484-2377902
                                                       E-mail: kochi.cdb@gov.in
                                                       Website: https://www.coconutboard.nic.in/
                                                       PB No 40, Anand-388 001
                                                       Phone: 02692-260148/260149/260160
                         National Dairy Development
                                                       Fax: 02692-260157
                         Board (NDDB)                  E-mail: anand@nddb.coop
                                                       Website: https://www.nddb.coop/
                                                       Ministry of Agriculture, Government of India, 85, Institutional Area,
                                                       Sector-18
                         National Horticulture Board   Gurgaon-122015, Haryana
                         (NHB)                         Phone: 91 0124-2342992, 2347441, 2342989-90
                                                       E-mail: md@nhb.gov.in
                                                       Website: http://nhb.gov.in/

                         National Oilseeds and
                         Vegetable Oils                Krishi Bhavan, New Delhi 110 114
                         Development Board             Phone: 91-11-25846010
                         (NOVOD)

 35
Appendix

36
Glossary

   AIBP: Accelerated Irrigation Benefit Programme

   Breeder seeds: Seeds move from germ-plasm (research) stage to breeder stage

   CAGR: Compound Annual Growth Rate

   Certified/quality seeds: Foundation seeds are further multiplied to get certified seeds, which are sold to farmers

   FMTTI: Farm Machinery Training and Testing Institutes

   Foundation seeds: Breeder seeds are multiplied as foundation seeds

   FY: Indian Financial Year (April to March); So, FY12 implies April 2011 to March 2012

   KCC: Kisan Credit Card

   MSP: Minimum Support Prices

   NFSM: National Food Security Mission

   NMAM: National Mission on Agricultural Mechanisation

   PGN: Plant Growth Nutrients

   RKVY: Rashtriya Krushi Vikas Yojana is a central Government scheme providing funds to state Governments to spend
      on agriculture

   Wherever applicable, numbers have been rounded off to the nearest whole number

 37
Exchange rates

  Exchange Rates (Fiscal Year)                                               Exchange Rates (Calendar Year)

                    Year                         Rs. Equivalent of one US$              Year                  Rs. Equivalent of one US$
                  2004-05                                 44.95                         2005                           44.11
                 2005-06                                  44.28                         2006                           45.33
                 2006-07                                  45.29                         2007                           41.29
                 2007-08                                  40.24                         2008                           43.42
                 2008-09                                  45.91                         2009                           48.35
                 2009-10                                  47.42                         2010                           45.74
                 2010-11                                  45.58                         2011                           46.67
                 2011-12                                  47.95                         2012                           53.49
                 2012-13                                  54.45                         2013                           58.63
                 2013-14                                  60.50                         2014                           61.03
                 2014-15                                  61.15                         2015                           64.15
                 2015-16                                  65.46                         2016                           67.21
                 2016-17                                  67.09                         2017                           65.12
                 2017-18                                  64.45                         2018                           68.36
                 2018-19                                  69.89                         2019                           69.89
                 2019-20                                  70.49                         2020                           74.18
                 2020-21                                  73.20                         2021*                          74.94
 Note: As of April 2021
 Source: Reserve Bank of India, Average for the year

 38
Disclaimer

  India Brand Equity Foundation (IBEF) engaged Sutherland Global Services private Limited to prepare/update this presentation.

  All rights reserved. All copyright in this presentation and related works is solely and exclusively owned by IBEF, delivered during the course of
  engagement under the Professional Service Agreement signed by the Parties. The same may not be reproduced, wholly or in part in any material
  form (including photocopying or storing it in any medium by electronic means and whether or not transiently or incidentally to some other use of this
  presentation), modified or in any manner communicated to any third party except with the written approval of IBEF.

  This presentation is for information purposes only. While due care has been taken during the compilation of this presentation to ensure that the
  information is accurate to the best of Sutherland Global Services’ Private Limited and IBEF’s knowledge and belief, the content is not to be construed
  in any manner whatsoever as a substitute for professional advice.

  Sutherland Global Services Private Limited and IBEF neither recommend nor endorse any specific products or services that may have been
  mentioned in this presentation and nor do they assume any liability, damages or responsibility for the outcome of decisions taken as a result of any
  reliance placed on this presentation.

  Neither Sutherland Global Services Private Limited nor IBEF shall be liable for any special, direct, indirect or consequential damages that may arise
  due to any act or omission on the part of the user due to any reliance placed or guidance taken from any portion of this presentation.

 39
You can also read