India telecoms market report 2020
←
→
Page content transcription
If your browser does not render page correctly, please read the page content below

India telecoms market report 2020

                                    India telecoms market
                                               report 2020

                                                                         Alex Boisot

                                                                     January 2020
                                    Figures updated in April 2020 with data to 4Q 2019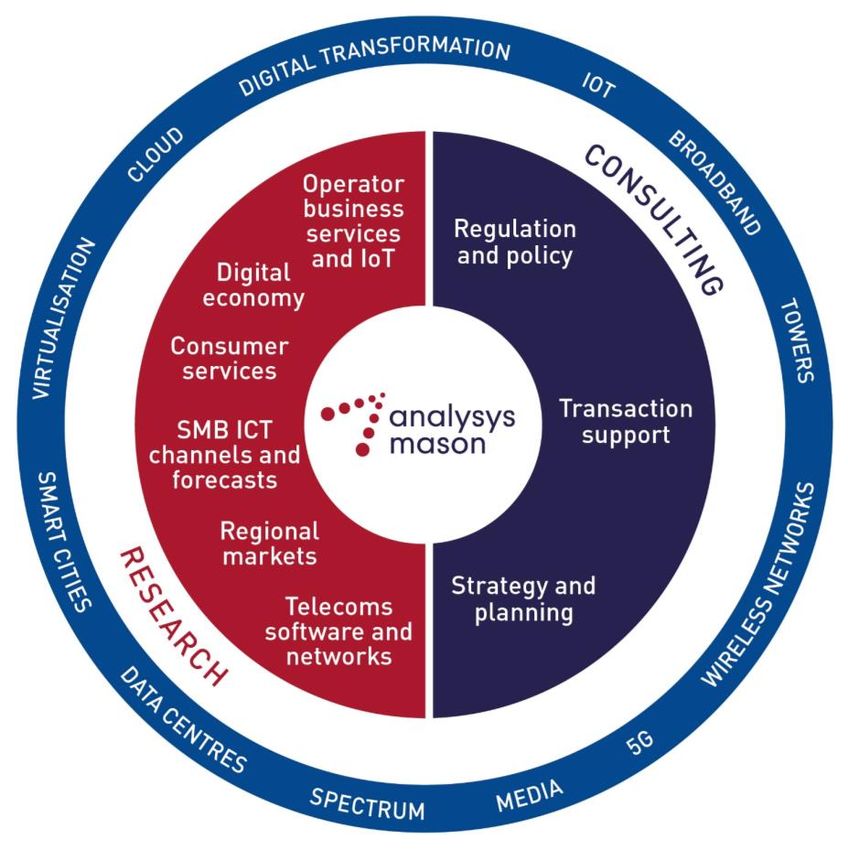
India telecoms market report 2020                                                2

               Contents             Market overview

                                    Operator profiles and market shares

                                    Infrastructure status and plans

                                    Regulatory information

                                    Recent and forthcoming market developments

                                    About the author and Analysys Mason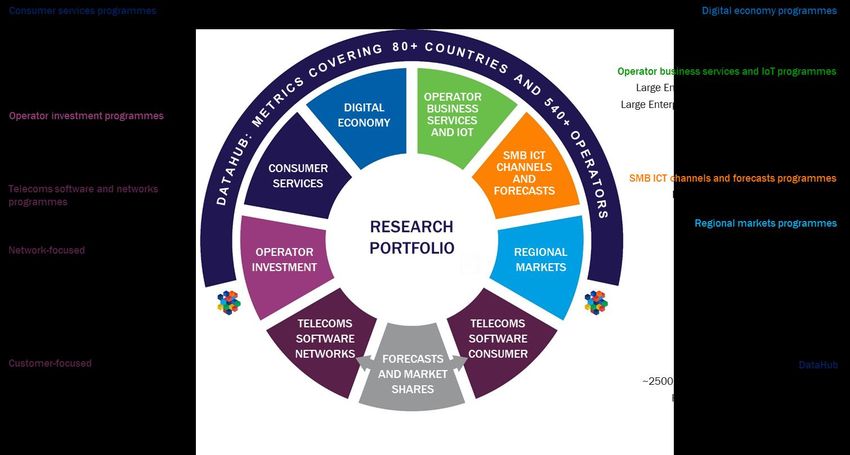
India telecoms market report 2020                                                                                                                                                3

Market overview: introduction to market

India is a large emerging economy undergoing rapid growth.                                        Figure 1: Telecoms KPIs, India (USD)
India is the world’s second most populous country, with 1.3 billion
people, and continues to rank among the world’s fastest growing                                                              Mobile 4Q 2019
economies. While significant expansion in GDP per capita has led
to formation of a burgeoning middle class, India remains
characterised by high levels of income-inequality. As such,
                                                                                                                                                                  $
services that have become near ubiquitous in other countries                                            1.12B           58.7%             81.8%                1.64
have remained unaffordable to large swathes of the population,                                           Mobile       4G % of mobile        Mobile
                                                                                                                                                             Mobile ARPU
                                                                                                      connections1     connections        penetration
and the country has historically lagged behind its neighbours in
terms of penetration of fixed and mobile services. In the mobile
segment, India has begun to close the gap – growth in                                                                         Fixed 4Q 2019
connections has been strong and penetration is rising rapidly. The
fixed market, meanwhile, has historically remained largely                                                                                                        $
undeveloped although this has begun to change.
                                                                                                       22.0M            7.27%              408K                6.99
Jio’s entry in the mobile market reshaped the segment; its fixed                                       Fixed voice    Fixed broadband                      Fixed broadband
                                                                                                                                        IPTV subscribers
broadband offer is set to have similarly transformative impact.                                        connections       penetration                             ASPU

Reliance Jio Infocomm’s entry into the mobile segment in 2016
remains the most significant recent development in the India’s                                                        Revenue, year ended 4Q 2019
telecom sector. The price war precipitated by the new entrant has
led to a sharp drop in revenues for established players, and                                                 $               $                                      $
triggered a series of mergers and acquisitions as operators                                             21.5B           4.78B             0.87%                1.61
sought to solidify their market position. The launch of Jio’s fixed
                                                                                                     Mobile service    Fixed service    Service revenue    Service revenue per
broadband service, JioFiber, is set to be similarly disruptive in the                                  revenue            revenue        as % of GDP        capita per month
fixed segment.

1   Except where stated, all mobile connection metrics in this report exclude machine-to-machine (M2M) connections.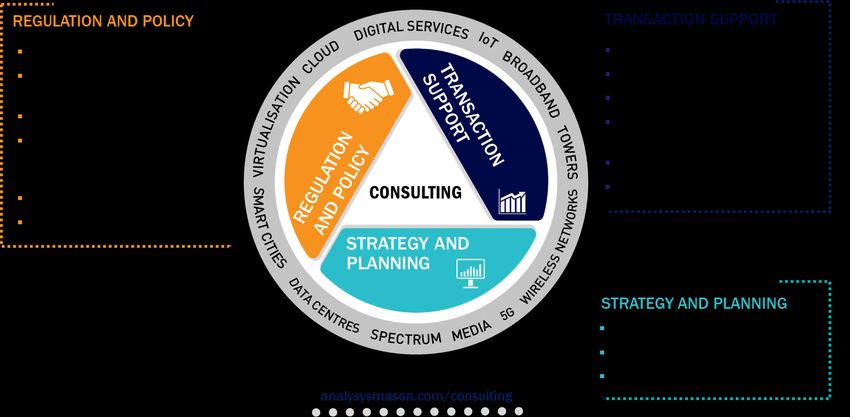
India telecoms market report 2020                                                                                                                         4

Market overview: key market trends for India

Figure 2: Total telecoms service revenue (INR billion)                               Figure 4: Telecoms service revenue per capita per month (INR)

                                                                           84.3                                                                   114.6
 84.4       83.2                           82.3     83.1      82.6                    111.9
                      82.6          81.8                                                                                      111.3    110.3
                                                                                              109.0                   108.5
                                                                                                      104.4   105.1
 367.7     358.4     341.4      346.1      361.0   372.8     370.3       387.3

1Q 2018 2Q 2018 3Q 2018 4Q 2018 1Q 2019 2Q 2019 3Q 2019 4Q 2019                      1Q 2018 2Q 2018 3Q 2018 4Q 2018 1Q 2019 2Q 2019 3Q 2019 4Q 2019

          Total mobile service revenue       Total fixed service revenue
                                                            Source: Analysys Mason                                                    Source: Analysys Mason

Figure 3: Total service revenue as a percentage of GDP                               Figure 5: Mobile as a percentage of total service revenue
 0.99%                                                                                                                                            82.1%
           0.94%                                                                                                              81.8%    81.8%
                                                                                      81.3%                           81.4%
                     0.88%                 0.88%   0.88%                                      81.2%
                                0.87%                                   0.87%                                 80.9%
                                                             0.86%
                                                                                                      80.5%

1Q 2018 2Q 2018 3Q 2018 4Q 2018 1Q 2019 2Q 2019 3Q 2019 4Q 2019                      1Q 2018 2Q 2018 3Q 2018 4Q 2018 1Q 2019 2Q 2019 3Q 2019 4Q 2019

                                                            Source: Analysys Mason                                                    Source: Analysys Mason
India telecoms market report 2020                                                                                                                               5

  Market overview: mobile market trends for India

  Figure 6: Mobile connections by device type (billion)                                   Figure 8: 4G and contract share of mobile connections

   1.11       1.12      1.12          1.15      1.16    1.12       1.12     1.14
                                                                                                                                                               58.7%

                                                                                        29.6%

                                                                                        6.5%                                                                    7.7%

 1Q 2018 2Q 2018 3Q 2018 4Q 2018 1Q 2019 2Q 2019 3Q 2019 4Q 2019                         1Q 2018 2Q 2018 3Q 2018 4Q 2018 1Q 2019 2Q 2019 3Q 2019 4Q 2019

        Smartphones       Basic phones          Mobile broadband     Mobile IoT                                     4G      Contract
                                                               Source: Analysys Mason                                                         Source: Analysys Mason

  Figure 7: Mobile ARPU by type (INR per month)                                           Figure 9: Cellular data traffic per connection (GB per month)
                                                                                                                                                           6.57
                                                                                                                                                5.98
                                                                                                                                       5.32
                                                                                575.3                                      4.64
                                                                                                                   4.23
473.4                                                                                                      3.77
                                                                                                   3.14
                                                                                           2.45

111.8                                                                           116.0
89.4                                                                             87.5

 1Q 2018 2Q 2018 3Q 2018 4Q 2018 1Q 2019 2Q 2019 3Q 2019 4Q 2019                          1Q 2018 2Q 2018 3Q 2018 4Q 2018 1Q 2019 2Q 2019 3Q 2019 4Q 2019

                         Blended             Prepaid      Contract
                                                               Source: Analysys Mason                                                         Source: Analysys Mason
India telecoms market report 2020                                                                                                            6

Market overview: mobile market

The merger of Vodafone and Idea Cellular concluded in 2018.             Mobile penetration has decreased slightly since 2018.
Vodafone and Idea Cellular completed a merger of their                  Mobile penetration peaked in 4Q 2018 at a rate of 83.6% before
operations in August 2018, creating India’s then-largest mobile         declining to 80.4% by 3Q 2019. This is largely due to the impact
operator under the name Vodafone Idea. However, despite its             of people picking up an additional SIM to take advantage of Jio’s
large volume of mobile subscribers, its market share has                competitive offer during 2017 and 2018, before discontinuing
continued to slip since the merger and it has been hit by severe        their previous SIM at a later point in time.
financial difficulties, exacerbated by the rapid churn of mobile
                                                                        ARPU is showing signs of stabilisation following the price war
customers towards Jio. In addition to mounting debt, a recent
                                                                        triggered by Jio’s entry.
ruling by the Supreme Court has left if with a large bill to pay (see
‘Recent and forthcoming market developments’ section for more           Mobile ARPU for the mobile segment as a whole reached an all-
information about this).                                                time low in 4Q 2018 of INR105 (USD1.46) before climbing back
                                                                        up to INR115 (USD1.60) in 3Q 2019. The price war responsible
Jio has taken the lead in the mobile segment.
                                                                        for decline has driven down average revenues to some of the
The competitive landscape in the mobile segment has shifted             lowest levels in the Asia-Pacific regions; operators competing
dramatically since Jio’s entry. Operators with less competitive         against Jio’s aggressive moves have thus faced a double impact
offers have faced rapidly declining market shares; others (such as      on their revenues: firstly, through the erosion of their ARPU, and
Reliance Communications and Tata Teleservices) have sold what           secondly through rapid churn of customers towards Jio.
remained of the mobile operations to other operators. Throughout
                                                                        Mobile operators have decried the high prices stipulated by the
it all, Jio’s share of subscribers has continued to climb at a steady
                                                                        regulator for 5G spectrum.
pace, increasing by an average of 2.5 percentage points each
quarter in 2018 and 2019. The most recent data released in              Airtel, Vodafone Idea and Jio have all spoken out against the
November 2019 shows that Jio overtook Vodafone Idea as India’s          excessive prices set by the regulator for 5G spectrum, ahead of
largest mobile operator in November, with over 370 million              an auction due to take place in 1H 2020. The operators have
subscribers.                                                            warned that high spectrum prices will handicap 5G development
                                                                        in the country. The government has so far refused to budge on
                                                                        the issue, stating prices will not be reduced.
India telecoms market report 2020 7
Market overview: fixed market trends for India
Figure 10: Household penetration by service Figure 12: Fixed broadband connections by technology (million)
55.0% 18.9 19.5 19.8
50.6% 18.4 18.3 18.4 18.3 18.5
9.1% 8.1%
6.9% 7.3%
1Q 2018 2Q 2018 3Q 2018 4Q 2018 1Q 2019 2Q 2019 3Q 2019 4Q 2019 1Q 2018 2Q 2018 3Q 2018 4Q 2018 1Q 2019 2Q 2019 3Q 2019 4Q 2019
Fixed voice Fixed broadband Pay TV DSL Cable modem FTTP/B BFWA Other
Source: Analysys Mason Source: Analysys Mason
Figure 11: Fixed retail revenue by service (INR billion) Figure 13: Pay-TV connections by technology (million)
148.0 146.7 150.0
83.1 82.0 81.5 80.7 81.3 82.1 81.6 83.4 135.6 136.5 136.2 136.0 131.9
1Q 2018 2Q 2018 3Q 2018 4Q 2018 1Q 2019 2Q 2019 3Q 2019 4Q 2019 1Q 2018 2Q 2018 3Q 2018 4Q 2018 1Q 2019 2Q 2019 3Q 2019 4Q 2019
Voice Broadband access Specialist business services CATV IPTV DTH Pay-DTT Operator OTT
Source: Analysys Mason Source: Analysys MasonIndia telecoms market report 2020 8
Market overview: fixed market
The fixed broadband market remains largely undeveloped. Jio’s entry into the fixed broadband seems poised to spark a
rapid expansion of fixed broadband penetration.
In contrast to the extremely rapid growth in the mobile segment,
the fixed broadband segment has failed to keep pace. Although Jio’s fibre broadband service launched commercially in 1600
connections have grown at a respectable (albeit rather towns and cities in September 2019, following a period of several
inconsistent) pace over the past decade, household penetration months during which users in selected areas could receive the
of fixed broadband remains among the lowest for the emerging service for free as part a ‘preview offer’. Its tariffs start at INR100
Asia-Pacific region. Several factors are especially important in (USD1.40) for a 100Mbit/s connection, with 250Mbit/s and
explaining this. 1Gbit/s services available with pricier tariffs. Much as with its
entry into the mobile market, Jio is pursuing a strategy of
Foremost among these is India’s high rural population, which
aggressive price competition, undercutting key rivals in the
stood at 66.0% of the total in 2018.1 This segment is typically
segment by a significant margin. We believe that Jio’s entry into
composed of people on lower end of the economic spectrum, the
the fixed broadband segment, along with ongoing economic and
vast majority of which work in India’s expansive agriculture sector.
demographic shifts, will spark a period of rapid expansion in the
The resulting combination of low population density and low
fixed broadband segment during the forthcoming years.
income has traditionally discouraged operators from making large
investments in expanding fixed infrastructure into more rural The state-sponsored Bharat Broadband Network continues to
areas. Fixed infrastructure has nevertheless expanded rapidly in expand despite delays.
recent years thanks to state-sponsored rollout programmes.
The government’s ambitious fixed infrastructure deployment
Deployment has accelerated further still since Jio’s entry in the
project, known as BharatNet, continues to make progress despite
fixed broadband segment in 2019.
significant delays. Reports released in January 2020 suggested
However, Jio’s highly competitive mobile tariffs may serve to that the project’s second phase was expected to have connected
dampen demand for fixed broadband due to the impact of mobile 150 000 ‘gram panchayats’ (which loosely translates as ‘villages’)
substitution. The growing prevalence of cheap mobile data by this point in time, but only 7.45% of this target had actually
coupled with ongoing declines in the price of handsets have made been achieved. The recently published state budget for 2020 has
fixed broadband services increasingly redundant to many users. disclosed an allocation of INR60 billion (USD836 million) to the
project.
1 Source: World BankIndia telecoms market report 2020 9
Contents Market overview
Operator profiles and market shares
Infrastructure status and plans
Regulatory information
Recent and forthcoming market developments
About the author and Analysys MasonIndia telecoms market report 2020 10
Operator profiles: products and services in India
Figure 14: Operators’ products and services
Operator Mobile Fixed broadband Fixed voice Pay TV
Yes – DSL (ADSL and VSDS2),
Bharti Airtel Yes Yes – PSTN and VoIP Yes – satellite and IPTV
FTTP and WiMAX
Vodafone Idea Yes No No No
Reliance Jio Infocomm Yes Yes – FTTH Yes – VoIP No
Bharat Sanchar Nigam Ltd Yes – DSL (ADSL, ADSL2+ and
Yes Yes – PSTN and VoIP Yes – IPTV
(BSNL) VDSL2), WiMAX and FTTP
Mahanagar Telephone Nigam Yes – DSL (ADSL, ADSL2+),
Yes Yes – PSTN and VoIP Yes – IPTV
Ltd (MTNL) WiMAX, WLL, FTTP
Yes – cable, DSL (ADSL), WLL,
Reliance Communications No Yes – PSTN and VoIP Yes – IPTV
and WiMAX
Yes – DSL (ADSL and ADSL2+),
Tata Teleservices No Yes – PSTN and VoIP Yes - IPTV
WiMAX, WLL, and FTTP
Atria Convergence
No Yes – FTTx No Yes – IPTV
Technologies
Hathway No Yes – cable, FTTP No Yes - CATVIndia telecoms market report 2020 11
Operator profiles: key mobile market trends for India
Figure 15: Mobile ARPU (INR per month) Figure 16: Market share of mobile Figure 17: Contract share of mobile
subscribers subscribers
6.9%
164.7 9.2%
16.8%
33.6%
138.5 7.7%
131.7 6.3% 7.3% 7.4%
127.7 6.9%
120.7 6.8%
119.8 6.4%
110.5 6.5%
20.4%
107.5 6.1%
102.9
94.0 5.4%
31.6%
4.5%
19.9% 4.2%
72.2 3.9%
54.7
2.8%
28.1%
27.4%
20.2
1Q 2018
2Q 2018
3Q 2018
4Q 2018
1Q 2019
2Q 2019
3Q 2019
4Q 2019
2Q 2018
1Q 2018
1Q 2018
3Q 2018
4Q 2018
1Q 2019
2Q 2019
3Q 2019
4Q 2019
2Q 2018
3Q 2018
4Q 2018
1Q 2019
2Q 2019
3Q 2019
4Q 2019
Source: Analysys Mason Source: Analysys Mason Source: Analysys Mason
Airtel Vodafone Reliance Vodafone Idea Tata BSNL Jio othersIndia telecoms market report 2020 12
Operator profiles: key fixed market trends for India
Figure 18: Market share of fixed broadband subscribers Figure 19: Fixed broadband ASPU (INR per month)
19.7%
26.6% 773.5
766.3
722.9
7.1% 708.4
694.0 641.7
4.3% 7.6% 641.6 635.3
635.3
5.4% 584.5
4.5% 571.8
4.5% 544.3
11.8%
12.3%
432.8
404.1 408.2
355.1
50.5%
43.9%
2Q 2019
1Q 2018
2Q 2018
3Q 2018
4Q 2018
1Q 2019
3Q 2019
4Q 2019
1Q 2018
2Q 2018
3Q 2018
4Q 2018
1Q 2019
2Q 2019
3Q 2019
4Q 2019
Source: Analysys Mason Source: Analysys Mason
BSNL Airtel MTNL Hathway Reliance Tata ACT othersIndia telecoms market report 2020 13
Operator profiles: Reliance Jio Infocomm
Jio is an integrated operator that has transformed the Figure 20: Reliance Jio Infocomm market share of subscribers
competitive landscape in the mobile segment. by service, 4Q 2019
Reliance Jio Infocomm’s entry into the market in 4Q 2016 has
profoundly impacted the overall market. Thanks to the financial
Mobile 33.6%
backing of parent company Reliance Industries Limited, it was
able to continue operating at a loss and offer its services free of
charge for six months following its entry in a bid to capture
customers. Having established a solid foothold in the mobile
segment, the operator is now turning its attention to fixed
Fixed broadband
broadband. Its fibre-to-the-home (FTTH) service launched
commercially in September 2019, and has followed a similar
strategy of aggressive price competition. Source: Analysys Mason
Jio became the mobile market leader in November 2019.
Jio entered the fixed segment in 3Q 2019.
Jio enjoyed a period of extremely rapid growth in the three years
following its entry into the mobile market. According to data Jio launched its fibre-to-the-home broadband service in
released by the telecoms regulator in November 2019, Jio had September 2019. Although details about take-up have yet to be
become the largest operator in terms of subscribers, with over published, its offering has been priced competitively relative to
370 million registered users (putting it narrowly ahead of previous existing offers, with broadband packages starting at INR100
market leader Vodafone Idea). It is also the world’s second-largest (USD1.46) for a 100Mbit/s connection, with 250Mbit/s and
single-country operator (behind China Mobile). It has added 1Gbit/s speeds also available with pricier tariffs. All tariffs come
74.4 million subscribers to its base in the first nine months of bundled with free voice calls anywhere in India, and 4K video
2019, generating a revenue of INR351 billion (USD4.9 billion) calling, as well as a set-top box via which users can access Jio’s
during the same period, and representing a 43.6% increase over OTT video apps and which will in time offer users the ability to
its revenue for 9M 2018. connect to third-party OTT video platforms as well. For more
information about Jio’s fibre offer, see the ‘Recent and
forthcoming market developments’ section.India telecoms market report 2020 14
Operator profiles: Airtel
Airtel is the market leader in the mobile segment and Figure 21: Airtel market share of subscribers by service, 4Q
commands a sizeable share of the fixed broadband market. 2019
Bharti Airtel was the second entrant into India’s mobile market,
launching a GSM service in 1995 in partnership with UK-based
Mobile 28.1%
BT Group. It went on to launch 3G services via a W-CDMA network
in 2011, and was the first operator in the country to offer LTE,
launching the service in 2012, following up with LTE-Advanced in
2016. The operator has also offered ADSL broadband access
since 2006 (prior to this, internet and data services had been
Fixed broadband 12.3%
available via sister company Bharti Infotel). VDSL was
subsequently introduced in 2010, followed by FTTP in 2014.
Airtel’s ownership is divided between Bharti Telecom (45%), Source: Analysys Mason
Pastel (15%), and Indian Continent Investment (7%), with the
remaining shares distributed among other stakeholders. It has initiated its equity sale to fund the payment of hefty bills
Jio’s impact on Airtel’s mobile operations remains ambiguous. owed to the government.
Last year’s version of this report suggested that Airtel’s mobile Airtel has gone ahead with the sale of INR144 billion
operations had thus far proved resilient to the stiff competition (USD2 billion) of equity to pay its large bill to the government
brought about by Jio’s entry. Although the picture is somewhat following the new AGR ruling by the Supreme Court (see ‘Recent
different 12 months later, it remains difficult to draw an and forthcoming market developments’ section for more details
unequivocal conclusion about Airtel’s performance in the mobile on the AGR ruling). It will also raise a further INR71.6 billion
segment. Despite seeing a decline of 24 million mobile (USD1 billion) as convertible bonds due in 2025. This comes
subscribers in the first nine months of 2019, it has managed to shortly after Bharti Airtel obtained INR250 billion (USD3.5 billion)
keep ARPU on an upward trend. Consequently, mobile service through a rights issue.
revenue for 9M 2019 was up by 6.3% on a year-on-year basis.India telecoms market report 2020 15
Operator profiles: Vodafone Idea
Vodafone Idea is the second-largest mobile operator, formed by Figure 22: Vodafone Idea market share of subscribers by
the merger of Vodafone and Idea Cellular. service, 4Q 2019
Vodafone India and Idea Cellular completed their merger in
August 2018, creating the then-largest mobile operator by
Mobile 31.6%
subscribers in the country. Vodafone entered the mobile market
in 2007 with its acquisition of Hutchison Essar, which had already
been offering mobile services in the country since 1995. The
newly acquired company initially operated under the name of
Vodafone Essar, later rebranding to Vodafone India after acquiring
Fixed broadband
additional shares from Essar Group. Meanwhile, Idea Cellular is
the product of a joint venture between AT&T Wireless, Aditya Birla
Group, and Tata Teleservices. Prior to the merger, both operators Source: Analysys Mason
launched 3G services in 2011, followed by 4G in 2015.
Vodafone Idea has publicly stated that it is considering exiting Its network integration project following the merger is nearing
the market due to facing severe financial problems. completion.
Despite initially getting to what appeared to be a promising start Vodafone Idea reported that it has completed the integration of
in the months following the merger, Vodafone Idea’s mobile its networks in 17 of India’s 22 circles as of January 2020. This
operations have suffered due to stiff competition from Jio’s has resulted in enhanced network coverage and capacity, with
mobile offering. Its ARPU has faced a steep decline and is now data capacity in particular now being twice as large as in
the lowest in the market. Compounding matters further, the September 2018. The operator has also removed surplus
operator is laden with debt, and has been hit harder than any equipment from 58 000 sites and discontinue a further 17 000
other operator by the recent ruling on AGR by the Supreme Court, low-utilisation sites. We note that Vodafone and Idea Cellular both
leaving it with an INR283 billion (USD3.9 billion) bill to pay at a sold their standalone tower businesses to American Tower
time when its revenue is already under pressure. Corporation prior to their merger in 2018.India telecoms market report 2020 16
Operator profiles: Bharat Sanchar Nigam Ltd
BSNL is the state-owned fixed incumbent and holds a small Figure 23: Bharat Sanchar Nigam Ltd market share of
share of the mobile segment. subscribers by service, 4Q 2019
The operator first entered the mobile segment with its launch of
GSM services in 2001. It went on to become the first operator to
Mobile 6.5%
launch 3G services in 2008 (along with sister company MTNL)
thanks to its privileged position as a state-owned enterprise. Its
fixed broadband operations, meanwhile, began in 2005 with the
launch of its ADSL service. It went on to launch to WiMAX in 2006,
following up with VDSL and FTTP in 2010. BSNL is entirely owned
Fixed broadband 43.9%
by the state.
It launched its first commercial 4G service in 2019.
Source: Analysys Mason
BSNL inaugurated its 4G service in 1H 2019, several years
behind its key rivals in the mobile segment. An official The government is considering a bailout to rescue BSNL and
announcement by the operator in May 2019 revealed that it had MTNL.
deployed 5340 4G towers. It has also stated its ambitions to start
preparing for the eventual launch of 5G technology, though no The Indian government has announced the possibility of bailout to
official timeline has been offered so far. the tune of INR740 billion (USD10.7 billion) to resuscitate the
struggling state-owned operators, BSNL and MTNL. The bailout
BSNL has slashed its postpaid tariffs in response to Jio’s entry. funds would include provisions for the allocation of 4G-suitable
spectrum as well as funds to be used to directly finance the
BSNL has reduced the price on several of its mobile plans to
deployment of 4G infrastructure.
counter the impact of the new entrant’s aggressive pricing
strategy. This has allowed it to hold onto its mobile subscribers.
Indeed, since 1Q 2018, BSNL has actually seen 3.7 million nets
adds to its mobile subscriber base.India telecoms market report 2020 17
Operator profiles: Atria Convergence
Operator profiles: Tata Teleservices
Technologies
Figure 24: Tata Teleservices market share of subscribers by Figure 25: Atria Convergence Technologies market share of
service, 4Q 2019 subscribers by service, 4Q 2019
Mobile Mobile
Fixed broadband 0.6% Fixed broadband 7.6%
Source: Analysys Mason Source: Analysys Mason
Tata Teleservices became a fixed voice-only operator following Atria Convergence Technologies (ATC) is a fixed service provider
the sale of it mobile arm to Bharti Airtel in 2019. operating in the south of the country.
Tata Teleservices Limited (TTSL) first entered the mobile segment ATC offers broadband and pay TV services in 12 cities in southern
in 2002 with its acquisition of Hughes Tele.com. In 2008, it began India via its FTTP network, originally launched in 2009. The
deploying a nationwide GSM network, which was subsequently operator’s ability to deliver fast speeds at competitive prices has
launched commercially in 2009, several months after the launch been a key driver of the rapid growth in its subscriber base in
of its first 3G service. Its struggling mobile operations were recent years, which expanded by a CAGR of 17.2% from 2015 to
acquired by Bharti Airtel in 2019. As a broadband operator, TTSL 2018. Atria Convergence Technologies is a wholly-owned
offers access via DSL and FTTP networks, each of which covers subsidiary of India Value Fund Advisors (IVFA).
19 of India’s 22 circles. TTSL is majority owned by Tata Group,
while NTT DOCOMO holds 26.5%.India telecoms market report 2020 18
Operator profiles: Mahanagar
Operator profiles: Hathway
Telephone Nigam Ltd
Figure 26: Hathway market share of subscribers by service, 4Q Figure 27: Mahanagar Telephone Nigam Ltd market share of
2019 subscribers by service, 4Q 2019
Mobile Mobile
Fixed broadband 4.5% Fixed broadband 4.5%
Source: Analysys Mason Source: Analysys Mason
Hathway is a cable operator offering fixed broadband and pay MTNL is the second state-owned operator and offers fixed and
TV. mobile services 1 in the two circles not covered by BSNL.
Hathway operates an expansive cable network which provides State-owned operator MTNL is the fixed service incumbent in
cable TV and broadband services in over 525 towns and cities Delhi and Mumbai. It offers mobile services via its 2G and 3G
across the country. Recently, it has focused its efforts on networks, launched in 2001 and 2009, respectively. It has also
improving network infrastructure, upgrading its HFC network with offered ADSL broadband since 2005, later supplemented with
DOCSIS 3.0 technology in 2013, and launching an FTTP network VDSL in 2009, and – most recently – FTTP in 2011. Although its
in 2016. Reliance Jio Infocomm completed its acquisition of a mobile operations have suffered since the entry of Jio, it
72% stake in Hathway in 2019; the remaining 28% is distributed continues to see a broadly robust performance in its fixed
among a number of different stakeholders, including Hathway broadband operations.
Investment (6%), Spur Cable and Datacom (2%), and Akshay and
Viren Rajan Rehaja, who each hold a 7% share in the company.
1 MTNL’s market share of mobile subscribers is included in the ‘other operators’ categoryIndia telecoms market report 2020 19
Operator profiles: other operators
Figure 28: other operators market share of subscribers by
service, 4Q 2019
Mobile 0.2%
Fixed broadband 26.6%
Source: Analysys Mason
The collective share of subscribers held by other operators has
dwindled for the mobile segment, but grown for the fixed
segment.
Small operators’ share of the mobile segment has suffered due to
Jio’s entry; their share has dwindled to a small fraction of what it
was. On the other hand, smaller operators’ collective share of
fixed broadband has increased 7.6 percentage points since 1Q
2018. It remains to be seen how they will adapt to the growing
challenge stemming from Jio’s fibre broadband offer launched in
September 2019.India telecoms market report 2020 20
Contents Market overview
Operator profiles and market shares
Infrastructure status and plans
Regulatory information
Recent and forthcoming market developments
About the author and Analysys MasonIndia telecoms market report 2020 21
Operators’ mobile infrastructure status in India
Figure 29: Operators’ mobile infrastructure status
Technology generations New technology launch
Operator Coverage Commentary
and frequencies deployed dates
2G 900MHz/1800MHz GSM: November 1994 2G: All 22 circles; over 95% of
GPRS: July 2004 population as of Jun-19
3G 2100MHz 3G: All 22 circles; over 95% of
Bharti Airtel EDGE: September 2005 ▪ Operates nearly 300 000 base stations (BTS).
population as of Jun-19
HSPA: January 2011 4G: All 22 circles; over 95% of
4G 1800MHz/2300MHz LTE (TDD): April 2012 population as of Jun-19
2G 900MHz/1800MHz GSM: November 1995
GPRS: February 2004 2G: All 22 circles as of Dec-16
3G 2100MHz 3G: All 22 circles as of Dec-16
Vodafone Idea EDGE: July 2004 ▪ Operates about 154 000 BTS’s.
4G: 17 of 22 circles as of Mar-
HSPA: March 2011 17
4G 1800MHz LTE: 2H 2015
2G N/A
4G: All 22 circles; 95%
Reliance Jio 3G N/A ▪ Coverage extends to 18 000 towns and cities and
LTE: September 2016 population coverage as of Jun-
Infocomm 200 000 villages
19
800MHz/1800MHz/2
4G
300MHz
2G 900MHz/1800MHz GSM: November 2001
GPRS: March 2004 2G: 20 circles – all excluding
3G 800MHz/2100MHz CDMA2000 1×RTT: March Delhi and Mumbai as of Jun-19
BSNL ▪ Operates about 110 000 BTS’s
2005 3G: 20 circles – all excluding
EDGE: May 2006 Delhi and Mumbai as of Jun-19
4G N/A
HSPA: February 2009India telecoms market report 2020 22
Operators’ fixed access infrastructure plans in India
Figure 30a: Operators’ fixed access infrastructure plans
Access infrastructure
Operator Roll-out target Progress: coverage and take-up
plans announced
Aiming to deploy fibre BSNL is assisting with the deployment of the state-sponsored BharatNet
BSNL FTTP infrastructure to 250 000 ‘gram programme, which aims to bring connectivity of at least 100Mbit/s to all 250 000
panchayats’ ‘gram panchayats’ in the country.
Launched FTTP services in Mumbai and New Delhi. Major fibre-based offerings
MTNL FTTP (GPON) N/D
include VoIP, IPTV and multi-play bundles.
Has about 175,000km of optic fibre cable (OFC) network Offers 4–100Mbit/s
broadband connections based on FTTP. However, as of March 2018 DSL
Airtel FTTP, VDSL vectoring N/D represented 94% of total fixed broadband customers.
Since October 2016 Airtel has offered vectored VDSL, branded as V-Fiber, with
speeds of up to 100Mbit/s.
Services are available in 143 cities as of September 2019, with further expansions
Reliance Jio Launched commercial FTTP of footprint in the pipeline.
FTTP
Infocomm service in Sep-19
Jio completed an acquisition of a 72% stake in Hathway cable in 2019.
Aiming to complete rollout
Atria Convergence Announced INR12 billion (USD185 million) to upgrade download speeds to 1Gbit/s
FTTP some time between 4Q 2018
Technologies in all 11 cities covered by its footprint.
and 2Q 2019India telecoms market report 2020 23
Contents Market overview
Operator profiles and market shares
Infrastructure status and plans
Regulatory information
Recent and forthcoming market developments
About the author and Analysys MasonIndia telecoms market report 2020 24
Regulatory information for India
Figure 31: Regulatory information
Issue Relevant regulatory action
A 5G spectrum auction is due to take place at some point during 1H 2020 (an exact date has yet to be confirmed). Operators have spoken
5G spectrum auctions out against what they perceive to be prohibitively high pricing for 5G spectrum, stating that 5G development would be severely
handicapped if these are not reduced before the auction goes ahead.
RAN sharing is allowed. Spectrum sharing has been recently approved by the government. Spectrum trading regulations have been
RAN sharing
finalised and approved by the Telecom Commission and are awaiting final notification.
Mobile number Mobile number portability (MNP) was launched across India in January 2011. Nationwide implementation of MNP was approved by the
portability government and was implemented in July 2015
LLU is not present in India, with BSNL reluctant to share its infrastructure. Competing altnets build their own infrastructure to offer fixed
Wholesale broadband
services.
Retail VoIP VoIP was legalised during the formulation of the National Telecom Policy (NTP) in 2012.
Functional and structural
N/A
separation
In February 2015, TRAI came out with final regulation on termination rates for the industry, wherein it slashed the mobile termination
Mobile termination
charge from INR0.20 to INR0.14 effective from March 1, 2015.
In mid-2013 TRAI reduced the national roaming price cap and allowed operators to offer national roaming packs that allow free incoming
Mobile roaming
calls while roaming. It also plans to do away with roaming charges altogether
There is no legislation on net neutrality as yet, rather it is practised selectively. Certain websites and blogs inciting religious disharmony
amongst others are blocked. Some operators have also throttled torrents in the past.
Net neutrality
In August 2014 the TRAI ruled that over-the-top (OTT) communication players and services will not be regulated and will not have to share
revenue with either the CSPs or the government, despite significant lobbying against this by the CSPs.India telecoms market report 2020 25
Contents Market overview
Operator profiles and market shares
Infrastructure status and plans
Regulatory information
Recent and forthcoming market developments
About the author and Analysys MasonIndia telecoms market report 2020 26
Contents Market overview
Operator profiles and market shares
Infrastructure status and plans
Regulatory information
Recent and forthcoming market developments
AGR ruling
Jio Fiber
About the author and Analysys MasonIndia telecoms market report 2020 27
AGR ruling: operators hit hard by Supreme Court’s dismissal of appeal against
increased license fees
A new system to calculate spectrum and license fees was approved by India’s Supreme Court in 2019, leaving operators with hef ty
bills.
The Supreme Court arrived at a verdict to use an expanded definition of adjusted gross revenue (AGR), used to determine the license and
spectrum fees due to be paid by mobile operators, ending a disagreement between mobile operators and the government that has spanned
for over a decade. Since the new methodology applies retroactively, operators are facing very steep bills to cover the revised license and
spectrum fees, plus additional penalties and interest, collectively amounting to INR1.3 trillion (USD18.2 billion).
▪ Vodafone Idea and Bharti Airtel have been hit hardest by the new ruling. Vodafone Idea owes INR283 billion (USD3.9 billion) while
Airtel owes INR216 billion (USD3.0 billion). Reliance Jio Infocomm has also been affected by the new ruling, though it owes less than
its rivals as a result of having entered the market later, as has Tata Teleservices, which sold its declining mobile services arm to Airtel
in 2019.
▪ Vodafone Idea and Bharti Airtel launched an appeal to be granted a reduction in the dues they owe in November 2019, as well as a
review of the decision to include non-core items in revenue calculations; the appeal was later rejected. However, they did receive a
concession to extend the deadline for payment of spectrum fees beyond the initial deadline of 23 January 2020.
▪ Payment of the bills will be all the more difficult due to the fierce price war that followed Jio’s entry in 2016, which severely eroded
mobile ARPU for incumbent operators. Vodafone Idea has publicly stated that unless some relief is offered by the government it will
have no choice but to shut down its operations in India; the operator is already laden with debt and has faced mounting losses in the
wake of rapid subscriber migration towards Jio.
▪ Bharti Airtel, Vodafone Idea and Tata Teleservices submitted part of the payment in February 2020: Airtel paid INR100 billion;
Vodafone Idea paid INR25 billion (with a further sum of INR10 which to be paid in the week that follows); and Tata Teleservices paid
INR22 billion, although the government maintains that it still owes an additional INR116 billion to clear penalty fees and outstanding
interest.India telecoms market report 2020 28
Contents Market overview
Operator profiles and market shares
Infrastructure status and plans
Regulatory information
Recent and forthcoming market developments
AGR ruling
Jio Fiber
About the author and Analysys MasonIndia telecoms market report 2020 29
Jio Fiber: the fixed broadband segment will be reshaped by the new entrant
Reliance Jio Infocomm launched its much anticipated Jio Fiber service in September 2019.
Following the unprecedented success that Jio’s mobile offering enjoyed since launching in 2016, the operator has now begun to turn its
attention towards the fixed broadband segment; it launched its broadband service commercially in September 2019. The service uses fibre-
to-the-home (FTTH) connectivity and offers download speeds of 100Mbit/s, 250Mbit/s and 1Gbit/s.
▪ The operator announced the launch of its fixed broadband service in August 2019. Prior to September, the service had been available
for free in select locations as part of a preview offer that lasted several months.
▪ The service is available from as little as INR100 (USD1.40) per month and offers a significant discount over key rivals in the fixed
broadband segment. All packages come with unlimited data (though throttling down to 1Mbit/s applies after a threshold level is
reached), as well as free voice calls, TV video calling, and low-latency connectivity for gaming. Premium packages with 1Gbit/s speeds
are pricier, starting at INR3999 (USD55.80) per month.
▪ Jio is also planning to leverage the success of its fibre service to establish a foothold in the OTT video segment. Customers of its Jio
Fiber service receive a free set-top box which users can use to enjoy free access to Jio’s own streaming platforms, such as JioTV and
JioCinema, as well as connect to third-party OTT platforms (though details of these have yet to be revealed).
▪ The service was available in 1600 towns and cities at launch; Jio has stated that it plans to cover all major towns and cities as it
moves forward with further expansions to its FTTH network.
We note that Jio’s mobile service enjoyed the fastest growth in the history of the telecoms industry, reaching 370 million subscribers in 3
years, and propelling it to the top of India’s mobile segment. we expect Jio’s entry into the fixed segment to have a similarly disruptive
impact. At present, India continues to lag far behind the regional average for fixed broadband penetration of households, with a penetration
rate of 6.8% in 2018 (compared to a regional average of 50.6%). As the world’s second most populous country, the low penetration of fixed
broadband services offers an abundance of untapped revenue potential. Jio’s fibre offer may prove to spark a concerted shift in operators’
focus towards this segment in a bid not lose out by moving too late.India telecoms market report 2020 30
Contents Market overview
Operator profiles and market shares
Infrastructure status and plans
Regulatory information
Recent and forthcoming market developments
About the author and Analysys MasonIndia telecoms market report 2020 31
About the author
Alex Boisot
NBED Name(Research
in Franklin
Analyst)
GothicisBook
a member
10pt bold
of the(NBED
regional
Title
markets
in Franklin
research
Gothicteam
Bookin10pt
London,
text)contributing
NBED Pasteprimarily
in biography
to thefrom
Telecoms
the website.
MarketIf
you need
Matrix andtoEuropean
update your
Country
bio, please
Reports
contact
research
OCS.programmes.
If your bio doesn’t
Alex holds
fit inathis
BA box,
in Philosophy,
remove thePolitics
less relevant
and Economics
portions.from the University of East
Anglia. He conducted research on the impact of telecommunications technologies on modern societies during his studies, writing his
dissertation on e-government and e-democracy.India telecoms market report 2020 32
Analysys Mason’s consulting and research are uniquely positioned
Analysys Mason’s consulting services and research portfolio Consulting
We deliver tangible benefits to clients across the telecoms
industry:
▪ communications and digital service providers, vendors,
financial and strategic investors, private equity and
infrastructure funds, governments, regulators, broadcasters
and service and content providers
Our sector specialists understand the distinct local challenges
facing clients, in addition to the wider effects of global forces.
We are future-focused and help clients understand the challenges
and opportunities new technology brings.
Research
Our dedicated team of analysts track and forecast the different
services accessed by consumers and enterprises.
We offer detailed insight into the software, infrastructure and
technology delivering those services.
Clients benefit from regular and timely intelligence, and direct
access to analysts.India telecoms market report 2020 33 Research from Analysys Mason
India telecoms market report 2020   34

Consulting from Analysys Mason
India telecoms market report 2020

                 PUBLISHED BY ANALYSYS MASON LIMITED IN APRIL 2020
                 Bush House • North West Wing • Aldwych • London • WC2B 4PJ • UK
                 Tel: +44 (0)20 7395 9000 • Email: research@analysysmason.com • www.analysysmason.com/research • Registered in England and Wales No. 5177472
                 © Analysys Mason Limited 2020. All rights reserved. No part of this publication may be reproduced, stored in a retrieval system or transmitted in any form or by any means – electronic,
                 mechanical, photocopying, recording or otherwise – without the prior written permission of the publisher.
                 Figures and projections contained in this report are based on publicly available information only and are produced by the Research Division of Analysys Mason Limited independently of any
                 client-specific work within Analysys Mason Limited. The opinions expressed are those of the stated authors only.
                 Analysys Mason Limited recognises that many terms appearing in this report are proprietary; all such trademarks are acknowledged and every effort has been made to indicate them by the
                 normal UK publishing practice of capitalisation. However, the presence of a term, in whatever form, does not affect its legal status as a trademark.
                 Analysys Mason Limited maintains that all reasonable care and skill have been used in the compilation of this publication. However, Analysys Mason Limited shall not be under any liability for
                 loss or damage (including consequential loss) whatsoever or howsoever arising as a result of the use of this publication by the customer, his servants, agents or any third party.
You can also read