Labor Market Institutions and the Incidence of Payroll Taxation - DISCUSSION PAPER SERIES
←
→
Page content transcription
If your browser does not render page correctly, please read the page content below
DISCUSSION PAPER SERIES

IZA DP No. 14321

Labor Market Institutions and
the Incidence of Payroll Taxation

Jinyoung Kim
Seonghoon Kim
Kanghyock Koh

APRIL 2021
DISCUSSION PAPER SERIES

IZA DP No. 14321

Labor Market Institutions and
the Incidence of Payroll Taxation

Jinyoung Kim
Korea University and IZA
Seonghoon Kim
Singapore Management University and IZA
Kanghyock Koh
Korea University

APRIL 2021

Any opinions expressed in this paper are those of the author(s) and not those of IZA. Research published in this series may
include views on policy, but IZA takes no institutional policy positions. The IZA research network is committed to the IZA
Guiding Principles of Research Integrity.
The IZA Institute of Labor Economics is an independent economic research institute that conducts research in labor economics
and offers evidence-based policy advice on labor market issues. Supported by the Deutsche Post Foundation, IZA runs the
world’s largest network of economists, whose research aims to provide answers to the global labor market challenges of our
time. Our key objective is to build bridges between academic research, policymakers and society.
IZA Discussion Papers often represent preliminary work and are circulated to encourage discussion. Citation of such a paper
should account for its provisional character. A revised version may be available directly from the author.

 ISSN: 2365-9793

 IZA – Institute of Labor Economics
Schaumburg-Lippe-Straße 5–9 Phone: +49-228-3894-0
53113 Bonn, Germany Email: publications@iza.org www.iza.org
IZA DP No. 14321 APRIL 2021

 ABSTRACT
 Labor Market Institutions and
 the Incidence of Payroll Taxation*
 Despite unambiguous predictions of the canonical model of a competitive labor market,
 empirical studies on the labor market effects of payroll taxation provide conflicting
 evidence. Our meta-analysis shows that varying degrees of labor market competitiveness
 across places and time could be one explanation for the mixed results. We then estimate the
 labor market impacts of payroll taxation in Singapore, the country with most competitive
 and flexible labor market among the countries investigated in the literature. By exploiting
 the sharp reduction in payroll tax rate when workers turn 60, we find that the payroll tax
 cut in Singapore has a large effect on wages without changes in employment. We provide
 novel evidence corroborating the canonical model prediction that the welfare costs of
 social insurance programs financed by payroll taxes can be minimized in a competitive
 labor market.

 JEL Classification: H24, I31, J22
 Keywords: payroll tax, labor market outcomes, incidence, regression
 discontinuity design, meta-analysis, labor market
 competitiveness

 Corresponding author:
 Jinyoung Kim
 Department of Economics
 Korea University
 145 Anam-ro
 Seongbuk-ku
 Seoul Korea
 E-mail: jinykim@korea.ac.kr

 * J. Kim is supported by a Korea University Grant (K2103911). S. Kim is supported by the Ministry of Education,
 Singapore, under its Academic Research Fund Tier 3 (MOE2019-T3-1-006 and MOE2013-T3-1-009). Koh is supported
 by the National Research Foundation of Korea (NRF-2020S1A5A8044427). We thank Wonjun Lyou for research
 assistance. All errors are our own.
1. Introduction
Most social insurance programs such as old-age pension and health, disability, and
unemployment insurance are financed by payroll taxes (or social security contributions). These
payroll taxes often account for more than 30% of workers’ labor income and about a quarter
of the total tax revenue of the OECD member countries (Saez et al., 2019). Although social
insurance programs play an important role in improving social welfare, the payroll taxes levied
to finance those programs can distort the labor market.
 In the canonical competitive labor market model, workers have an incentive to increase
(decrease) their labor supply depending on how they value their social insurance benefits when
the payroll tax rate increases (decreases). Thus, the employers’ additional labor costs due to
higher payroll taxes can be shifted to workers through reduced wage payments. If workers
value their social insurance benefits equal to the payroll taxes borne by their employers, the
incidence of payroll taxes will fall solely on the workers’ wages, leaving the employment or
work hours unchanged and thus minimizing the deadweight loss in labor market (Summers,
1989).
 Several empirical studies have tested Summers’ (1989) insights on the labor market
impacts of payroll taxes across various countries and time periods to document mixed results.
Table 1 presents the results of 22 studies on the wage effects of payroll taxation. The pass-
through rate, defined as the percentage change in wages upon a 1 percentage point change in
payroll tax rate, ranges from below 10% (Elias, 2015; Adam et al. 2019) to above 80% (Gruber,
1994, 1997; Anderson and Meyer, 2000; Komamura and Yamada, 2004; Baicker and Chandra,
2006; Kim and Koh, 2021). However, few studies have tried to explain this discrepancy.
 The canonical payroll tax incidence model assumes a perfectly competitive labor
market. However, the competitiveness in an actual labor market varies across countries,
demographic groups, and time periods. From our meta-analysis results shown in Tables 2 and
3, countries with a more flexible and competitive labor market exhibit a roughly 3.5 times
higher pass-through rate of payroll taxation (see Section 2 for details). These results imply that
heterogeneity in labor market competitiveness might be one reason for the inconsistent findings
on the labor market consequence of payroll taxes.
 To test the implications of our meta-analysis findings, we estimate the labor market
impact of a payroll tax rate cut in Singapore, which has a more competitive and flexible labor

 1
market than the other countries investigated in the literature. 1 According to the World
Economic Forum’s Global Competitiveness Report 2019 (Schwab, 2019), Singapore was
ranked first among 141 countries in labor market flexibility. Wage bargaining takes place
predominantly at the firm level in Singapore, where the rate of collective bargaining coverage
was only 19% in 2015. This is significantly lower than that in European countries such as
Finland (91% as of 2016), France (94% as of 2015), and Sweden (90% as of 2015). If our meta-
analysis finding is valid, then we are likely to find a high pass-through rate of payroll taxation
in Singapore.
 For the identification of the labor market effects of payroll taxes, we exploit the sharp
reduction in the payroll tax rate in Singapore when a worker turns 60. We apply a regression
discontinuity design (RDD) by comparing the labor market outcomes of workers immediately
before and after their 60th birthday. We find a discontinuous 3.3% increase in monthly labor
income, but not much discontinuity in labor inputs such as employment and full-time work
status at the cutoff age. These results indicate that almost all the labor costs saved through the
payroll tax cut are shifted to workers’ monthly wages. Thus, the welfare costs of a social
insurance program financed by payroll taxation would be minimal when the labor market is
highly competitive.
 This study is closely related to the literature estimating the labor market consequences
of payroll taxes. Several recent studies examining the labor market impacts of payroll taxation
mainly considered the European countries having high collective bargaining coverage rates.
For example, Saez et al. (2019) provide evidence of null wage impacts of a payroll tax cut in
Sweden, where the collective bargaining coverage rate was 90%, that is, higher than in most
other countries (ILO, 2020). They suggest that union bargaining might have prevented the
transfer of saved labor costs to the beneficiaries (i.e., young workers). Our study contributes to
the literature by providing novel evidence of labor market impacts of payroll taxation in the
contrasting context of highly competitive and flexible labor market.

1
 The majority of studies on labor market impacts of changes in payroll tax rates focused on European countries
such as Sweden (Bohm and Lind, 1993; Bennmarker, Mellander, and Ockert, 2009; Egebark and Kaunitz, 2013
and 2017; Bennmarker et al., 2013; Skedinger, 2017; Saez et al, 2019), France (Kramarz and Philippon, 2001;
Bozio, Breda, and Grenet, 2019; Cahuc, Carcillo and Le Barbanchon, 2019), Norway (Johansen and Klette, 1997;
Gavrilova et al., 2015), Finland (Korkeamäki and Uusitalo, 2009; Huttunenet al., 2013), Spain (Elias, 2015),
Greece (Saez, Matsaganis, Tsakloglou, 2012), and Germany (Müller and Neumann, 2017). Some studies have
investigated the labor market impacts of payroll taxations in Argentina (Cruces et al., 2010), Chile (Gruber, 1997),
Columbia (Adriana and Kugler, 2009), and the United States (Anderson and Meyer, 2000).

 2
Bozio et al. (2020) is the closest study to our work; it investigates the role of tax-benefit
linkage to explain variations in the pass-through rate of payroll taxes. This study is a rare
exception in that it attempts to explain the observed variations in estimated labor market
impacts of payroll taxation. The authors document that increased payroll taxes are fully shifted
to workers’ wages when a strong and salient relationship existed between social security
contribution and workers’ expected benefits. We complement their study by shedding lights on
the role of market competitiveness, another important institutional assumption used by
canonical competitive labor market models.
 The remainder of this paper is structured as follows. Section 2 discusses the meta-
analysis of existing studies considering the labor market impact of payroll taxation. Section 3
discusses the institutional background in Singapore. Section 4 presents the conceptual
framework we use to rationalize our empirical findings. Sections 5 and 6 describe the data and
empirical strategy, respectively. Section 7 reports the empirical results. Finally, Section 8
concludes the paper.

2. Meta-Analysis
Table 1 reports the estimated pass-through rates of payroll taxes to wages from 22 published
studies or working papers covering different countries and time periods. The pass-through rate
is equal to 1 when an increase in payroll tax on employers is completely shifted to workers,
and 0 when workers do not bear the burden of the increased payroll tax levied on the employer
at all.
 We first constructed this sample of studies using 16 papers surveyed in Bozio et al.
(2020) and reviewed all the papers referenced in each of these papers. We then carried out a
Google Scholar search to identify additional studies citing Bozio et al. (2020), the 16 papers,
and the papers referenced in them. Thus, we obtained 34 papers in total empirically studying
the incidence of payroll taxation. We then excluded 12 papers from the sample because we
could find no estimate of pass-through rate for them. Three papers in the sample reported more
than one pass-through rate estimate. Thus, we obtained 26 estimates in total.
 The pass-through rates varied widely across countries and time periods. For example,
Gruber and Krueger (1991), Gruber (1994), Gruber (1997), Anderson and Meyer (2000), and
Komamura and Yamada (2004) report a pass-through rate larger than 0.8. In contrast, relatively
recent studies such as Lehmann et al. (2013), Skedinger (2014), Elias (2015), Egebark and
Kaunitz (2018), Adam et al. (2019), and Saez et al. (2019) find the pass-through rate below 0.2.

 3
In particular, Bozio et al. (2020) show that the pass-through rates can range from 0.1 to 1.1
depending on the salience of tax-benefit linkage even within the same country, using three
distinct payroll tax reforms in France.
 The last three columns of Table 1 report the degree of labor market flexibility in the
wage determination process of the corresponding country of each study. We obtained this
information from the Institutional Characteristics of Trade Unions, Wage Setting, State
Intervention, and Social Pacts (ICTWSS) database (Visser, 2019). The variable in the fifth
column pertains to the predominant level at which wage bargaining takes place in a country
each year. It distinguishes five tiers, from 1 (wage bargaining takes place predominantly at the
local or company level) to 5 (bargaining takes place predominantly at the central or cross-
industry level).2 We presume a more competitive labor market when wage bargaining takes
place at the firm level, because the wage determination process is then more likely to be
flexible. 3 The variable in the sixth column indicates whether the country has a sectoral
organization for employment relations. The value 0 stands for weak or no institutions, 1 for
intermediate cases (only one side, with no joint institutions), and 2 for strong institutions (both
employers and unions, with some joint institutions). The variable in the last column is the
collective bargaining coverage rate; this is the population share of employees covered by valid
collective wage bargaining agreements. Wage determination can be more flexible if no strong
sectoral organization exists or fewer workers are covered under collective bargaining
agreements. The values reported in the last three columns of Table 1 give the average of these
variables over the years covered by the data considered in the respective studies.
 To formally test whether institutional characteristics of the labor market affect the
degree of payroll tax change transferred to wages, we conduct a subgroup meta-analysis on the
equality of the pass-through rates between the cases with more and less competitive labor
markets based on the three aforementioned measures in Table 1 (Card et al., 2018; Bozio et al.,
2020). Our subgroup meta-analysis excludes Gruber (1994) and Kugler and Kugler (2009)
because the former does not report the standard error of the estimated pass-through rate and

2
 See the variable description in Table 1 for the description of the five levels.
3
 Three elevating levels are considered in this variable: (i) local or company level, (ii) sector or industry level, and
(iii) central or cross-industry level. A level is “predominant” if it accounts for at least two-thirds of the total
bargaining coverage rate in a given year. If it accounts for less than two-thirds but more than one-third of the
coverage rate, a mixed or intermediate situation exists between levels (i) and (ii) or (ii) and (iii). A mixed situation
also occurs when the bargaining levels alternate and/or one cannot assess which of the two levels contributes more
to the actual coverage of agreements.

 4
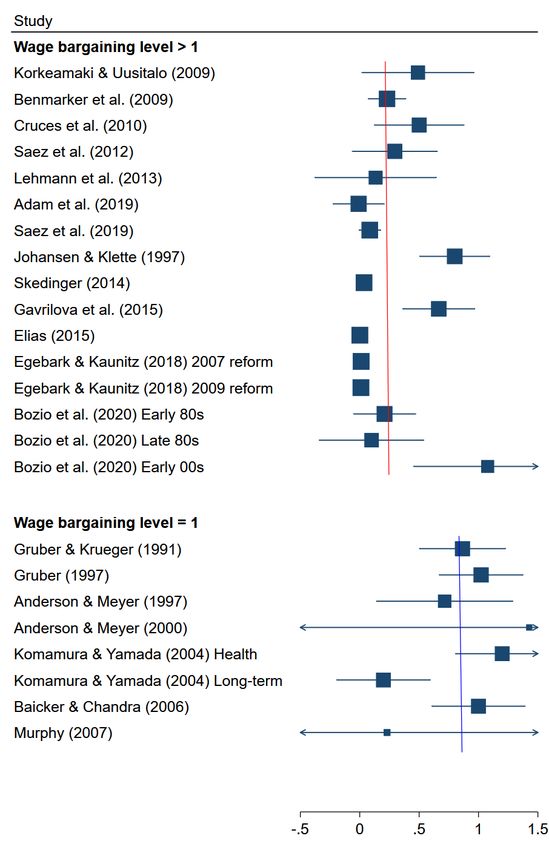
the latter has the missing labor market flexibility information for Colombia over the study
period from the ICTWSS database. Thus, we consider 24 estimates.
 Panel A of Table 2 reports the weighted average of the pass-through rate from the 24
estimates, with more precise estimates having larger weights. We use the random-effects meta-
analysis model to calculate the weights.4 The average pass-through rate is significantly positive
(0.406), and its 95% confidence interval is strictly above zero.
 Panel B shows the pass-through rate estimates by wage bargaining levels. The weighted
average pass-through rate is 0.838 for studies conducted in countries where wage bargaining
predominantly takes place at the local or firm level (8 observations), and 0.234 for studies
conducted in countries where wage bargaining generally takes place at a more aggregate level
(16 observations). The group mean difference is statistically significant, with the p-value less
than 0.001. This implies that the employer’s burden of payroll taxes is easily shifted to workers
when the wage is determined at a more flexible level, as predicted by the canonical competitive
labor market model.5 We find a similar finding in Panel C, where we report the average pass-
through rates for groups by sectoral organization. The payroll tax burden is more easily shifted
to workers when there is no or only weak institution of employment relations than when there
is a medium or strong sectoral organization.
 Since the collective bargaining coverage rate is a continuous variable, we employ the
meta-analysis regression method with random effects, which is a linear regression of the
estimated pass-through rates on study-level covariates (or moderators). Column (1) of Table 3
shows the regression result with collective bargaining coverage rate as a single moderator. We
find that the pass-through rate is significantly smaller with a higher coverage rate, and the
incidence of payroll taxes is therefore less likely to fall on workers’ wages in a country
determining wages in a more collective manner. This is in line with our earlier finding that the
employer’s burden of payroll taxes is easily shifted to workers when the labor market is more
flexible.
 The specification in column (2) additionally controls for the average GDP growth and
unemployment rate to capture the fluctuations in macroeconomic conditions over the study
years (Card et al., 2018). We also add controls for the observation units in the study (workers,

4
 A random-effects meta-analysis model assumes that variations in the pass-through rate across studies result from
both the between-study and sampling variability. In this model, the weight is inverse of the sum of the two variance
estimates.
5
 A graphical presentation of this subgroup meta-analysis, also known as forest plot, is shown in Appendix Figure
A1.

 5
firms, regions). None of these moderators show statistically significant association with the
pass-through rate, whereas the collective bargaining coverage rate shows robust effects.
 Our meta-analysis indicates that institutional characteristics of the labor market can
play a significant role in explaining the heterogeneity in tax incidence. Wages are more likely
to respond to payroll taxation when the labor market is more competitive and flexible.
 In the following sections, we test the implication of our meta-analysis by estimating the
labor market impact of payroll taxation in Singapore, where the labor market is highly
competitive.

3. Institutional Background
Singapore was ranked first in labor market flexibility out of 141 countries surveyed in the
Global Competitiveness Report 2019 (Schwab, 2019). The ICTWSS database indicates that
wage bargaining in Singapore was predominantly at the firm level during our sample period
(2015–2020). The database also reports that the collective bargaining coverage rate was only
19% in Singapore as of 2015; this is significantly lower than the rate of most countries
considered in the literature, such as Argentina (63% as of 2013), Greece (24%, 2015), Finland
(91%, 2016), France (94%, 2015), Norway (70%, 2016), Spain (70%, 2015), Sweden (90%,
2015), and the United Kingdom (28%, 2015). This implies that Singapore is a good setting to
examine whether the estimated pass-through rate is consistent with the prediction of the
canonical payroll tax incidence model in a competitive labor market.
 Singapore collects payroll taxes from employers and employees to fund its social
security savings program, called the Central Provident Fund (CPF). The CPF is a compulsory
savings program for local residents. It has features similar to a 401(k) retirement plan in the
United States. The CPF balance is used to finance four individual savings accounts with distinct
purposes: Medisave, Ordinary Account (OA), Special Account (SA), and Retirement Account
(RA). Medisave is a savings account for hospitalization and approved health insurance plans.
OA is a savings account whose balance can be withdrawn before age 55 to buy a house or pay
for children’s tuition fees. SA is a savings account for investment in government-approved
financial products. RA is opened on the account holder’s 55th birthday. The savings in OA and
SA are transferred to RA to form a retirement fund; this can be withdrawn through monthly
payouts after the official claiming age (currently 65).6 Both employers and workers contribute

6
 The payroll taxes collected for a worker's CPF are allocated across Medisave, OA, and SA at predetermined
shares, which vary with his/her age. In general, more savings are allotted to Medisave when the worker is old, and

 6
to the CPF, but self-employed individuals are only required to contribute to the Medisave
component. Appendix Table A1 shows the detailed CPF allocation schedule by age.
 Appendix Table A2 summarizes how the payroll tax rate (i.e., the CPF contribution rate)
varies with the workers’ age. The tax rate is 26% of the monthly wages of workers aged 55 and
above but below 60 (13% on employers and 13% on employees). For those aged 60 and above
but below 65, the payroll tax rate is 16.5% of monthly wages (9% on employers and 7.5% on
employees).7 Monthly income up to S$ 6,000 is taxable for payroll tax purposes in Singapore.
Our main analysis exploits the discontinuous change in payroll tax rate upon turning 60 in order
to identify the labor market incidence of payroll taxation in Singapore.
 Table A2 shows that the payroll tax rates sharply reduce at age 55 and 65. However,
there are simultaneous policy changes at these two age cutoffs. Singaporeans become eligible
to withdraw their CPF balances upon turning 55 and can claim their pension benefits upon
turning 65. Since these institutional settings deter us from cleanly identifying the causal effects
of payroll taxation, our main analysis does not investigate the labor market impacts at these
age cutoffs.8

4. Simple Theoretical Framework
In this section, we present a simple model that can predict the labor market impacts of payroll
taxation, accounting for the institutional characteristics of Singapore’s labor market and age-
specific payroll tax rate schedule. We build the model on the standard labor market framework
studying the effects of payroll taxes and mandated benefits (Summers, 1989).
 Let denote the payroll tax rate levied on employers hiring workers aged , and
denote the payroll tax rate levied on employees aged . For example, 9 = . 3, 0 = . 9,
 9 = . 3, and 0 = . 75 in Singapore during our sample period.
 Consider the labor market for workers aged 59 years. The market equilibrium for these
workers is point A in Figure 1, where the labor demand and supply curves are denoted by 9

and 9 , respectively.

to SA when the worker is young. For workers aged between 60 and 65 years, 63.6%, 21.2%, and 15.2% of their
total payroll taxes are allocated to the Medisave account, OA, and SA, respectively. For workers aged 35 and
below, 22%, 16%, and 62% of their payroll tax payments are allocated to the Medisave account, OA, and SA,
respectively.
7
 The government has increased the payroll tax rates several times over the past decades to ensure enough
retirement savings, but no change was made during our study period, 2015–2020.
8
 For more discussions on the theoretical predictions of CPF contribution rate changes upon turning 55 and 65 and
corresponding empirical evidence, see Appendix B.

 7
If workers aged 59 and 60 are homogenous, the demand curve for 60-year-old workers
( 0 ) will be located above 9 , where the gap between the two demand curves is 9 − 0 ;
 denotes the wages paid to homogeneous workers. The gap occurs because firms incur extra
costs for hiring 59-year-old workers who come with a higher payroll tax rate.
 As the payroll taxes levied on employers go to the workers’ individual CPF savings
accounts, the supply curve for workers aged 60 ( 0 ) will be located above 9 . If workers
consider the reduction in employers’ CPF contribution as a loss in compensation (which we
call condition I), the gap between the two supply curves will be 9 − 0 .
 Another change occurring at age 60 pertains to the reduced contributions of workers to
their own CPF accounts; the reduction amounts to 9 − 0 . If a worker matches this
reduction with an increase in private saving by 9 − 0 and thus leaves the total savings
intact (condition II), the payroll tax cut for employee contribution at age 60 will not shift the
labor supply curve from that at age 59.
 In sum, both the demand and supply curves for workers aged 60 will shift by the same
proportion from the curves for workers aged 59 if conditions I and II are met. The market
equilibrium for workers aged 60 will then be at point B of Figure 1. The wage rate for 60-year-
old workers will be higher than that for 59-year-old workers, but the employment for both age
groups will be identical. These predictions are tested in our empirical analysis.

5. Data
For our empirical analysis, we use data from the Singapore Life Panel (SLP), a nationally
representative longitudinal survey of local residents in Singapore aged between 50 and 70 in
2015, when it was launched. The SLP surveys about 7,000–9,000 individuals each month,
mainly through the Internet, collecting rich individual- and household-level information on, for
example, labor market outcomes, health, and demographic characteristics. We consider 61
monthly waves of the SLP from July 2015 through July 2020.
 Our primary dependent variables are the binary indicators of employment and full-time
work status, and net monthly labor income. The SLP does not ask respondents their specific
work hours. Instead, it surveys whether the respondents work 35 hours a week or longer or less,
or whether their work hours vary. We consider an individual working for more than 35 hours
as a full-time worker. Net monthly labor income is defined as the monthly income before taxes
and other deductions conditional on employment and after employer payroll tax contribution.

 8
Singapore’s payroll tax rate schedule depends on the individual’s age. For an age-based
RDD, we consider age in months.9 As control variables, we include years of schooling, with
the dummy variables indicating ethnicity (Chinese, Indian, or Malay), marital status, and
gender.
 Our baseline analysis sample is restricted to Singaporeans with paid jobs, because only
they are subject to payroll taxation. As the SLP also collects information on labor market
outcomes from self-employed workers and foreigners who are not subject to payroll taxation,
we use these individuals to estimate the discontinuities in labor market outcomes at age 60 as
a falsification check.
 Table A3 provides the summary statistics of labor market outcomes and demographics
of individuals aged 59 or 60, excluding foreign or self-employed workers.10 Workers aged 59
years earn higher monthly wages, are more likely to be employed, and are more likely to be
full-time workers than those aged 60, although their demographic characteristics measured by
years of education, gender, ethnicity, and marital status are generally similar.

6. Empirical Strategy
To identify the labor market impacts of payroll taxation in Singapore, we exploit the sharp
reduction in payroll tax rate of a worker turning 60. We compare the labor market outcomes of
workers just before and just after they turn 60 by applying an RDD. To estimate the
discontinuity in labor market outcomes at the age cutoff (i.e., the 60th birthday month), we use
the following regression specification:
 = + · [ > ]+ + , (1)
where is a labor market outcome variable such as monthly wage and its logarithm value
and binary indicators of employment and full-time status (conditional on being employed) for
individual i at age in month a; denotes a worker’s age in months normalized to zero at
the month individual i turns 60; 1[ageia > 0] is equal to 1 if individual i is 60 years of age or
older and 0 otherwise;11 ⋅ is a smooth function of individual i’s age in months, controlling
for the age profiles of labor market outcomes; and is an error term. The parameter of

9
 We can also use age in days, but this could create too noisy patterns of outcome variables. Therefore, as the
running variable, we use age in months instead of days.
10
 We restrict the age of sample respondents to 59 and 60 for consistency with the sample used for empirical
analysis.
11
 We do not include the observations in the month of the 60th birthday because some respondents surveyed in
that month may not be eligible for the tax rate cut yet.

 9
interest is , representing the discontinuous changes in labor market outcomes at the cutoff age.
For statistical inference, we calculate the standard errors clustered at the age-in-month level
and corrected for heteroskedasticity.
 The key identification assumption for interpreting the estimated discontinuities in labor
market outcomes as the causal effects of payroll tax cuts is that all factors except payroll tax
rate change continuously. As an indirect test of this assumption, we examine whether the
observable characteristics of workers change smoothly at the cutoff age. Appendix Table A4
shows that the estimated discontinuities are small in magnitude and statistically insignificant,
except for the share of Chinese ethnicity, which is estimated at 0.005, but statistically
significant at the 5 % level. However, we argue that this discontinuity will not cause a serious
bias in our estimation. First, the estimate is small compared to the average share of Chinese
ethnicity in our sample, which is 86% (see Table A3). Second, some birth cohorts will always
be younger or older than 60 years during the sample period, and their ethnic group
compositions may be different from those of other birth cohorts.12 As a robustness check, we
estimate equation (1) after controlling for these individual characteristics and examine whether
the statistically significant discontinuous change in share of ethnic Chinese is orthogonal to the
discontinuities in labor market outcomes.13
 To minimize the bias in estimating s, given the bandwidth, we need to choose a correct
parametric approximation of unknown labor market age profiles, ⋅ . We restrict the age of
the sample respondents in the baseline specification to 59 and 60 (i.e., 12-month bandwidth
before and after the 60th birthday month). By assuming a reasonably narrow bandwidth, we
approximate the labor market age profiles with a linear function of age in months and the slope
differing on each side of the cutoff. As this baseline bandwidth is chosen arbitrarily, we
alternatively consider the data-driven optimal bandwidths computed for each dependent
variable adopting the method of Calonico et al. (2014). As an additional robustness check, we
use a more flexible parametric approximation of ⋅ by adding quadratic terms of age in
months and its interaction with 1[ageia > 0].

12
 To test this conjecture, we restrict the sample to those born between 1956 and 1959 so that our sample
constitutes individuals observed both before and after the cutoff age. Consistent with our conjecture, the estimated
discontinuity of the Chinese ethnicity share becomes smaller in magnitude and statistically insignificant.
13
 Another identification assumption is that individuals cannot manipulate the running variable. This assumption
must hold in our case because a biological age is impossible to change by nature.

 10
7. Results
Baseline analysis: Labor market impacts of payroll tax rate cut at age 60
Figure 2 shows the age profiles of labor market outcomes of individuals aged between 59 and
60; each dot represents the average value of each age in months along the lines, fitting those
dots on each side of the cutoff age. All labor market outcomes decrease with age, reflecting the
fact that our sample individuals have already passed their peak working age. Panels A and B
show discontinuous increases in monthly wage and its logarithm values upon turning 60.
However, Panels C and D do not demonstrate discontinuous changes in the probability of
employment and full-time work status (conditional on employment) in the month of the 60th
birthday. These results provide graphical evidence that the reduction in payroll tax rate
increased the older individuals’ wages without changes in their labor inputs.
 Table 4 reports the estimated discontinuities of labor market outcomes in the month of
the 60th birthday, using equation (1). Columns (1) and (2) show the estimated discontinuities
in monthly wage and its logarithm values at the cutoff age as S$ 130.9 (or US $97.3) and 3.3%,
respectively. 14 These estimates are statistically significant at the 1% and 5% levels,
respectively. The 3.3% increase in monthly wages is equivalent to an 82.5% reduction in
employer contribution upon the worker turning 60 (reduction from 13% to 9% in monthly
earnings). Columns (3) and (4) provide little evidence on discontinuous changes in probability
of employment and full-time work status. The estimates are small in magnitude and statistically
insignificant.
 In sum, the incidence of payroll taxes largely falls on workers’ wages, leaving their
employment intact. Several recent studies considering the labor market impacts of payroll
taxation mainly focused on the European countries having high collective bargaining coverage
rates. For example, Saez et al. (2019) document the null wage impacts of a payroll tax cut in
Sweden, where the collective bargaining coverage rate is higher than in most other countries
(ILO, 2020). The findings of these studies, which are consistent with our meta-analysis findings,
imply that the efficiency loss of payroll taxation can be small in highly competitive labor
markets.

Robustness checks

14
 The exchange rate of S$ 1 is US$ 0.74 as of March 25, 2021.

 11
We report our robustness check results in Table 5. First, some birth cohorts can always be
below or above 60 years of age in our sample period. Different cohorts might have experienced
different life-cycle profiles of labor market outcomes. If some of our sample individuals have
not crossed the cutoff age of 60, the difference in sample composition in terms of birth years
can lead to a bias in fitting the age profiles of labor market outcomes. To address this issue, we
restrict the sample to individuals born between 1956 and 1959 so that our sample includes
individuals observed both before and after the cutoff age. The estimated discontinuities shown
in Panel A are similar to the baseline estimates in Table 4. The estimates for monthly wage and
its logarithm values are statistically significant at the 1% and 5% levels, respectively.
 Second, if the estimated discontinuities reported in Table 4 are due to the payroll tax
rate cut, they would be insensitive to the inclusion of control variables. Consistent with the
findings reported in Appendix Table A4, the estimates in Panel A of Table 5 remain robust
when we include covariates such as years of education, gender, ethnicity, marital status, and
an interaction term between gender and marital status.15
 Third, we examine the baseline estimates’ sensitivity to the choice of age bandwidth.
Instead of the 12-month bandwidth used in baseline analysis, we consider the data-driven
optimal bandwidth computed using Calonico et al.’s (2014) methodology, assuming that our
running variable, age in months, is continuous. Panel C of Table 5 reports that the alternative
bandwidths are wider than our baseline 12-month bandwidth, but the estimated discontinuities
remain similar to those in Table 4.
 Finally, we investigate whether the estimated labor market outcome discontinuities at
age 60 remain robust when we approximate ⋅ with higher-order polynomials of age in
months. We use the quadratic function of age in months and its interaction with 1[agei > 0] to
fit the age profiles of labor market outcomes. As the optimal bandwidth choice can be affected
by the functional form of ⋅ , we re-calculate the data-driven bandwidths following Calonico
et al.’s (2014) method. The results shown in Panel D of Table 5 indicate that the estimated
discontinuities, with the higher-order polynomials of age in months, are similar to those of the
baseline specification in Table 4.

Falsification checks

15
 From Table A4, the change in Chinese ethnicity share at the age cutoff is statistically significant at the 5% level,
whereas its magnitude (0.005) is small. To further examine whether this leads to bias in estimates, we include
only the dummy variable for Chinese ethnicity and re-estimate equation (1). The results remain robust.

 12
In our baseline analysis, we excluded foreigners and self-employed Singaporeans because
social security contribution is mandated only for the local residents engaged in paid work.16 If
the estimated discontinuities in labor market outcomes at age 60 are due to payroll tax cut, we
do not expect such discontinuities for foreigners or self-employed Singaporeans. Table 6 shows
that the estimated discontinuities of labor market outcomes at age 60 are statistically
insignificant.
 For an additional falsification check of the estimated discontinuities at a hypothetical
age cutoff range, we assign each of the 48 months before and after the actual cutoff (the month
of the 60th birthday) as a placebo age cutoff. We then estimate the discontinuity of labor market
outcomes at each of those 96 cutoffs with a 12-bandwidth. Figure 3 plots the distribution of the
96 estimates, with the baseline estimates in Table 4 shown as the vertical lines. The
probabilities of the placebo estimates being larger in magnitude than the baseline estimate for
monthly wages and log monthly wages are 8.3% and 3.1%, respectively, while the
corresponding probabilities for employment status and full-time work status are both 19.8%.
These results imply that the estimated discontinuities at placebo age cutoffs are less likely to
replicate the baseline estimates.

8. Conclusion
Despite clear predictions under the canonical model of a competitive labor market, existing
empirical studies have provided mixed evidence on how much a payroll tax change is shifted
to workers’ wages. One possible explanation for this discrepancy is the heterogeneity in labor
market flexibility across countries and time. For example, Saez et al. (2019) argues that union
bargaining might have prevented the increased labor costs from being shifted to the
beneficiaries. For a better understanding of the role of market flexibility or competitiveness,
we investigate the labor market impact of payroll taxation in Singapore, where the labor market
is more competitive and flexible than in any other country investigated in the literature. We
document that a payroll tax cut largely shifts to the workers’ wages. The estimated pass-through
rate in Singapore is 82.5%; this is similar to the weighted average pass-through rate of the
studied countries, where wage bargaining predominantly takes place at the local or firm level,
as in Singapore. These findings indicate that labor market institutions such as market

16
 Self-employed individuals are required to contribute only to the individual medical savings account called
Medisave. Their Medisave contribution rates (5.25% to 10% depending on income) do not change once they reach
50.

 13
competitiveness play a significant role in determining the labor market impacts of payroll
taxation. A policy implication is that the labor market distortions due to payroll taxation would
be minimal when the labor markets are competitive.
 Finally, a few caveats are in order. First, due to the data limitation, we cannot
distinguish whether the estimated wages increase on turning 60 is achieved when employees
change jobs or by a salary adjustment within the same employment. An increase in wages at
age 60 may come from job mobility. However, from our informal communication with an HR
personnel staff of a multinational company operating in Singapore, the salaries of workers are
adjusted upward when they turn 60. Second, as we rely on survey data, we do not have enough
statistical power to conduct heterogeneity analysis across industries or between public and
private companies to further investigate the role of labor market competitiveness. 17 We leave
these unanswered questions to future work.

17
 We estimate the labor market impacts of payroll tax cuts at age 60 for workers in the public sector, where the
labor markets can be less competitive than in other sectors. We find little evidence of discontinuous increases in
monthly wages or their logarithm value at the age cutoff. However, the number of observations used for this
analysis is only 577. The results should therefore be interpreted with caution.

 14
References

Adam, S., Phillips, D. and Roantree, B., 2019. “35 years of reforms: A panel analysis of the
 incidence of, and employee and employer responses to, social security contributions in
 the UK.” Journal of Public Economics, 171, pp.29-50.
Kugler, Adriana, and Maurice Kugler. 2009. "Labor market effects of payroll taxes in
 developing countries: Evidence from Colombia." Economic development and cultural
 change, 57 (2): 335-358.
Anderson, P.M. and Meyer, B.D., 2000. “The effects of the unemployment insurance payroll
 tax on wages, employment, claims and denials.” Journal of Public Economics, 78(1-2),
 pp.81-106.
Baicker, K. and Chandra, A., 2006. The labor market effects of rising health insurance
 premiums. Journal of Labor Economics, 24(3), pp.609-634.
Bennmarker, H., Mellander, E. and Öckert, B., 2009. “Do regional payroll tax reductions
 boost employment?” Labour Economics, 16(5), pp.480-489.
Bohm, P. and Lind, H., 1993. “Policy evaluation quality: A quasi-experimental study of
 regional employment subsidies in Sweden.” Regional Science and Urban Economics,
 23(1), pp.51-65.
Bozio, A., Breda, T., and Grenet, J., 2019. Does Tax-Benefit Linkage Matter for the
 Incidence of Social Security Contributions? IZA Discussion Paper No. 12502.
Cahuc, P., Carcillo, S. and Le Barbanchon, T., 2019. “The effectiveness of hiring
 credits.” The Review of Economic Studies, 86(2), pp.593-626.
Calonico, S., Cattaneo, M.D., and Titiunik, R., 2014. “Robust nonparametric confidence
 intervals for regression‐discontinuity designs.” Econometrica, 82(6), pp.2295–2326.
Card, David, Jochen Kluve, and Andrea Weber, 2018. “What works? A meta-analysis of
 recent active labor market program evaluations.” Journal of the European Economic
 Association, 16 (3), pps. 894-931.
Cruces, Guillermo, Sebastian Galiani, and Susana Kidyba. 2010. "Payroll taxes, wages and
 employment: Identification through policy changes." Labour economics, 17(4): 743-749.
Elias, Ferran. 2015. “Labor demand elasticities over the life cycle: Evidence from Spain's
 payroll tax reforms.” Working Paper.
Egebark, J. and Kaunitz, N., 2018. “Payroll taxes and youth labor demand.” Labour
 economics, 55, pp.163-177.

 15
Gavrilova, E., Zoutman, F., Hopland, A. O., & Møen, J. (2015, August). “Who pays for the
 payroll tax? quasi-experimental evidence on the incidence of the payroll tax.” Working
 Paper.
Gruber, J., 1994. “The incidence of mandated maternity benefits.” The American economic
 review, pp.622-641.
Gruber, Jonathan. 1997. “The incidence of payroll taxation: Evidence from Chile.” Journal of
 Labor Economics, 15(3), pp. 72-101, July.
Gruber, J. and Krueger, A.B., 1991. “The incidence of mandated employer-provided
 insurance: Lessons from workers' compensation insurance.” Tax policy and the
 economy, 5, pp.111-143.
Huttunen, Kristiina, Jukka Pirttila, and Roope Uusitalo. 2013. “The Employment Effects of
 Low-Wage Subsidies.” Journal of Public Economics, 97, pp. 49-60
International Labour Organization (ILO) (2020). ILOSTAT database. Available from
 https://ilostat.ilo.org/topics/collective-bargaining/.
Johansen, F. and Klette, T.J., 1997. Wage and Employment Effects of Payroll Taxes and
 Investment Subsidies (No. 194). Discussion Papers.
Komamura, K. and Yamada, A., 2004. “Who bears the burden of social insurance? Evidence
 from Japanese health and long-term care insurance data.” Journal of the Japanese and
 International Economies, 18(4), pp.565-581.
Kim, Seonghoon, and Kanghyock Koh. 2020. “Does early access to pension wealth improve
 health?” Economic Inquiry, 58(4), pp. 1783-1794.
Kim, Seonghoon and Kanghyock Koh. 2021. The Effects of the Affordable Care Act
 Dependent Mandate on Parents’ Labor Market Outcomes, Working Paper.
Korkeamäki, O. and Uusitalo, R., 2009. “Employment and wage effects of a payroll-tax
 cut—evidence from a regional experiment.” International Tax and Public Finance,
 16(6), pp.753-772.
Kramarz, F. and Philippon, T., 2001. “The impact of differential payroll tax subsidies on
 minimum wage employment.” Journal of Public Economics, 82(1), pp.115-146.
Kugler, A. and Kugler, M., 2009. “Labor market effects of payroll taxes in developing
 countries: Evidence from Colombia.” Economic Development and Cultural Change,
 57(2), pp.335-358.
Lehmann, E., Marical, F. and Rioux, L., 2013. “Labor income responds differently to
 income-tax and payroll-tax reforms.” Journal of Public Economics, 99, pp.66-84.

 16
Müller, K.U. and Neumann, M., 2017. “Who bears the burden of social security contributions
 in Germany? Evidence from 35 years of administrative data.” De Economist, 165(2),
 pp.165-179.
Saez, E., M. Matsaganis, and P. Tsakloglou. 2012. “Earnings determination and taxes:
Evidence from a cohort-based payroll tax reform in Greece.” Quarterly Journal of
 Economics, 127 (1), 493-533.
Saez, E., Schoefer, B. and Seim, D., 2019. “Payroll taxes, firm behavior, and rent sharing:
 Evidence from a young workers' tax cut in Sweden.” American Economic Review,
 109(5), pp.1717-1763.
Skedinger, P., 2014. “Effects of payroll tax cuts for young workers.” Working Paper.
Summers, Lawrence H. 1989. “Some simple economics of mandated benefits.” The American
 Economic Review Papers and Proceedings, 79(2), pp. 177-183.
Schwab, K. 2019. Global Competitiveness Report 2019. World Economic Forum.
Visser, Jelle 2019. ICTWSS Database, version 6.1. Amsterdam Institute for Advanced
 Labour Studies AIAS.

 17
Figures and Tables
 Figure 1. Labor Market Equilibrium

 Figure 2. Age Profiles of Labor Market Outcomes

 A. Monthly wages (S$) B. Log(monthly wages)

 C. Pr(employed) D. Pr(weekly working hours>35)

Data source: The Singapore Life Panel.
Note: We exclude self-employed individuals and foreign citizens from the sample. Each dot represents the average
value at each age in months.

 18
Figure 3. Distributions of Discontinuities of Labor Market Outcomes at Placebo Age Cutoffs
 A. Monthly wages B. Log(monthly wages)

 P(Fake estimate>Baseline estimate): 0.083 P(Fake estimate>Baseline estimate): 0.031

 C. Pr(employed) D. Pr(weekly working hours>35)

 P(Fake estimate>Baseline estimate): 0.198 P(Fake estimate>Baseline estimate): 0.198

Data source: The Singapore Life Panel.
Note: The red vertical line indicates the baseline RDD estimate.

 19
Table 1. Summary of Empirical Studies of Payroll Tax Incidence

 Authors (pub. year) Country Years of Pass-through rate Wage Sectoral Collective
 of study study (std. err.) bargaining organizat bargaining
 level ion coverage
 rate
 Gruber and Krueger (1991) U.S. 1979 − 81, 0.865 (0.184) [Table 5, col. 1 0 22.36
 87, 88 7]
 Gruber (1994)1 U.S. 1977, 78 1.56 [Table 5, col. (iii)] 1 0 25.45
 Gruber (1997) Chile 1984, 85 1.022 (0.180) [Table 3, col. 1 0 10
 1]
 Anderson and Meyer (1997) U.S. 1978 − 84 0.715 (0.292) [Table 3, col. 1 0 23.82
 1]
 Johansen and Klette (1997) Norway 1983 − 93 0.80 (0.15) [Table 6, col. 2] 4.55 2 75.00
 Anderson and Meyer (2000) U.S. 1985 1.427 (1.191) [Table 3, col. 1 0 19.87
 1]
 Komamura & Yamada Japan 1995 − 2001 1.20 (0.2) [Table 1, FE 1 0 22.20
 (2004) (i) Health insurance model]
 Komamura & Yamada Japan 2000 − 01 0.20 (0.2) [Table 2, FE 1 0 21.10
 (2004) (ii) Long-term model]
 care insurance
 Baicker and Chandra (2006) U.S. 1996 − 2002 1.00 (0.20) [Table 4, col. 1] 1 0 14.65
 Murphy (2007) U.S. 1992 − 2002 0.23 (1.01) [Table 6, panel 1 0 15.41
 A, col. 3]
 Kugler and Kugler (2009)2 Colombia 1994 − 1996 0.2346 (0.0883) [Table 3, . . .
 col. 1]
 Korkeamaki and Uusitalo Finland 2003 0.49 (0.24) [Table 7, col. 2] 4 2 86.20
 (2009)
 Benmarker et al. (2009) Sweden 2002 − 04 0.23 (0.08) [Table 4, col. 3] 3 2 94.00
 Cruces et al. (2010) Argentina 1995 − 2001 0.501 (0.192) [Table 4, col. 2 2 72.90
 2]
 Saez et al. (2012) Greece 2004 − 09 0.295 (0.182) [Table 5, col. 4 0 100.00
 1]
 Lehmann et al. (2013) France 2003 − 06 0.134 (0.260) [Table 2, col. 3 1 98.00
 3]
 Skedinger (2014) Sweden 2007, 08 0.036 (0.027) [Table 2, col. 3 2 90.25
 5]
 Gavrilova et al. (2015) Norway 1996 − 2012 0.666 (0.154) [Table 2, col. 3.47 2 73.80
 1]
 Elias (2015) Spain 1997, 98 0.0009 (0.0059) [Table 4, 3 2 83.18
 col. 6]
 Egebark and Kaunitz (2018) Sweden 2007 0.012 (0.002) [Table 6, col. 3 2 90.50
 (i) 2007 reform 2]
 Egebark and Kaunitz (2018) Sweden 2009 0.010 (0.003) [Table 6, col. 3 2 90.00
 (ii) 2009 reform 3]
 Adam et al. (2019) U.K. 1982 − 2015 -0.009 (0.109) [Table 3, col. 1.5 0.05 38.90
 6]
 Saez et al. (2019) Sweden 2009 − 13 0.085 (0.046) [Table 1, 3 2 89.40
 panel A]
 Bozio et al. (2020) Early France 1988 0.209 (0.133) [Table 3, col. 3 1 94.58
 1980s 4]
 Bozio et al. (2020) Late France 0.100 (0.224) [Table 3, col. 3 1 96.00
 1996
 1980s 3]
 Bozio et al. (2020) Early France 1.077 (0.318) [Table 3, col. 3 1 95.00
 2007
 2000s 2]
Notes: 1. Gruber (1994) does not report the standard error for the estimated pass-through rate. 2. The ICTWSS
database does not provide information for Columbia over period 1994–96.
Variable description: (1) Wage bargaining level: predominant level at which wage bargaining takes place (in
terms of coverage of employees). A level is “predominant” if it accounts for at least two-thirds of the total
bargaining coverage rate in a given year. If it accounts for less, but for more than one-third of the coverage rate,
a mixed or intermediate situation occurs between the two levels. A mixed situation also occurs when bargaining

 20
levels alternate and/or one cannot assess which of the two contributes more to the actual coverage of
agreements. There are five categories:
5 = bargaining predominantly takes place at the central or cross-industry level negotiated at lower levels
4 = intermediate or alternating between central and industry bargaining
3 = bargaining predominantly takes place at the sector or industry level
2 = intermediate or alternating between sector and company bargaining
1 = bargaining predominantly takes place at the local or company level
(2) Sectoral organization: sectoral organization of employment relations. There are 3 categories:
2 = strong institutions (both employers and unions, some joint institutions)
1 = medium (only one side, no joint institutions)
0 = weak, or none
(3) Collective bargaining coverage rate: employees covered by valid collective (wage) bargaining agreements as
a proportion of all wage and salary earners in employment with the right to bargaining, expressed as a
percentage (0–100), adjusted for the possibility that some sectors or occupations are excluded from the right to
bargain.

 21
Table 2. Meta-Analysis of Pass-through Rate by Groups of Wage Determination Flexibility Group Number of Weighted 95% confidence interval p-value for studies Average homogenei ty A. Overall 24 0.406 (0.239, 0.574) 0.000 B. By Wage bargaining levels Wage bargaining predominantly takes 16 0.234 (0.096, 0.372) 0.000 place beyond the company level (> 1) Wage bargaining predominantly takes 8 0.838 (0.560, 1.117) 0.030 place at the local or company level (= 1) [Test of group mean differences] 2 (d.f.) = 14.54 (1), p-value < 0.001 C. By Sectoral organization Medium or strong sectoral organization 15 0.234 (0.087, 0.380) 0.000 of employment relations (> 0) No or weak sectoral organization of 9 0.757 (0.477, 1.037) 0.003 employment relations (= 0) [Test of group mean differences] 2 (d.f.) = 10.51 (1), p-value = 0.001 Table 3. Meta-Analysis Regression Baseline Additional regressors Dep. Var: Pass-through rate (1) (2) Collective bargaining coverage rate -.00762*** -.00591*** (-3.49) (-2.59) Cyclical environment GDP growth rate .0294 (.820) Unemployment rate -.0145 (-.770) Unit of observation (omitted = workers) Firm observations .232 (1.48) Regional observations .405 (1.06) Constant .911*** .762*** 5.51 (2.99) Obs. 24 24 R-sq 0.430 0.478 Notes: t-values are in parentheses. *** significant at 1%; ** significant at 5%; * significant at 10%. Data on annual GDP growth rates were extracted on Apr. 5, 2021, from the World Bank national accounts data and the OECD National Accounts data files. Data on unemployment rates were extracted on Apr. 5, 2021, from the OECD data, except for Chile, Colombia, Argentina, Norway, and the United Kingdom; the data of these countries are from the IMF. 22
Table 4. Discontinuity in Labor Market Outcomes Upon Turning 60

Dependent variables: Monthly wages Log(monthly Pr(employed) Pr(Weekly
 wages) working hours>35)
 (1) (2) (3) (4)

1[Age>60th Birthday] 130.9*** 0.033** 0.006 0.006
 (37.16) (0.014) (0.004) (0.005)

 Observations 31,108 30,974 48,415 48,415
 R-squared 0.001 0.001 0.001 0.001
Data source: The Singapore Life Panel.
Notes: We exclude self-employed individuals and foreign citizens from the sample. We do not include any control
variables. Standard errors in parentheses are clustered at the age level and corrected for heteroskedasticity. ***
p60th Birthday] 113.625*** 0.029** 0.005 0.005
 (37.811) (0.013) (0.004) (0.005)

Observations 31,108 30,974 48,415 48,415
R-squared 0.205 0.286 0.052 0.070

C. Using data-driven optimal bandwidth (linear specification for age profile)
1[Age>60th Birthday] 143.1*** 0.033** 0.005* 0.002
 (40.75) (0.012) (0.003) (0.004)

Observations 36,270 38,719 68,727 68,727
R-squared 0.001 0.001 0.002 0.001
Bandwidth 14 15 17 17

D. Adding quadratic specification
1[Age>60th Birthday] 176.7*** 0.034** 0.003 0.005
 (48.56) (0.015) (0.005) (0.007)

 Observations 62,406 62,147 60,583 68,727
 R-squared 0.002 0.002 0.001 0.001
 Bandwidth 24 24 15 17
Data source: The Singapore Life Panel.
Notes: We exclude self-employed individuals and foreign citizens from the sample. In Panel A, we include only
individuals born between 1956 and 1959. We do not include any control variables. In Panel B, we include dummy
variables of primary education, secondary education, gender, ethnicity (Chinese, Indian, and Malay), marital
status, number of children, and the interaction term between gender and marital status. Standard errors in
parentheses are clustered at the age level and corrected for heteroskedasticity. *** p
Table 6. Discontinuity in Labor Market Outcomes among Foreigners
 or Self-employed Singaporeans

Dependent variables: Monthly wages Log(monthly Pr(employed) Pr(Weekly
 wages) working hours>35)
 (1) (2) (3) (4)

1[Age>60th Birthday] 144.5 0.028 -0.003 -0.002
 (116.6) (0.018) (0.003) (0.002)

 Observations 4,788 4,778 5,504 5,504
 R-squared 0.000 0.000 0.000 0.000
Data source: The Singapore Life Panel.
Notes: We include self-employed individuals and foreign citizens from the sample. We do not include any control
variables. Standard errors in parentheses are clustered at the age level and corrected for heteroskedasticity. ***
p
Appendix

A. Appendix Figure and Table

 Figure A1. Pass-through Rate by Wage Bargaining Levels

Note: Vertical lines show the weighted average in each group.

 25
Table A1. Allocation of CPF Contributions by Account and Age

 Allocation Rates from Jan 1, 2016
 (for monthly wages ≥ $750)

 Employee's age Ordinary Account Special Account Medisave Account
 Total
 (years) (% of wage) (% of wage) (% of wage)

 35 and below 23 6 8 37

 Above 35 to 45 21 7 9 37

 Above 45 to 50 19 8 10 37

 Above 50 to 55 15 11.5 10.5 37

 Above 55 to 60 12 3.5 10.5 26

 Above 60 to 65 3.5 2.5 10.5 16.5

 Above 65 1 1 10.5 12.5
Source: CPF Board (2016).

 Table A2. CPF Contribution Rates by Age

 Contribution Rates from Jan 1, 2016
 (for monthly wages ≥ $750)

 Employee's age By Employer By Employee Total
 (years) (% of wage) (% of wage) (% of wage)

 55 and below 17 20 37

 Above 55 to 60 13 13 26

 Above 60 to 65 9 7.5 16.5

 Above 65 7.5 5 12.5
 Source: Singapore Central Provident Fund Board (2016).

 26
Table A3. Summary Statistics

 Age 59 Age 60
 Labor market outcomes
 Monthly wages (S$) S$3982 S$3849
 Pr(employed) .65 .63
 Pr(full-time) .49 .47
 Demographics
 Years of education 12.2 12.1
 Share of male .45 .45
 Share of Chinese .86 .86
 Share of Indian .05 .05
 Share of Malay .07 .07
 Pr(married) .81 .80
Data source: The Singapore Life Panel.

 Table A4. Discontinuities in Demographic Characteristics Upon Turning 60
 Years of Male Chinese Indian Malay Married
 education
 (1) (2) (3) (4) (5) (6)

1[Age>60th Birthday] 0.036 0.003 0.005** -0.002 -0.003 0.000
 (0.025) (0.003) (0.002) (0.002) (0.002) (0.003)

Observations 48,415 48,415 48,415 48,415 48,415 48,415
R-squared 0.001 0.000 0.000 0.000 0.000 0.000
Data source: The Singapore Life Panel.
Notes: Standard errors in parentheses are clustered at the age level and corrected for heteroskedasticity. *** p65th birthday] -7.97 -0.017 -0.020*** -0.015***
 (46.56) (0.014) (0.005) (0.005)

 Observations 17,624 17,515 37,084 37,084
 R-squared 0.001 0.002 0.005 0.004
Data source: The Singapore Life Panel.
Notes: We exclude self-employed individuals and foreign citizens from the sample. We do not include any control
variables. Standard errors in parentheses are clustered at the age level and corrected for heteroskedasticity. ***
p
You can also read