CONNECTICUT VOICES FOR CHILDREN: STATE OF WORKING CONNECTICUT
←
→
Page content transcription
If your browser does not render page correctly, please read the page content below
CONNECTICUT VOICES FOR CHILDREN: State of Working Connecticut | 1

CONTENTS
        GLOSSARY OF KEY TERMS....................................................................................................... 3

        INTRODUCTION....................................................................................................................... 4

        Connecticut’s Shrunken Economic Output..................................................................... 5

        Connecticut’s Inequitable Economic Distribution....................................................... 18

        Supporting Connecticut’s Economy and Families........................................................ 28

        Conclusion......................................................................................................................... 35

        Acknowledgements.......................................................................................................... 36

        References........................................................................................................................ 37

CONNECTICUT VOICES FOR CHILDREN: State of Working Connecticut, 2021 | 2
GLOSSARY OF KEY TERMS
Budget refers to the combination of tax policy and spending policy.

Economic output growth is commonly measured as the percentage change in real (inflation-adjusted)
gross domestic product (GDP), which is the value of the final goods and services produced in a nation or
state over a given period of time.

Employer power comes in two primary forms. Monopoly power is when an employer faces little competition
from other employers in selling goods and services and so is able to set a higher price than would otherwise
be possible in a competitive market. Monopsony power is when an employer faces little competition from
other employers in hiring workers and so is able to set wages at a lower level than would otherwise be
possible in a competitive labor market. However, even without monopsony power, employers generally
have more power than workers in setting wages.

Income is the flow of money that a person or family receives over a given period of time, and it is derived
from an array of sources, including salaries and wages, business income, rental income, investment income
(interest, dividends, etc.), and government transfers.

Labor productivity is a measure that compares the amount of goods and services that a worker produces
to the amount of time that it takes to produce those goods and services.

Racial income gap is the difference in income among populations grouped by race or ethnicity. It is
commonly measured using the median income.

Racial unemployment rate gap is the difference in the unemployment rate among populations grouped
by race or ethnicity.

Racial wage gap is the difference in the wage for a population grouped by race or ethnicity. It is commonly
measured using the median wage.

Racial wealth gap is the difference in wealth for a population grouped by race or ethnicity. It is commonly
measured using the median net worth.

Unemployment rate is the share of workers in the labor force who do not currently have a job but are
actively looking for work. This measure therefore excludes people who have left the labor force due to
retirement, disability, family care obligations, etc.

Wage is a payment made by an employer to an employee for work and is the largest source of income for
most workers.

Wealth is the total stock of assets, including money, property, stocks, bonds, and other kinds of capital.

Worker power arises primarily from firms being run in the interests of workers as stakeholders, from
workers being represented by a union, and from an economy at full employment, meaning there are jobs
available for everyone who wants one and workers have outside options if their current job is unsuitable.
All of these factors strengthen the ability of workers to increase their pay to a higher level than would
otherwise be possible.

                                          CONNECTICUT VOICES FOR CHILDREN: State of Working Connecticut, 2021 | 3
INTRODUCTION
                 Connecticut’s economy has serious problems. From the Great Recession through the
                 coronavirus pandemic-induced recession—a period that included the longest economic
                 expansion on record—Connecticut ranked 49th out of 50 in state-level growth in economic
                 output, and in fact the state’s economic output decreased overall. Over the same period, the
                 distribution of wages in Connecticut’s economy remained highly inequitable, exceeding
                 even the high level in the U.S. as a whole. This combination of a shrunken economy with
                 a highly inequitable distribution has weakened both the state’s fiscal standing and the
                 standard of living for most families.

                 The purpose of this report, which proceeds in three sections, is to highlight the depth and
                 scope of state’s economic problems and to provide policy options to address those problems.

                 The first section provides an overview of Connecticut’s economic output. The key takeaway
                 is that Connecticut’s economic output would be more than 25 percent larger today if it had
                 simply grown at the same rate as the U.S. as a whole since 2007. This substantial gap in
                 economic output growth deprives the state of billions of dollars a year that it could use to pay
                 down long-term obligations and provide support for working- and middle-class families.
                 Also troubling, Connecticut’s shrunken economy has underperformed the U.S. economy
                 due to a combination of slower job growth in all major sectors and slower productivity
                 growth, and the state’s economy is still on track to grow slower than the U.S. economy, all
                 of which means this is an extensive, ongoing problem.1

                 The second section provides an overview of Connecticut’s economic distribution. The key
                 takeaway is that wage inequality has been rising for several decades and is even greater in
                 Connecticut than the U.S. as a whole. For example, if wages for all workers had grown at
                 the same rate since 1979 as for workers at the top, the typical overall worker in Connecticut
                 would have made $29.52 an hour in 2020 rather than $24.65, an increase of $4.87 an hour
                 (or $10,130 a year). Even worse, some groups of workers are harmed by the combination
                 of rising wage inequality and substantial wage gaps due to systemic racism and other forms
                 of discrimination in the labor market. For example, if there was no racial wage gap and
                 if wages for all workers had grown at the same rate as for workers at the top, the typical
                 Hispanic worker in Connecticut would have made $29.52 an hour rather than $17.36, an
                 increase of $12.16 an hour (or $25,293 a year).2

                 The third section provides policy options for using Connecticut’s budget to address the
                 state’s economic problems. The key takeaway is that tax and spending policies that support
                 working- and middle-class families, especially families of color, also provide the greatest
                 support for the economy. It is therefore possible for the state to boost economic growth
                 by reforming and/or increasing its budget in ways that support the most disadvantaged
                 families. Put simply, Connecticut’s economic pie has shrunk over the last decade and the
                 wealthy are taking an unfair, ever larger share. However, Connecticut could make simple
                 changes to its budget that would provide a fairer share for the state’s working- and middle-
                 class families, especially families of color, which in turn would increase the overall size of
                 the economic pie and benefit all of the state’s families.

CONNECTICUT VOICES FOR CHILDREN: State of Working Connecticut, 2021 | 4
Connecticut’s Shrunken Economic Output
Growth in economic output is important because it increases the tax base and thereby strengthens a state’s
ability both to pay down long-term obligations (i.e., debt and unfunded pension liabilities) and to maintain
and/or increase support for working- and middle-class families. This section of the report provides an
overview of Connecticut’s economic output and it proceeds in three parts: The first part provides an
overview of job growth, one of two main components of economic output growth. The second part provides
an overview of labor productivity growth, the other main component of economic output growth. The third
part provides an overview of economic output growth.

The following is a summary of the key findings:

Job growth. Connecticut spent most of the three decades before the coronavirus pandemic-induced recession
of 2020 slowly recovering jobs lost in three prior recessions rather than increase the overall number of jobs.
The result is an overall job growth gap of more than 36 percentage points compared to the U.S. as a whole,
and the state’s weak job growth applies to every major sector of the job market. Further, like the three prior
recessions, the recession of 2020 generated a deeper job loss in Connecticut than the U.S. as a whole; and
like the past three recoveries, the current recovery in Connecticut will likely take several years and likely
significantly lag the pace for the U.S. as a whole.

Labor productivity growth. Connecticut has experienced an even greater slowdown in labor productivity
growth than the recent historic slowdown in the U.S. as a whole.

Economic output growth. Connecticut’s economic output contracted by 7.6 percent from 2007 through
2020 when adjusting for inflation, whereas economic output in the U.S. grew by 17.9 percent. The result is
an overall economic output growth gap of more than 25 percentage points, and the state’s weak economic
output growth applies to nearly every major sector of the economy.

Altogether, the analysis shows that since the Great Recession, Connecticut’s economy has shrunk overall
and underperformed the U.S. in economic output growth in nearly every major economic sector due to
a combination of slower job growth in all major sectors of the job market and slower labor productivity
growth. Moreover, based on the current slower pace of job growth in Connecticut, the state’s economy is
on track to grow slower than the U.S. economy during the recovery from the recent recession.

                                          CONNECTICUT VOICES FOR CHILDREN: State of Working Connecticut, 2021 | 5
Job Growth
Unlike the U.S. as a whole, Connecticut never fully recovered all of the jobs lost in the Great Recession
of 2007–09 (which officially spanned from December 2007 to June 2009). Using the U.S. as a baseline,
Figure 1 shows that nonfarm employment stood at 138.4 million in December 2007 and bottomed out at
129.7 million in February 2010, a total loss of 8.7 million jobs, or a 6.3 percent reduction. It then took until
May 2014 for nonfarm employment to exceed the December 2007 level, a length of more than six years,
making it a slow recovery from a historical perspective.3

Shifting to Connecticut, Figure 2 shows that nonfarm employment stood at 1.713 million in December 2007
and bottomed out at 1.601 million in January 2010, a total loss of 111,500 jobs, or a 6.5 percent reduction,
which was deeper than the 6.3 percent reduction for the U.S. as a whole. It then took until June 2018 for
the employment level to reach 1.702 million, the highest level before the coronavirus pandemic-induced
recession of 2020. However, the employment level in June 2018 was lower than the level in December
2007, meaning Connecticut never fully recovered all of the jobs lost in the Great Recession notwithstanding
the length of the recovery.4

Compared to the U.S. as a whole, Connecticut also recovered more slowly from the two recessions that
preceded the Great Recession: the recession of 1990–91 (which officially spanned from July 1990 to March
1991) and the recession of 2001 (which officially spanned from March 2001 to November 2001). First,
consider the recession of 1990–91. The U.S. lost 1.6 million jobs between July 1990 and May 1991, a 1.4
percent reduction, and that job loss was then made up by February 1993. In comparison, Connecticut lost
97,500 jobs between July 1990 and March 1992, a reduction of six percent, which was deeper and longer
than that for the U.S. as a whole. The job loss in Connecticut was not then fully made up until December
1997, several years after the full recovery at the national level.

Second, consider the recession of 2001. The U.S. lost 2.6 million jobs between March 2001 and August
2003, a 2 percent reduction, and that job loss was then made up by January 2005. In comparison, Connecticut
lost 43,300 jobs between March 2001 and September 2003, a reduction of 2.6 percent, which was deeper
and longer than that for the U.S. as a whole. The job loss in Connecticut was then not fully made up until
April 2006, more than a year after the full recovery at the national level.5

Altogether, Connecticut spent most of the three decades before 2020 slowly recovering jobs lost in recessions
rather than increase the overall number of jobs, resulting in a job growth gap of more than 36 percentage
points compared to the U.S. as a whole. From January 1990 to January 2020, employment in the U.S.
increased by 43 million or 39.4 percent. Over the same period, employment in Connecticut increased by
only 45,000 or 2.7 percent, a job growth gap of 36.7 percentage points. If the job growth rate in Connecticut
had matched the U.S. over that period, employment in the state would have totaled 2.305 million in January
2020 rather than 1.698 million, a gap of 607,000 jobs.6

CONNECTICUT VOICES FOR CHILDREN: State of Working Connecticut, 2021 | 6

Figure 1. Historical Job Growth in the U.S.

*Data from the U.S. Bureau of Labor Statistics.

                      Figure 2. Historical Job Growth in Connecticut

*Data from the Connecticut Department of Labor.

                                    CONNECTICUT VOICES FOR CHILDREN: State of Working Connecticut, 2021 | 7
Figure 3. Current Job Shortfall in the U.S.

         *Data from the U.S. Bureau of Labor Statistics and author’s calculations.

                                 Figure 4. Current Job Shortfall in Connecticut

          *Data from the Connecticut Department of Labor and author’s calculations.

CONNECTICUT VOICES FOR CHILDREN: State of Working Connecticut, 2021 | 8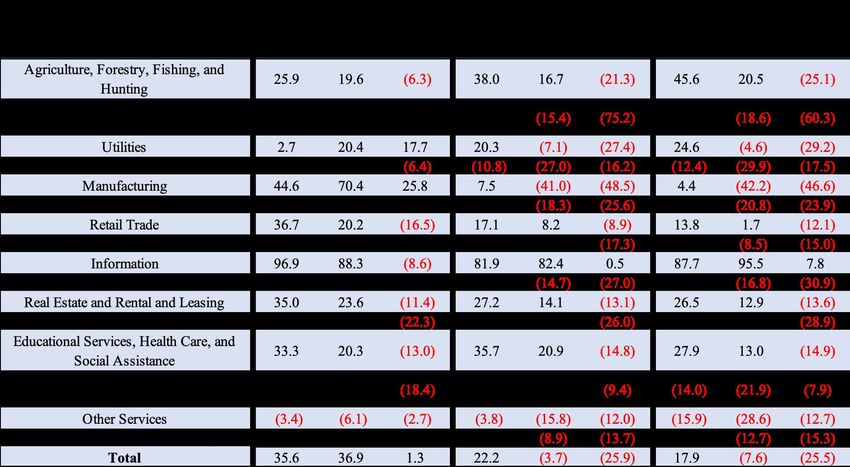
Similar to the three prior recessions, the coronavirus pandemic-induced recession of 2020 (which officially
spanned from February 2020 to April 2020) generated a deeper job loss in Connecticut than the U.S. as a
whole. Using the U.S. as a baseline, Figure 3 shows that nonfarm employment fell from 152.5 million in
February 2020 to 130.2 million in April 2020, a loss of 22.4 million jobs, or a 14.7 percent reduction, the
largest and sharpest reduction on record at the national level.7

Shifting to Connecticut, Figure 4 shows that nonfarm employment fell from 1.696 million in February
2020 to 1.404 million in April 2020, a loss of 292,000 jobs, or a 17.2 percent reduction, which was deeper
than the 14.7 percent reduction for the U.S. as a whole.8

Similar to the three prior recoveries, the recovery from the recession of 2020 will likely take Connecticut
several years and likely significantly lag the pace for the U.S. as a whole. As of July 2021—the most recent
month data are available for a national- and state-level comparison—the job shortfall in the U.S. stands
at 5.7 million when using February 2020 as a baseline, and the job shortfall increases to 9.1 million when
adding the job growth that likely would have occurred in the absence of the coronavirus pandemic and
recession. In Connecticut, the job shortfall stands at 96,000 when using February 2020 as a baseline, and
the job shortfall increases to 112,200 when using the pre-Great Recession peak as a baseline.

Table 1 provides time estimates to close the current job shortfall in the U.S. and Connecticut using five
job growth estimates: the average growth rate for 2021; the average growth rate for each of the three prior
recovery periods; and the average growth rate of the four estimates. For the U.S., the time estimates to close
the current 5.7 million job shortfall range from a low of 0.8 years to a high of 4.8 years and the average is
1.8 years. For Connecticut, the time estimates to close the current 96,000 job shortfall range from a low of
1.9 years to a high of 20.6 years and the average is 5.3 years.9

            Table 1. Time Estimates to Close the Current Job Shortfall Based on Past Job Growth

*Average monthly job growth following the recession of 2020 is based on January 2021 through July 2021.
**Data from the U.S. Bureau of Labor Statistics, Connecticut Department of Labor, and author’s calculations.

                                                CONNECTICUT VOICES FOR CHILDREN: State of Working Connecticut, 2021 | 9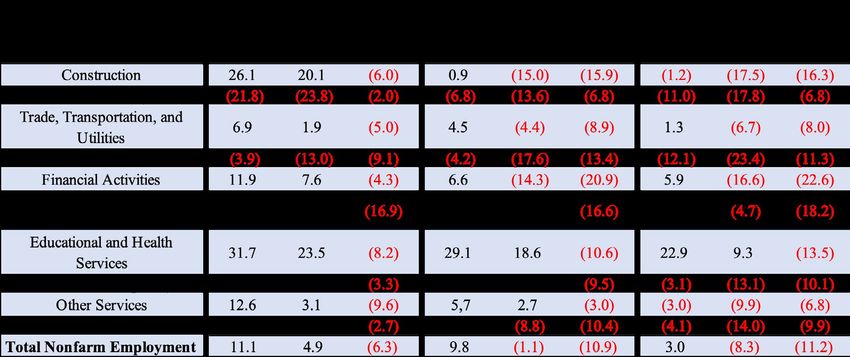
Connecticut’s job growth has underperformed the job growth in the U.S. in every major sector. Providing
background information for the ensuing job growth analysis by sector, Table 2 shows the relative size of
the job market sectors (measured as a percent of total jobs) in the U.S. and Connecticut at three points in
time: 2007, 2019, and 2020. The key takeaway is that the composition of the job market in the U.S. and
Connecticut has been and continues to be very similar. For example, in 2020, manufacturing accounted
for 9.7 percent of total jobs in Connecticut and 8.6 percent in the U.S., a difference of only 1.2 percentage
points. For a more comprehensive comparison, the difference in the size of nine of the 10 major sectors in
2020 was 1.6 percentage points or fewer. The one exception was educational and health services, which
accounted for 20.6 percent of jobs in Connecticut but only 16.3 percent in the U.S., a difference of 4.2
percentage points.10

Shifting to job growth by sector, Table 3 shows a comparison of the U.S. and Connecticut over three
periods: the decade before the Great Recession (1997–2007); the Great Recession through the recovery
period (2007–2019); and the Great Recession through the recession of 2020 (2007–2020).

For the first period (1997 to 2007), the number of jobs grew by 4.9 percent in Connecticut and 11.1 percent
in the U.S., a growth gap of 6.3 percentage points. The slower overall job growth in Connecticut was
the product of slower growth in all 10 major sectors. Specifically, in eight sectors, the growth rate in
Connecticut lagged the growth rate in the U.S.; and in two sectors, the contraction rate in Connecticut
exceeded the contraction rate in the U.S.

For the second period (2007 to 2019), the number of jobs contracted by 1.1 percent in Connecticut and
grew by 9.8 percent in the U.S., a growth gap of 10.9 percentage points. The slower and negative overall
job growth in Connecticut was the product of slower growth in all 10 major sectors. Specifically, in four
sectors, the growth rate in Connecticut lagged the growth rate in the U.S.; in four sectors, Connecticut
experienced a contraction, whereas the U.S. experienced growth; and in two sectors, the contraction rate in
Connecticut exceeded the contraction rate in the U.S.

For the third period (2007 to 2020), the same dynamic occurred, though the recession of 2020 widened the
divide. Specifically, the number of jobs contracted by 8.3 percent in Connecticut and grew by 3 percent
in the U.S., a growth gap of 11.2 percentage points; and the slower and negative overall job growth in
Connecticut was the product of slower growth in every sector.11

Government is the third largest job market sector in Connecticut and the growth rate gap in that sector
has widened over time and contributed to the state’s weak job growth. From 1997 to 2007, a period when
overall jobs in Connecticut grew by 4.9 percent, government jobs grew by 10.5 percent, which was only
2.7 percentage points below the U.S. growth rate. In comparison, from 2007 to 2019, a period when overall
jobs in Connecticut contracted by 1.1 percent, government jobs contracted by 8.8 percent, which was 10.4
percentage points below the U.S. growth rate. If government job growth in Connecticut had matched the
U.S. growth rate over that period, Connecticut would have 26,700 additional jobs. Also important, on
average, more than 85 percent of government jobs are at the state and local levels, and Black workers and
women are disproportionately represented in those jobs.12

CONNECTICUT VOICES FOR CHILDREN: State of Working Connecticut, 2021 | 10
Table 2. Composition of the Job Market

*Data from the U.S. Bureau of Labor Statistics, the Connecticut Department of Labor, and author’s calculations.
Numbers in parentheses are negative.

                                            Table 3. Job Growth by Sector

*Data from the U.S. Bureau of Labor Statistics, the Connecticut Department of Labor, and author’s calculations.
Numbers in parentheses are negative.

                                                CONNECTICUT VOICES FOR CHILDREN: State of Working Connecticut, 2021 | 11
Labor Productivity Growth
The U.S. has experienced a slowdown in productivity growth for more than a decade. Addressing the
significance of labor productivity growth, which together with job growth (or labor hours) are the two
components of economic output growth, the U.S. Bureau of Labor Statistics (BLS) explains,
Labor productivity is a measure of economic performance that compares the amount of goods and
services produced (output) with the number of labor hours used in producing those goods and services.
… Labor productivity growth is vitally important to present and future prospects for economic
growth, because it represents the only path by which economic growth can rise above what would
be possible by simply increasing labor hours (as, by definition, economic growth can only come
from either hours growth or labor productivity growth). The economic gains brought about by labor
productivity growth … hold the potential to lead to improved living standards for those participating
in an economy, in the form of higher income, greater leisure time, or a mixture of both.”13
Figure 5 shows that labor productivity growth in the U.S. decreased from an average of 2.9 percent a
year from 1997 through 2006 to an average of 1.5 percent a year from 2007 through 2020.14 In a recent
report, the BLS provided an overview of the leading research on factors that contribute to the productivity
slowdown—and that, if reversed, as addressed in the policy options section, would increase productivity.
The factors contributing to the slowdown include, but are not limited to:
Rising industry concentration and greater restraints on competition—Research shows a negative impact
on productivity from “rising concentration in ownership across firms.” Research also shows the negative
impact on productivity from the rise in “relaxed antitrust enforcement, increased mergers and acquisitions,
and other restraints on competition, including increases in occupational licensing by states, the growth of
land use restrictions, a greater scope of intellectual property law, and increases in lobbying and political
rent seeking.”15
Rising income inequality—Research shows that “rising inequality is reducing productivity growth, by
stifling ‘the ability to harness the talents of potential innovators across the income spectrum.’ ”16
Connecticut has experienced an even greater slowdown in labor productivity growth than the recent historic
slowdown in the U.S. as a whole. For the more limited period that state data are publicly available, Figure
6 shows that from 2007 to 2020 labor productivity grew by a total of 17 percent in the U.S. but only
0.7 percent in Connecticut, a productivity growth gap of 16.9 percentage points. Put in annual terms,
productivity grew by an average of 1.5 percent in the U.S. but only 0.1 percent in Connecticut. Using either
measure—cumulative growth or average annual growth— Connecticut had the third worst productivity
growth of any state during the recent historic slowdown, outperforming only Louisiana and Wyoming.17
CONNECTICUT VOICES FOR CHILDREN: State of Working Connecticut, 2021 | 12Figure 5. Annual and Average Real Labor Productivity Growth, 1997–2020
*Data from the U.S. Bureau of Labor Statistics
Figure 6. Cumulative Real Labor Productivity Growth, 2007–2020
*Data from the U.S. Bureau of Labor Statistics
CONNECTICUT VOICES FOR CHILDREN: State of Working Connecticut, 2021 | 13Economic Output Growth In the decade before the Great Recession, Connecticut’s economy grew substantially and even exceeded the growth rate for the U.S. as a whole. Using gross domestic product (GDP), which measures the value of the final goods and services produced and is one of the most popular indicators of overall economic health, Figure 7 shows that from 1997 to 2007 real (inflation-adjusted) economic output growth totaled 35.6 percent in the U.S. and 36.9 percent in Connecticut. Put in annual terms, real economic output growth averaged 3.1 percent in the U.S. and 3.2 percent in Connecticut. Using either measure—total growth or average annual growth—Connecticut’s economy outperformed the U.S. economy. Although the BLS does not provide state-level productivity data for this period, the combination of stronger economic growth compared to the U.S. but weaker job growth indicates that Connecticut’s labor productivity growth significantly exceeded that for the U.S. because, as noted, economic growth is a product of both job growth (or labor hours) and labor productivity growth.18 From the Great Recession through the decade-plus recovery period, Connecticut had the slowest growing economy in the U.S. Figure 8 shows that from 2007 through 2019 real (inflation-adjusted) economic output growth totaled 22.2 percent in the U.S. and -3.7 percent in Connecticut, meaning Connecticut’s economic output was smaller at the end of 2019 compared to 2007. Put in annual terms, real economic output growth averaged 1.7 percent in the U.S. and -0.3 percent in Connecticut. Using either measure—total growth or average annual growth—Connecticut had the slowest economic growth of any state in the U.S. due to both weak job growth and weak labor productivity growth.19 The recession of 2020 shrank Connecticut’s economy more than the U.S. economy as a whole, adding to the state’s slow economic growth. In 2020, economic output contracted by 3.5 percent in the U.S. and 4.1 percent in Connecticut. Combining this contraction with the preceding period, real economic output growth from 2007 through 2020 totaled 17.9 percent in the U.S. and -7.6 percent in Connecticut, meaning Connecticut’s economic output was substantially smaller at the end of 2020 compared to 2007. Put in annual terms, real economic output growth averaged 1.3 percent in the U.S. and -0.6 percent in Connecticut. Using either measure—total growth or average annual growth—Connecticut had the second slowest economic growth in the U.S. due to weak job growth and weak labor productivity growth. Only Wyoming had a slower growing economy during this period.20 Connecticut’s economy would be more than 25 percent larger today if it had simply grown at the same rate as the U.S. as a whole since 2007. If Connecticut’s economy had grown by 17.9 percent from 2007 through 2020 rather than contract by 7.6 percent, it would be 25.5 percent larger today. To understand the significance of this economic output growth gap, consider its impact on the state’s fiscal standing. In 2019—the most recent year state and local data are available—Connecticut’s tax revenue totaled $18 billion at the state level and $11.6 billion at the local level. Applying the same tax system to an economy 25.5 percent larger, Connecticut’s tax revenue would be an estimated $4.6 billion greater at the state level and $3 billion greater at the local level, a total of $7.6 billion a year that Connecticut could use to fund a state child tax credit, increase the state’s earned income tax credit, increase the state’s property tax credit, increase spending on early care, and more.21 CONNECTICUT VOICES FOR CHILDREN: State of Working Connecticut, 2021 | 14
Figure 7. Cumulative Real Economic Output Growth, 1997–2007

*Data from the U.S. Bureau of Economic Analysis.

          Figure 8. Cumulative Real Economic Output Growth, 2007–2020

*Data from the U.S. Bureau of Economic Analysis.

                                 CONNECTICUT VOICES FOR CHILDREN: State of Working Connecticut, 2021 | 15
Connecticut’s economic output growth has underperformed that in the U.S. in nearly every major sector since the Great Recession. Providing background information for the ensuing economic output growth analysis by sector, Table 4 shows the relative size of the economic sectors (measured as a percent of total output) in the U.S. and Connecticut at three points in time: 2007, 2019, and 2020. The key takeaway is that the composition of the economy in the U.S. and Connecticut has been and continues to be similar. For example, in 2020, professional and business services accounted for 11.8 percent of total economic output in Connecticut and 12.8 percent in the U.S., a difference of only 1 percentage point. For a more comprehensive comparison, the difference in the size of 14 of the 16 major economic sectors in 2020 was 1.6 percentage points or fewer. One exception was finance and insurance, which accounted for 15 percent of economic output in Connecticut but only 8.3 percent in the U.S., a difference of 6.7 percentage points. The other exception was government and government enterprises, which accounted for 12.6 percent of economic output in the U.S. but only 9.9 percent in Connecticut, a difference of 2.8 percentage points.22 Shifting to economic output growth by sector, Table 5 shows a comparison of the U.S. and Connecticut over three periods: the decade before the Great Recession (1997–2007); the Great Recession through the recovery period (2007–2019); and the Great Recession through the recession of 2020 (2007–2020). For the first period (1997 to 2007), economic output grew by 36.9 percent in Connecticut and 35.6 percent in the U.S. The higher overall growth rate in Connecticut was the product of above average growth in seven economic sectors and below average growth in nine sectors. For the second period (2007 to 2019), economic output contracted by 3.7 percent in Connecticut and grew by 22.2 percent in the U.S., a growth gap of 25.9 percentage points. The slower and negative overall growth rate in Connecticut was the product of below average growth in every major economic sector with the exception of information, which accounted for 5.6 percent of the state’s total economic output in 2019. For the third period (2007 to 2020), economic output contracted by 7.6 percent in Connecticut and grew by 17.9 percent in the U.S., a growth gap of 25.5 percentage points. The slower and negative overall growth rate in Connecticut was the product of below average growth in every major economic sector with the exception of information, which accounted for 6.1 percent of the state’s total economic output in 2020.23 Altogether, the analysis shows that since the Great Recession, Connecticut’s economy has shrunk overall and underperformed the U.S. in economic output growth in nearly every major economic sector due to a combination of slower job growth in all major sectors of the job market and slower labor productivity growth. Moreover, based on the current slower pace of job growth in Connecticut, the state’s economy is on track to grow slower than the U.S. economy during the recovery from the recent recession. CONNECTICUT VOICES FOR CHILDREN: State of Working Connecticut, 2021 | 16
Table 4. Composition of Economic Output

*Data from the U.S. Bureau of Economic Analysis and author’s calculations. Numbers in parentheses are negative.

                                 Table 5. Growth in Economic Output by Sector

*Data from the U.S. Bureau of Economic Analysis and author’s calculations. Numbers in parentheses are negative.

                                              CONNECTICUT VOICES FOR CHILDREN: State of Working Connecticut, 2021 | 17
Connecticut’s Inequitable Economic Distribution As noted, growth in economic output is important because it increases the tax base and thereby strengthens a state’s ability both to pay down long-term obligations (i.e., debt and unfunded pension liabilities) and to maintain and/or increase support for working- and middle-class families. Growth in economic output is also important because, when equitably distributed, it increases the material standard of living for all families through wage growth in the job (or labor) market. This section of the report provides an overview of Connecticut’s economic distribution and it proceeds in three parts: The first part provides an overview of wage inequality. The second part provides an overview of wage gaps, which exacerbate wage inequality for certain groups of workers, especially workers of color. The third part provides an overview of worker power. For a more detailed overview of Connecticut’s inequitable economic distribution—including income inequality, the racial income gap, wealth inequality, and the racial wealth gap—see CT Voices’ 2020 reports, “Advancing Economic Justice in the Labor Market” and “Advancing Economic Justice Through Tax Reform.”24 The following is a summary of the key findings of this section: Wage inequality. The rise in wage inequality in Connecticut is even greater than the historic rise in the U.S. as a whole, and it contributes to income inequality and wealth inequality. Wage gaps. The racial wage gap in Connecticut is even greater than in the U.S. as a whole, and it contributes to the racial income gap and racial wealth gap, which exacerbate income and wealth inequality for families of color. The rise in wage inequality also includes several other notable wage gaps, such as a gender wage gap, an education wage gap, and a union wage gap. Worker power. The decline of unions and the rise of routine excessive unemployment both contribute to the decline of worker power, especially for workers of color, and that in turn contributes to rising wage inequality and substantial wage gaps. Altogether, the analysis shows that Connecticut’s economy has a highly inequitable distribution that harms low- and middle-wage workers (or working- and middle-class families), especially workers of color. This is due in large part to the decline of unions and the rise of routine excessive unemployment, both of which weaken worker power, especially for workers of color. CONNECTICUT VOICES FOR CHILDREN: State of Working Connecticut, 2021 | 18
Wage Growth
Wage inequality has been rising for several decades in the U.S. For workers at three
percentiles—the 10th, the 50th (i.e., the median or typical worker), and the 90th— Figure
9 shows the real hourly wage in 2020 dollars from 1979 to 2020, and Figure 10 shows
real hourly wage growth as a cumulative percentage. Over this period, the real hourly
wage for a worker at the 10th percentile only increased from $9.87 to $11.01, a total
growth of 11.6 percent, and the real hourly wage for the median worker only increased
from $17.00 to $20.92, a total growth of 23.1 percent. In contrast, the real hourly wage
for a worker at the 90th percentile increased from $33.74 to $52.88, a total growth of
56.7 percent.25

Wage inequality has been rising for several decades in Connecticut and is even greater
than in the U.S. as a whole. From 1979 to 2020, the real hourly wage for a worker in
Connecticut at the 10th percentile only increased from $10.04 to $11.89, a total growth
of 18.4 percent, and the real hourly wage for the median worker only increased from
$17.69 to $24.65, a total growth of 39.3 percent. In contrast, the real hourly wage for
a worker at the 90th percentile increased from $35.74 to $59.64, a total growth of 66.9
percent. If wages for all workers had grown at the same rate as for workers at the top, a
worker at the 10th percentile would have made $16.76 an hour rather than $11.89, and
a worker at the 50th percentile would have made $29.52 an hour rather than $24.65. By
several measures, wage inequality in Connecticut exceeds that in the U.S. For example,
in Connecticut in 2020 a worker at the 90th percentile had a real hourly wage that was
$47.75 (or 5 times) greater than that for a worker at the 10th percentile, whereas in the
U.S. the difference was $41.87 (or 4.8 times) greater.26

The most recent increase in wage growth is due in large part to a change in the
composition of the workforce and therefore wage inequality is likely even greater than
the data show. In 2020, the U.S. lost 9.7 million jobs, of which 3.7 million, or 38 percent,
were in the relatively low-wage sector of leisure and hospitality. Likewise, Connecticut
lost 127,200 jobs, of which 38,700, or 30 percent, were in leisure and hospitality. This
disproportionate loss of low-wage jobs altered the composition of the workforce and
resulted in the appearance of substantial wage growth. For example, a worker at the 20th
percentile of the wage distribution in 2019 that maintained the same wage but moved
down to a lower percentile in 2020 due to the massive layoff of even lower-wage workers
is recorded as wage growth at the lower percentile. That recorded growth, however, does
not provide a meaningful account of how the same group of workers fare over time.
A portion of that recorded wage growth will therefore likely be reversed as low-wage
workers return to the workforce.27

Wage inequality is a key contributor to income inequality and wealth inequality. As
detailed in our 2020 reports, Connecticut has high levels of income inequality and wealth
inequality.28 The wage inequality reviewed here contributes to both. Specifically, because
wage income is the largest source of total income for most workers, the rise in wage
inequality contributes to the rise in income inequality.29 Moreover, because income is an
important resource for accruing wealth, the rise in wage inequality contributes to the rise
in wealth inequality.30

                                          CONNECTICUT VOICES FOR CHILDREN: State of Working Connecticut, 2021 | 19
Figure 9. Real Hourly Wage by Percentile, 1979–2020
*Data from the U.S. Bureau of Labor Statistics and the Economic Policy Institute’s calculations
Figure 10. Cumulative Real Hourly Wage Growth by Percentile, 1979–2020
*Data from the U.S. Bureau of Labor Statistics and the Economic Policy Institute’s calculations
CONNECTICUT VOICES FOR CHILDREN: State of Working Connecticut, 2021 | 20Wage Gaps
The rise in wage inequality in the U.S. includes a substantial racial wage gap. Table
6 shows for a typical worker (i.e., at the 50th percentile) the wage gap in the U.S. by
race and ethnicity (referred to here as simply the racial wage gap, the conventional
short-hand label). For example, in 2020, a typical Black worker made $17.56 an hour,
which is $3.36 less than the wage for the overall typical worker, or the equivalent of
$0.84 for each $1.00 that the overall typical worker earned. In contrast, a typical white
worker made $22.98 an hour, which is $2.06 greater than the wage for the overall
typical worker, or the equivalent of $1.10 for each $1.00 that the overall typical worker
earned.31
The racial wage gap in Connecticut is even greater than in the U.S. as a whole. Table
7 shows for a typical worker (i.e., at the 50th percentile) the wage gap in Connecticut
by race and ethnicity. For example, a typical Black worker in 2019—the most recent
year data are available due to the small sample size—made $15.04 an hour, which is
$6.93 less than the wage for the overall typical worker, or the equivalent of $0.68 for
each $1.00 that the overall typical worker earned. This is significantly greater than the
gap in the U.S. in 2019, which was $3.25 or the equivalent of $0.83 for each $1.00 that
the overall typical worker earned. To take another example, a typical Hispanic worker
in Connecticut in 2020 made $17.36 an hour, which is $7.29 less than the wage for the
overall typical worker, or the equivalent of $0.70 for each $1.00 that the overall typical
worker earned. This is significantly greater than the gap in the U.S. in 2020, which was
$3.92 or the equivalent of $0.81 for each $1.00 that the overall typical worker earned.32
The racial wage gap is a key contributor to the racial income gap and the racial wealth
gap. As detailed in our 2020 reports, Connecticut has a substantial racial income gap
and a substantial racial wealth gap.33 The racial wage gap reviewed here contributes to
both. Specifically, because wage income is the largest source of total income for most
workers, the racial wage gap contributes to the racial income gap.34 Moreover, because
income is an important resource for accruing wealth, the racial wage gap contributes
to the racial wealth gap.35
The rise in wage inequality includes several other notable wage gaps, such as a gender
wage gap, an education wage gap, and a union wage gap. Of the three other prominent
wage gaps, the gender wage gap is the smallest, the union wage gap falls in the middle,
and the education wage gap is the largest. All three are reviewed here in order. First,
in Connecticut in 2020 a typical female worker made $23.00 an hour, which is $3.09
less than what a typical male worker made, or $1.65 less than what the overall typical
worker made. Second, in Connecticut in 2020 a typical nonunion worker made $22.10
an hour, which is $8.46 less than what a typical union worker made, or $2.55 less than
what the overall typical worker made. To be sure, the higher wage for union workers
is due to many factors, including a higher level of education on average and a higher
likelihood of working in the public sector. However, even when controlling for other
factors, union workers have a substantially higher wage on average than nonunion
workers.36 Third, in Connecticut in 2020 a typical worker with a high school degree
made $19.33 an hour, which is $15.49 less than what a typical worker with a bachelor’s
degree or higher made, or $5.32 less than what the overall typical worker made.37
CONNECTICUT VOICES FOR CHILDREN: State of Working Connecticut, 2021 | 21Table 6. Wages Gaps in the U.S.
*Data from the U.S. Bureau of Labor Statistics, Economic Policy Institute’s calculations, and author’s calculations.
Table 7. Wages Gaps in Connecticut
*Data from the U.S. Bureau of Labor Statistics, Economic Policy Institute’s calculations, and author’s calculations.
CONNECTICUT VOICES FOR CHILDREN: State of Working Connecticut, 2021 | 22Worker Power
Rising wage inequality is due in large part to the decline of worker power. Worker power arises primarily
from firms being run in the interests of workers as stakeholders, from workers being represented by a union,
and from an economy at full employment, meaning there are jobs available for everyone who wants one and
workers have outside options if their current job is unsuitable. All of these factors strengthen the ability of
workers to increase their wages. The opposite is employer power. This includes monopsony power, which
is when an employer faces little competition from other employers in hiring workers and so is able to set
wages at a lower level than would otherwise be possible.38 However, even without monopsony power,
employers generally have more power than workers. As research from the Economic Policy Institute (EPI),
a nonpartisan public policy think tank, explains, “Workers have only one job to lose while employers
typically have access to plenty of workers, so workers are naturally hit harder by employment relationships
that dissolve.”39
Highlighting the decline of worker power over the last several decades as a key driver of rising wage
inequality, two economists at Harvard University recently explained,
Covid-19 has brought into sharp relief the contrast between the experiences of the higher-income
Americans who receive deliveries and the lower-income Americans who fulfill them, between those
who can work safely from home and those who must expose themselves to risk, often with inadequate
protection, between those who have the power to safeguard their health and their living standards
and those who do not. More broadly, it has highlighted the long-standing trends in the U.S. economy
toward a falling labor share of income, rising income inequality and slow wage growth for most
workers—even as corporate stock market valuations and profitability rise.
Economic analysis often ascribes these trends to some combination of globalization, technological
change and rising monopoly power. But our research suggests that a more compelling explanation
is the broad-based decline in worker power. As workers have become less able to share in the profits
generated by their firms, income has been redistributed from employees to the owners of capital.40
Substantial wage gaps are due in large part to the even greater decline of power for certain groups of
workers, such as workers of color. Stressing important disparities in the decline of worker power, research
from EPI explains, “Understanding wage suppression as the result of the exercise of power in labor markets
widens our understanding of the potential sources of these long-standing race and gender disparities, gaps
that widened during the coronavirus pandemic. The systemic racism that slots minority workers into lesser-
paid jobs has made these workers the primary victims of the systematic weakening of worker power.
Consequently, one of the key mechanisms to lessen racial and gender inequities is to restore worker power
generally as well as to shape policy to ensure all workers have access to good jobs.”41
The decline in unions is a major contributor to the decline of worker power and in turn the rise in wage
inequality. Between 1979 and 2020, union membership in the U.S. declined from 24 percent of workers to
11 percent, and union coverage (i.e., nonunion members whose work is covered by collective bargaining)
declined from 27 percent to 12 percent. Over the same period, union membership in Connecticut declined
from 25 percent to 17 percent, and union coverage declined from 28 percent to 18 percent.42 Addressing the
impact on wage inequality, research from EPI explains that “unions have historically been more likely to
organize middle-wage than high-wage workers, which lowers inequality.”43 There is also a spillover effect.
CONNECTICUT VOICES FOR CHILDREN: State of Working Connecticut, 2021 | 23As EPI adds, “When unions are able to set strong pay standards in particular occupations or industries
through collective bargaining, the employers in those settings also raise the wages and benefits of nonunion
workers toward the standards set through collective bargaining. Thus, the weakening of the collective
bargaining system has had an adverse impact on the compensation of both union and nonunion workers.”44
The decline in unions is a major contributor to the even greater decline of power for certain groups of
workers, especially workers of color, which in turn contributes to substantial wage gaps. Research from
EPI explains that currently “black workers are more likely than white workers to be represented by a union,
and black workers who are in unions get a larger boost to wages from being in a union than white workers
do (i.e., the ‘union wage premium’ is larger for black workers than for white workers). … This means that
the decline of unionization has played a significant role in the expansion of the black-white wage gap.”45
Further underscoring the importance of unions for strengthening worker power and in turn securing a more
equitable wage distribution, President Joe Biden explained this year,
As America works to recover from the devastating
challenges of a deadly pandemic, an economic crisis, and a
reckoning on race that reveals deep disparities, we need to
summon a new wave of worker power to create an economy
that works for everyone. …
That starts with rebuilding unions. The middle class built
this country, and unions built the middle class. Unions give
workers a stronger voice to increase wages, improve the
quality of jobs and protect job security, protect against
racial and all other forms of discrimination and sexual
harassment, and protect workers’ health, safety, and benefits
in the workplace. Unions lift up workers, both union and
nonunion. They are critical to strengthening our economic
competitiveness.
But, after generations of sweat and sacrifice, fighting hard
to earn the wages and benefits that built and sustained the
American middle class, unions are under siege. Nearly
60 million Americans would join a union if they get a
chance, but too many employers and States prevent them
from doing so through antiunion attacks. They know that
without unions, they can run the table on workers, union
and nonunion alike.46
CONNECTICUT VOICES FOR CHILDREN: State of Working Connecticut, 2021 | 24The rise of excessive high unemployment is another major contributor to the decline of worker power and
in turn the rise in wage inequality. Figure 11 and Figure 12 show the unemployment rate cycle in the U.S.
and Connecticut, respectively. Note at both the national and state levels the unemployment rate tends to rise
quickly during a recession, it then tends to decrease gradually during the recovery, and once unemployment
finally returns to the pre-recession rate or falls below it for a short period a new recession tends to occur
and restart the process.47 As a result, the economy is usually not at full employment. For a more detailed
analysis, Table 8 uses an unemployment rate of 4 percent or below as a proxy for full employment and
shows that during the long recovery from the Great Recession the overall unemployment rate in the U.S.
averaged 6.3 percent and was at or below 4 percent only 19.5 percent of the time.48
Addressing the relationship between the unemployment rate and worker power and wages, research from
the Federal Reserve Bank of St. Louis explains that “labor market conditions affect high-wage and low-
wage earners differently. … [W]orkers at and above the median wage have a higher job-finding rate and are
more likely to be able to move directly from job to job. Therefore, labor market conditions have less of an
impact on their bargaining power and wages. In contrast, workers below the median wage are less likely
to be able to move directly from job to job and have a lower job-finding rate. These workers have fewer
alternatives than higher-paid workers, so an improvement in labor market conditions more directly impacts
their bargaining power and their wages.”49 Similarly, research from EPI finds that a 1 percentage point
decrease in the unemployment rate results in annual wage growth that is 0.5 to 1.5 percentage points greater
for workers at the 10th percentile, 0.4 to 0.9 percentage points greater for workers at the 50th percentile,
and 0.3 to 0.5 percentage points greater for workers at the 90th percentile, meaning lower unemployment
decreases wage inequality.50
The unemployment rate was even greater in Connecticut than in the U.S. during the recovery from the Great
Recession, and it remains greater during the recovery from the coronavirus pandemic-induced recession.
During the recovery from the Great Recession, the overall unemployment rate averaged 6.5 percent in
Connecticut, compared to 6.3 in the U.S., and the unemployment rate was at or below 4 percent only 18
percent of time, compared to 19.5 percent at the national level. Moreover, Table 9 shows that as of July
2021, the unemployment rate is 7.3 percent in Connecticut, compared to 5.4 percent at the national level.
The routine higher unemployment rate in Connecticut contributes to a greater decline in worker power and
in turn greater wage inequality.51
Substantially higher unemployment is a major contributor to the even greater decline of power for specific
groups of workers, especially workers of color, which in turn contributes to substantial wage gaps. The
unemployment rate cycle is especially harmful for workers of color because the unemployment rate is
substantially higher for those workers due in large part to historical and ongoing discrimination in the labor
market and other parts of the economy. For example, the unemployment rate for Black workers in the U.S.
averaged 10.9 percent during the recovery period from the Great Recession, which was greater than the
peak in the overall unemployment rate during the Great Recession itself. To take another example, as of
July 2021, the unemployment rate for Black workers in the U.S. is 8.2 percent, compared to the overall
unemployment rate of 5.4 percent.52
CONNECTICUT VOICES FOR CHILDREN: State of Working Connecticut, 2021 | 25Figure 11. Unemployment Rate in the U.S.
*Data from the U.S. Bureau of Labor Statistics.
Figure 12. Unemployment Rate in Connecticut
*Data from the U.S. Bureau of Labor Statistics and the Economic Policy Institute’s calculations.
CONNECTICUT VOICES FOR CHILDREN: State of Working Connecticut, 2021 | 26Table 8. Recovery from the Great Recession
*Data from the U.S. Bureau of Labor Statistics and author’s calculations.
Table 9. Ongoing Impact of the Coronavirus Recession
*Data from the U.S. Bureau of Labor Statistics and author’s calculations.
Further underscoring the importance of lowering the unemployment rate in order to strengthen worker
power and in turn combat wage inequality and wage gaps, President Joe Biden explained recently,
When it comes to the economy we’re building, rising wages aren’t a bug, they’re a feature. We want
to get something economists call “full employment.” Instead of workers competing with each other
for jobs that are scarce, we want employees to compete with each other to attract work. We want the
companies to compete to attract workers.
That kind of competition in the market doesn’t just give workers more ability to earn a higher wage,
it gives them the power to demand to be treated with dignity and respect in the workplace. … “Full
employment” also means more options and opportunities for workers—including Black, Hispanic
workers, Asian American workers, women—who’ve been left behind in previous economic
recoveries when the labor market never tightened up enough.
Look, this isn’t just good for individual workers, it also makes our economy a whole lot stronger.
When American workers have more money to spend, American businesses benefit. We all benefit.
Higher wages and more options for workers are a good thing.53
Altogether, the analysis shows that Connecticut’s economy has a highly inequitable distribution that harms
low- and middle-wage workers (or working- and middle-class families), especially workers of color. This
is due in large part to the decline of unions and the rise of excessive high unemployment, both of which
weaken worker power, especially for workers of color.
CONNECTICUT VOICES FOR CHILDREN: State of Working Connecticut, 2021 | 27Supporting Connecticut’s Economy and Families To address Connecticut’s primary economic problems—an economy that has shrunk substantially, has a highly inequitable distribution, and is on track to grow slower than the U.S. economy during the recovery from the recent recession—this section of the report proceeds in two parts. The first part provides an overview of the benefits of using the budget as an economic policy instrument. The second part provides several policy options. To be sure, the scope and depth of the state’s economic problems will also require non-budget reforms to support the economy and worker power. The policy options here, however, are limited to the budget. The following is a summary of the key points: The budget as an economic policy instrument. The budget is an effective economic policy instrument because it can work to boost economic growth by increasing both broad job growth and labor productivity growth; at the same time, it can work to create a more equitable economic distribution by reducing both income inequality and income gaps. Policy options. Progressive tax reform would support the state’s economy and working- and middle-class families, especially families of color. Progressive spending reform would support the state’s economy and working- and middle-class families, especially families of color. Progressive budget (tax and spending) reform would provide even more support for the state’s economy and working- and middle-class families, especially families of color. Progressive budget (tax and spending) reform along with an overall increase in tax and spending levels has the potential to provide the greatest support for the state’s economy and working- and middle-class families, especially families of color. CONNECTICUT VOICES FOR CHILDREN: State of Working Connecticut, 2021 | 28
The Budget as an Economic Policy Instrument
The budget is an effective policy instrument to boost economic growth and create a more equitable
economic distribution. As shown, Connecticut’s economic output has shrunk overall and underperformed
the economic output growth in the U.S. in nearly every major economic sector due to a combination of
slower job growth in all major sectors of the job market and slower labor productivity growth; Connecticut’s
economy has a highly inequitable distribution that harms working- and middle-class families, especially
families of color, due in large part to the decline of unions and the rise of excessive high unemployment,
both of which weaken worker power, especially for workers of color; and Connecticut’s economy is on
track to grow slower than the U.S. economy during the recovery from the recent recession.

It is possible to use the budget to address all of these problems. Below is an overview of the ways in which
the budget relates to each economic component: job growth, labor productivity growth, economic output
growth, wage inequality, and wage gaps. The policy options portion of this section then provides a high-
level overview of the primary ways to reform and/or increase the budget.

Job growth. Budget (or tax and spending) reforms that increase the post-tax and transfer income of working-
and middle-class families will increase spending on a wide range of goods and services that the economy
produces, which will work to increase job growth broadly. As research from EPI explains,

      The most direct and powerful way to create jobs quickly when the economy is demand-constrained
      involves changes to fiscal policy—changing the level of taxes or government spending to boost
      aggregate demand and create more jobs. There are definitely more and less efficient ways to use
      fiscal policy to create jobs. The least efficient ways aim to boost resources for the already rich ….
      Delivering resources to the already rich does not induce much new spending because spending by
      these households is not constrained by current income. Fiscal policy changes that boost resources for
      low- and moderate-income households, either through refundable tax credits or transfers, will induce
      much more new spending, because these households’ spending is constrained by current incomes.54

Labor productivity growth. Recall that labor productivity growth has likely slowed in part due to rising
income inequality that stifles the “ability to harness the talents of potential innovators across the income
spectrum.”55 Therefore, budget reforms that decrease income inequality by increasing the post-tax and
transfer income of working- and middle-class families will also likely work to increase labor productivity
growth.

Economic output growth. Because job growth and labor productivity growth are the two components of
economic output growth, budget reforms that increase job growth broadly and increase labor productivity
growth will work to increase economic output growth broadly.

Wage inequality. Budget reforms that increase the post-tax and transfer income of working- and middle-
class families will help to offset wage inequality. The same budget reforms will also help the economy
reach full employment by increasing aggregated demand, which will strengthen worker power and in turn
increase the pre-tax and transfer income of working- and middle-class families.

Wage gaps. Budget reforms that work to increase the pre- and post-tax and transfer income of working-
and middle-class families will especially benefit historically-disadvantaged groups and thereby work to

                                        CONNECTICUT VOICES FOR CHILDREN: State of Working Connecticut, 2021 | 29
You can also read