Napier Positive Ageing Strategy: Background document Te Rautaki Tipu Ora o Ahuriri: Say It Napier
←
→
Page content transcription
If your browser does not render page correctly, please read the page content below
Napier Positive Ageing Strategy:
Background document

Te Rautaki Tipu Ora o Ahuriri:
Te tuarongo o te whare kōrero

DRAFT – JUNE 2019
Contents
Introduction............................................................................................................................................. 1
Part One: Strategy Development ......................................................................................................... 1
   Early Development ....................................................................................................................... 1
   Advisory Structure ........................................................................................................................ 1
   How the Strategy was Informed ................................................................................................... 3
Part Two: Seniors in Napier .................................................................................................................. 9
   Population Profile ......................................................................................................................... 9
   People with Disabilities .............................................................................................................. 19
   Injuries ........................................................................................................................................ 21
   Napier Social Monitor Survey .................................................................................................... 23
   Napier Positive Ageing Strategy Survey .................................................................................... 31
Part Three: International and National Linkages .............................................................................. 41
   Age Friendly Cities ..................................................................................................................... 41
   New Zealand Positive Ageing Strategy 2001 ............................................................................ 42
   Healthy Ageing Strategy, New Zealand ..................................................................................... 43
   Sustainable Development Goals................................................................................................ 45
Timeline ................................................................................................................................................ 46
Linkages ............................................................................................................................................... 46

Tables
Table 1 - Workshops, sessions and presentations during Strategy development, 2017-2018....... 6
Table 2 - Survey distribution channels during Strategy development, 2018 ................................... 7
Table 3 - Māori, non-Māori and total population aged 65+ years, by sex, Napier, 2013 .............. 10
Figures
1 - Advisory structure for development of Napier’s Positive Ageing Strategy, 2017-2018...................... 2
2 - Issues raised in workshops with the community, providers/agencies, and advisory groups, 2017 ... 4
3 - Issues raised by older people in the community workshops, 2017 .................................................... 5
4 - Percent of population 65+ years, Napier, New Zealand and selected cities/districts, 2013 .............. 9
5 - Actual and projected percent of population 65+ years, Napier and New Zealand, 2006-2043 ....... 11
6 - Actual and projected population growth, 65+ age group, total population, Napier, 2013-2038 ....... 11
7 - Actual and projected population growth, 65+ age group, Māori population, Napier, 2013-2038 ..... 12
8 - Percent of population aged 65+ by suburb, 2013 ............................................................................. 12
9 - Distribution of population 65+ years, Napier, 2013 .......................................................................... 13
10 - Ethnic groups of population aged 65+, Napier and New Zealand, 2013........................................ 14
11 - Household composition for people living in occupied private dwellings by age group 65+,
     Napier, 2013.................................................................................................................................... 15
12 - Access to telecommunications in private dwellings 65+, Napier and New Zealand, 2013 ............ 16
13 - Employment status 65+, Napier and New Zealand, 2013 .............................................................. 17
14 - Annual personal income by age group 65+, Napier, 2013 ............................................................. 18
15 - Unpaid activities by age group 65+, Napier, 2013 .......................................................................... 19
16 - Disability rates by age group, Napier and New Zealand, 2013 ...................................................... 20
17 - Number of new claims to ACC, 65+ by sex, Napier, financial years 2012/13-2017/18 ................. 21
18 - Number of new claims to ACC, by age group and claim category, Napier, 2017/18 ..................... 22
19 - Largest number of new claims to ACC by claim type, 65+, Napier, 2017/18 ................................. 23
20 - How well Napier cares and provides for each other, by age group, 2017 ..................................... 25
21 - Views on current relationship between different ethnic groups in Napier, by age group, 2017 ..... 26
22 - Opportunity to express views about future direction of Napier, by age group, 2017 .................... 27
23 - Feeling of safety in Napier, by age group, 2017 ............................................................................. 27
24 - Personal health rating, by age group, 2017.................................................................................... 28
25 - Quality of life improved during last five years, by age group, 2017................................................ 29
26 - Access to internet or smartphone, by age group, 2017.................................................................. 30
27 - Age group of survey respondents, 2018 ......................................................................................... 31
28 - Number of years resided in Napier, 2018 ....................................................................................... 32
29 - Place of residence of survey respondents, 2018............................................................................ 33
30 - Views of ‘Positive Ageing’, survey respondents aged 65+, 2018 ................................................... 34
31 - Views of ‘Positive Ageing’, survey respondents identifying as Māori, 2018 ................................... 35
32 - Views of ‘Positive Ageing’, survey respondents aged under 65, 2018........................................... 36
33 - Percent of respondents saying ‘yes, this is a priority area’, all ages, 2018.................................... 37
34 - Percent of respondents saying ‘yes, this is a priority area’, by age group, 2018 ........................... 38
35 - Top priority areas selected by respondents, all ages by ethnicity, 2018 ........................................ 39
36 - Top priority areas selected by respondents, by age group, 2018 .................................................. 39
37 - Health Ageing Strategy Framework, 2016 ...................................................................................... 44
Introduction

Since mid-2017, we have spoken and connected with a range of Napier residents, from all walks
of life of varying ages and ethnicities from all around the city, to hear their thoughts about
positive ageing. We have held workshops and discussion groups, given presentations, talked at
meetings and with individuals, and run a survey. Everyone we have heard from has been
generous in providing us with their ideas and vision for an age friendly Napier.

This report summarises the information we have collected and the stories and ideas we have
heard. Where feedback of a particular group differs from the overall picture, this is highlighted.
What was striking is the similarity and consistency in responses from the community about the
priorities and ideas for positive ageing. That being said, there are also unique issues of
importance for some groups of residents (eg, Māori and people in their 50s/early 60s). This
document and the accompanying Positive Ageing Strategy (“the Strategy”) are the beginnings of
a collaborative approach for making Napier a more age friendly community.

This is a supporting, background document to the Strategy. It consists of several parts. Part One
outlines the process used to develop the Strategy, including the background to development, the
advisory structures put in place by Council, and the ways in which seniors and other Napier
residents provided input to inform and guide the Strategy’s content.

Part Two presents information about the older/senior population living in Napier, sourced from
national and local statistics and surveys. This information provides context to the Strategy.

Part Three refers to relevant national and international programmes that provide guidance for the
age friendly approach.

Part One: Strategy Development
Early Development
The Council has previously received requests to develop a Positive Ageing policy or strategy,
including in submissions to Annual and Long Term plans. In 2015, Napier’s Council agreed to the
development of a Positive Ageing Strategy with a view to possible future adoption of the Age
Friendly City framework.1 Prior to this, the Napier Connects programme was implemented by the
Council in collaboration with other groups and organisations. This programme aimed to reduce
social isolation among older people by encouraging a range of activities and projects to
strengthen individuals’ connections with their community.2

It was determined that the Positive Ageing Strategy would span a range of sectors, services and
activities in order to achieve broader outcomes. It will therefore require leadership and
collaboration amongst multiple agencies and organisations to achieve its vision.

Advisory Structure
An advisory structure was established prior to development of the Strategy to ensure it was
well informed by agencies, providers and seniors from the Napier community. Two groups
were established, each with a terms of reference agreed by group members (Figure 1).

1   https://extranet.who.int/agefriendlyworld/age-friendly-cities-framework/ Accessed May 2018
2   See http://www.napier.govt.nz/napier/community-development/seniors/napier-connects-toolkit/

                                                           1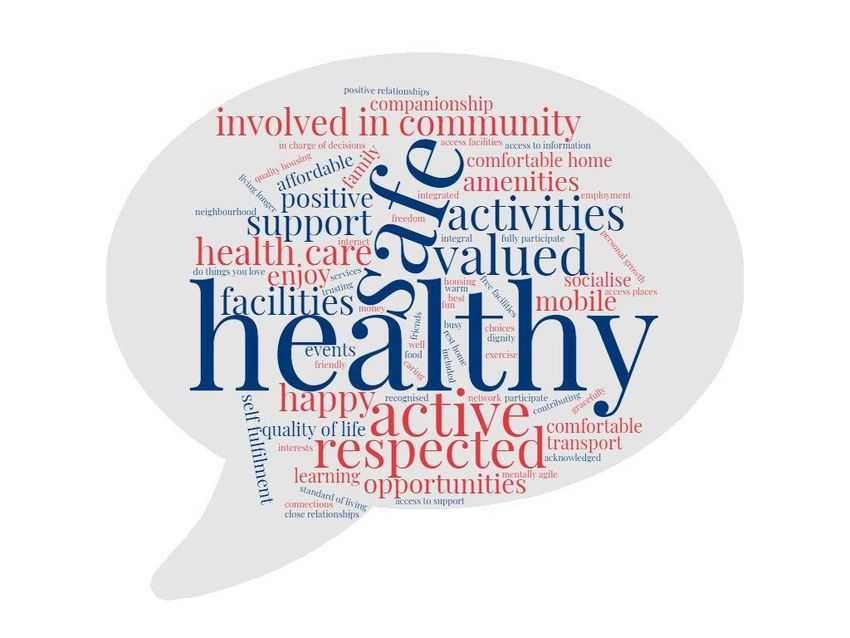
Figure 1 - Advisory structure for development of Napier’s Positive Ageing Strategy, 2017-2018
A Steering Group was set up in May 2017, comprising representatives from agencies and
providers who offer services to seniors in the Napier community. Invitations were extended
to a range of representatives, many of whom actively attended the 6-8 weekly meetings, and
contributed ideas and feedback.
The purpose of the Steering Group was to provide advice and input into Strategy content;
seek feedback from and provide information to networks; and assist with community
engagement during Strategy development.
Members of the Steering Group (some of whom receive email correspondence but are
unable to attend meetings) are:
Age Concern Napier
Grey Power Napier
Hawke’s Bay District Health Board
Hawke’s Bay Regional Council
Health Hawke’s Bay
Housing New Zealand Corporation
Māori Women’s Welfare League (email member)
Ministry of Social Development
Napier City Council (lead)
Red Cross
Retirement Villages Association Hawke’s Bay
St John Ambulance (email member)
Sport Hawke’s Bay
Te Kupenga Hauora – Ahuriri
Te Taiwhenua o Te Whanganui-a-Orotu (email member)
Volunteering Hawke’s Bay.
2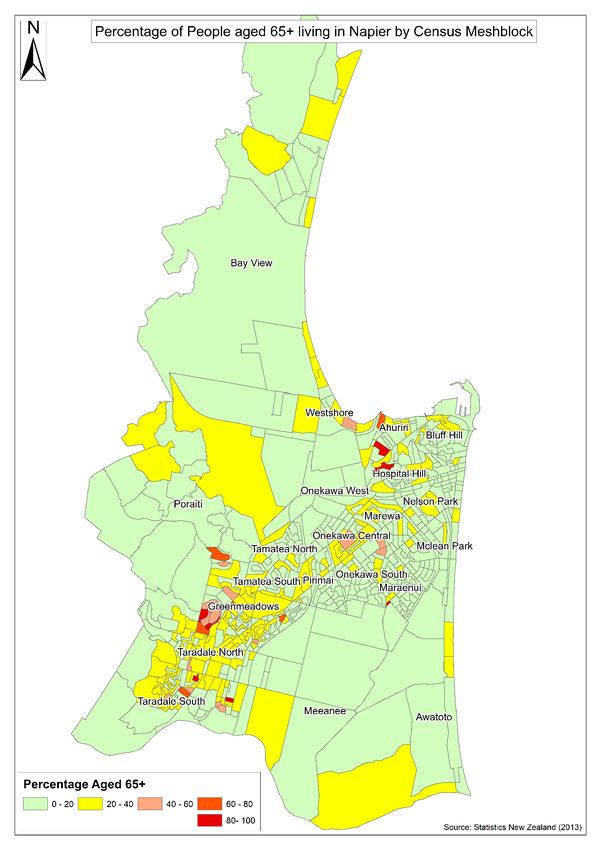
A Reference Group (who by consensus re-named themselves the ‘Living Positively Group’)
began meeting shortly after the Steering Group, in August 2017. A call for nominations was
extended through Steering Group members and other relevant community groups seeking
Napier people with lived experience of ageing or being a senior.
The purpose of the Living Positively Group was to provide advice and input from their lived
experiences; seek feedback from and provide information to networks; and assist with
community engagement during Strategy development.
Fourteen members joined the group from the following organisations and backgrounds:
Age Concern Napier
Bryant House
Grey Power Napier
Napier City Council retirement housing residents
Red Cross
Rotary Clubs of Napier
Spirit of Napier Lions Clubs
Sport Hawke’s Bay Kiwi Senior programme participants
Tiare Ahuriri P.A.C.I.F.I.C.A.
The Living Positively Group also met 6-8 weekly. Some members retired from the Group due
to poor health or other commitments, and new members subsequently joined.
Both groups played a key role in contributing to and guiding development of Napier’s
Positive Ageing Strategy.
The advisory structure will be reviewed following adoption and publication of the Strategy to
have a focus on ongoing implementation and monitoring.
Two Napier City Councillors are the Council ‘champions’ for the Strategy. Councillors
Maxine Boag and Graeme Taylor both have an interest in ageing, and assisted with guiding
the Strategy through the Council approval process.
How the Strategy was Informed
Information and input from seniors living in Napier, and those working with seniors, was key
to shaping development of the Napier Positive Ageing Strategy.
Several relevant national and local strategies with a focus on ageing already exist, however
development of the Napier Strategy began from scratch to ensure its development was
locally relevant. The Living Positively Group and Steering Group identified a potential vision
for the Strategy and a set of possible priority areas following a number of meetings and
discussions. These were further developed during workshops with providers and agencies,
and seniors from the local community.
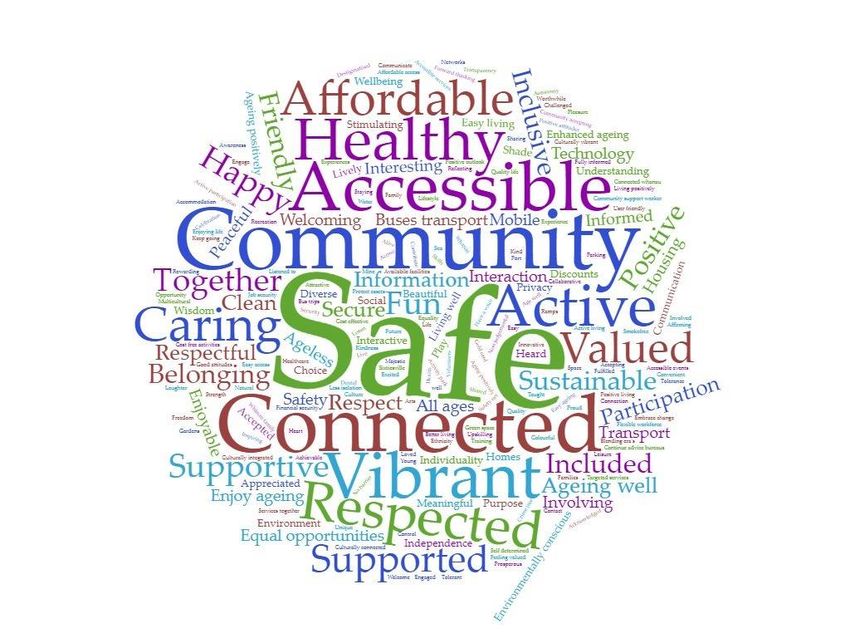
From this series of activities, key priority areas began to emerge. The range of ideas is
shown in the following word clouds, where issues or words identified more often are given
greater prominence (Figures 2 and 3).
3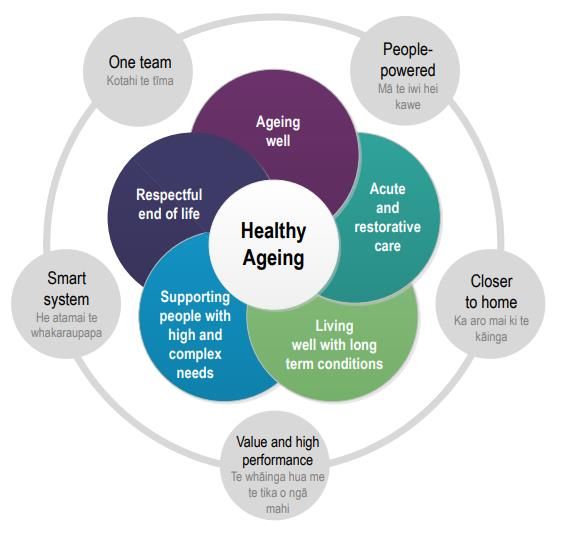
Figure 2 - Issues raised in workshops with the community, providers/agencies, and advisory groups, 2017

                                                   4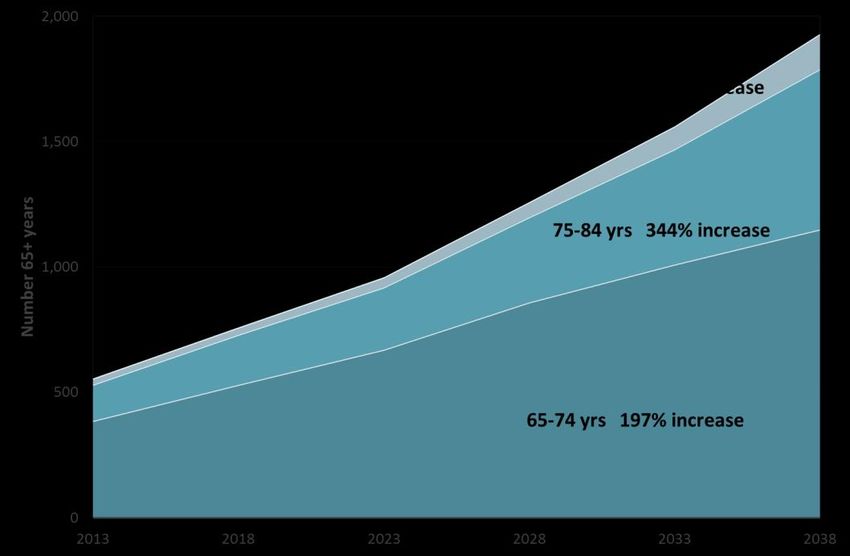
Figure 3 - Issues raised by older people in the community workshops, 2017
A small group of Māori kaumātua and kuia met to discuss positive ageing priorities from their
perspective. Key issues they identified included:
a need for suitable housing; animal-friendly housing
a need for cheaper and more accessible exercise options
better wheelchair accessibility in Napier
improved bus stops (especially timetable signage)
more public transport
a focus on encouraging families and the wider community to support older people
encouraging everyday use of te reo Māori
assisted and supportive learning opportunities, especially in relation to financial
management
education on keeping personal belongings and bank information safe and secure
a vibrant, accessible environment
tika, tapu, noa, manaakitia te wairua o te whenua – a Māori worldview/mātauranga
Māori.
Māori kaumātua and kuia identified a number of key issues for positive ageing,
including the importance of a Māori worldview.
Two discussion groups were also held with Napier residents aged in their 50s and early 60s,
to hear their thoughts about ageing. This generation grew up during a time fundamentally
different from that of the previous generation. People in their 50s and early 60s today were
5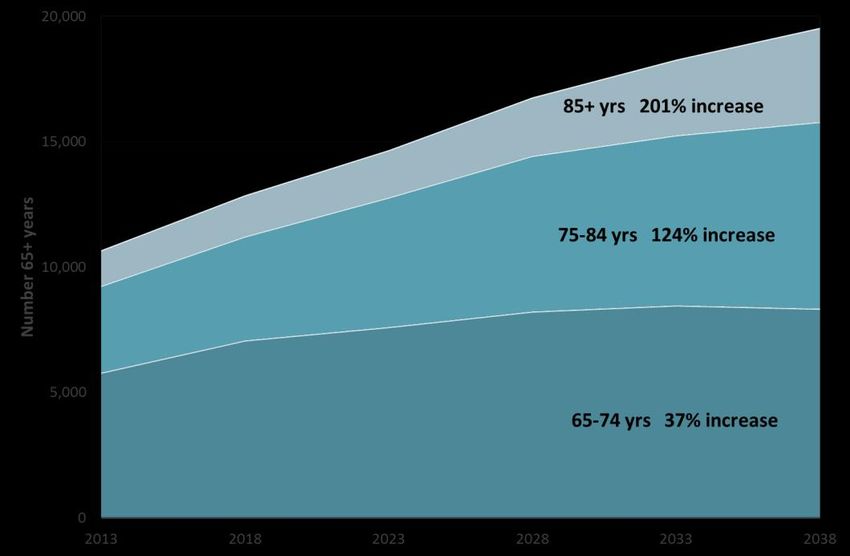
teenagers during the late 1960s into the 1970s – a time of rapid social change, involving the
easier availability of contraception, experimentation with drug taking, and the liberalisation of
views on sexuality, motherhood, and working. These discussion groups were held to
determine the extent to which the priority areas identified by the older generation resonated
with this group.
The next stage of development involved seeking input and ‘testing’ the potential key priority
areas with a wider community audience. This was done through presentations, information
sessions, discussion groups, and a survey (paper copy and online), where participants were
invited to:
provide their vision for an age friendly Napier
give feedback on the suggested priority areas
indicate which of these was most important
identify anything missing, and
outline what was working well and what could be improved in each area.
Seven potential priority areas were identified and ‘tested’ in discussions with the
community.
Table 1 lists the face-to-face presentations and discussions held with Napier residents and
agencies/ providers to inform the Strategy’s development.
Table 1 - Workshops, sessions and presentations during Strategy development, 2017-2018
Group When Participants
Workshops with Reference Group (‘Living Positively Sept-Oct 2017 12
Group’)
Workshops with Steering Group Sept-Oct 2017 12
Seniors workshop 1 22 November 2017 7
Seniors workshop 2 30 November 2017 25-30
Agency/provider workshop 22 November 2017 30
Rotary Napier 12 February 2018 20
Maraenui Kai and Korero Group 19 February 2018 18
Kiwi Seniors Napier 26 February 2018 40-50
Kiwi Seniors Taradale 27 February 2018 30
Taradale Senior Citizens Association 1 March 2018 20
Rotary Greenmeadows 14 March 2018 40
Rotary Taradale 15 March 2018 35
U3A (University of the Third Age) 4 April 2018 80
Discussion groups with 50-64 year olds 10 and 12 April 2018 20
Kahui Pakeke group, Te Kupenga Hauora – Ahuriri 19 April 2018 25
Taradale Lions Club 9 May 2018 18
Hui led by Māori kaumātua and kuia 2 July 2018 8
6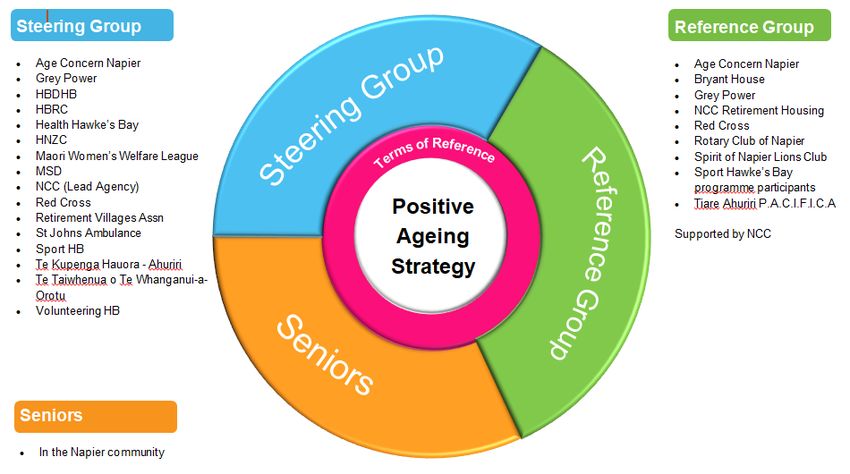
The survey had the same purpose of inviting a wider group of people to give their input into
the Strategy, particularly those who may not otherwise be connected with community and
interest groups. The survey was distributed through a variety of groups and venues between
February and May 2018 (Table 2). Online and paper versions of the survey were available
(with freepost return for the paper survey). The survey was open to Napier residents of all
ages.

                 Table 2 - Survey distribution channels during Strategy development, 2018

  Group                                                       When                          Recipients
  Kiwi Seniors Napier                                         26 February 2018              Est. 30
  Kiwi Seniors Taradale                                       27 February 2018              Est. 30
  Grey Power newsletter                                       March, May 2018               Url link
  Taradale Senior Citizens Association                        1 March 2018                  Est. 10
  Summerset Village, Merlot Drive                             2 March 2018                  180
  Masonic and associated villages                             2 March 2018                  150
  NCC Retirement and Council flats                            6 March 2018                  380
  City Library                                                6 March 2018                  50
  Taradale Library                                            8 March 2018                  50
  Rotary Greenmeadows                                         14 March 2018                 Est. 5
  Rotary Taradale                                             15 March 2018                 Est. 5
  Meals on Wheels, Red Cross                                  16 March 2018                 150
  Facebook posts                                              March, April 2018             Url link
  Grey Power meeting                                          March-April                   Est. 30
  U3A (University of the Third Age)                           4 April 2018                  Est. 40
  DHB – NASC (Needs Assessment Service                        9 April 2018                  100
  Coordination) 65+, EngAGE
  Discussion groups with 50-64 year olds                      10 and 12 April 2018          20
  Kahui Pakeke group, Te Kupenga Hauora – Ahuriri             19 April 2018                 Est. 10
  Community newspaper advertisements                          April, May 2018               Url link
  Taradale Lions Club                                         9 May 2018                    18

                                                    7
From all of the described activities, the following seven areas were confirmed as the
Strategy’s priority areas:
1. Being informed and involved
2. Being safe
3. Community spirit
4. Getting around
5. Health and wellbeing
6. Housing
7. Things to do.
An additional issue, raised in the discussion groups with those in their 50s and early 60s,
was a desire to consider environmental sustainability for future generations. This wasn’t
specifically identified by the over 65s and is anticipated it will be addressed in the Strategy’s
implementation plan under one or more of the other priority areas (eg, sustainability of
transport options, the impact of climate change and water quality on health and wellbeing,
and so on).
Younger residents (in their 50s and early 60s) also expressed a desire to focus
on environmental sustainability.
The seven identified priority areas closely align with both the 10 priority goals of the 2001
national Positive Ageing Strategy and with the Age Friendly City domains (see Part Three).
They also largely reflect the original areas identified by both the Steering Group and Living
Positively Group. The synergies across all of the discussions reinforce the overall
consistency in vision of the Napier community.
8Part Two: Seniors in Napier
Population ageing is a large change affecting many parts of the world, and New Zealand is
no exception. In twenty years’ time, or possibly earlier, the number of seniors living in Napier
will make up a third of the city’s population. In a matter of a few years, seniors in Napier will
outnumber children under the age of 15 for the first time ever.
Findings from a recent Attitudes Towards Ageing survey point to challenges ahead for New
Zealand as our population ages.3 The survey of 1,600 New Zealanders sought to understand
attitudes towards ageing and older people. Almost two-thirds of those surveyed (62%) are
not confident that New Zealand is prepared for the expected increase in the 65+ population
over the next thirty years.
Overall, more than eight out of 10 New Zealanders surveyed across all age groups say they
have high levels of respect for seniors. Many also value their contribution to society (more
than half feel older people are more of an asset than a burden to society, 54%). However,
the survey also found a number of older people feel lonely, socially isolated and/or invisible.
Population Profile
The Census recorded 10,662 people aged 65+ years living in Napier in 20134 (19% of
Napier). Napier has a slightly higher percentage of seniors compared to the national average
of 14% (Figure 4). Other areas have even higher proportions such as Thames-Coromandel
with 27% and Kapiti Coast with 25%. Areas with the lowest proportions include Wellington
(10%), Porirua City (10%), and Auckland (12%).
Figure 4 - Percent of population 65+ years, Napier, New Zealand and selected cities/districts, 2013
Source: 2013 Census of Population and Dwellings
3 Office for Seniors, Te Tari Kaumātua. 2016. Attitudes Towards Ageing: Research commissioned by the Office for Seniors.
Wellington: Ministry for Social Development. http://www.superseniors.msd.govt.nz/documents/attitudes-towards-ageing-
research/attitudes-toward-ageing-summary-report-2016.pdf Accessed May 2018.
4 The most recent Census data available at the time of writing.
9Just over 500 Māori are aged 65+ in Napier. Māori aged over 65 have a slightly ‘younger’
age profile than non-Māori. Over two-thirds of Māori in this age group were 65-74 years
(69%, compared to 53% of non-Māori). In contrast, just 5% of Māori were aged 85+
(compared to 14% of non-Māori).
Just over 500 Māori aged 65+ live in Napier, with a slightly younger age profile
overall.
Older women outnumber men. Overall, women make up 55% of the 65+ age group. Among
older Māori women make up 59%. The percentage of women increases as age increases -
of those aged 85+ years, two-thirds (66%) are women. Among Māori aged 85+, nearly eight
out of ten are women (78%).
Table 3 shows the age groups of seniors living in Napier for Māori, non-Māori, and the total
population.
Table 3 - Māori, non-Māori and total population aged 65+ years, by sex, Napier, 2013
65-74 years 75-84 years 85+ years Total 65+
Māori Male 171 57 6 234
Female 216 87 21 324
Total 387 144 27 558
non-Māori Male 2,538 1,530 480 4,548
Female 2,856 1,794 906 5,556
Total 5,400 3,327 1,386 10,113
Total Male 2,709 1,587 486 4,782
Female 3,072 1,881 927 5,880
Total 5,781 3,468 1,413 10,662
Source: 2013 Census of Population and Dwellings
Note: Totals may not add due to rounding.
Future population growth
Napier’s older population is expected to grow considerably over the next 25-30 years. While
Napier’s total population will increase by about 10%, the senior population aged 65+ is
expected to increase by 83%, from 10,662 to 19,500. This is similar to the national trend.
By 2038, almost a third of Napier’s population (31%) will be aged 65+, compared to 23%
nationally (Figure 5). It is anticipated that the number of seniors in Napier will outnumber
children (aged 0-14) from this year.
Napier’s population of over 65s is expected to almost double in the next 30
years, and for Māori the percentage increase will be even higher.
10Figure 5 - Actual and projected percent of population 65+ years, Napier and New Zealand, 2006-2043
Source: Statistics New Zealand, Subnational Population Projections, 2013(base)-2043 update
http://archive.stats.govt.nz/browse_for_stats/population/estimates_and_projections/SubnationalPopulationProject
ions_HOTP2013base-2043.aspx
Projected growth rates of Napier seniors are expected to be highest amongst those aged 75-
84 and 85+ (Figure 6). Increases are also high for Māori (Figure 7).
Figure 6 - Actual and projected population growth, 65+ age group, total population, Napier, 2013-2038
Source: Statistics New Zealand, Subnational Population Projections, 2013(base)-2043 update
http://archive.stats.govt.nz/browse_for_stats/population/estimates_and_projections/SubnationalPopulationProject
ions_HOTP2013base-2043.aspx
11Figure 7 - Actual and projected population growth, 65+ age group, Māori population, Napier, 2013-2038
Source: Statistics New Zealand, Subnational Population Projections, 2013(base)-2043 update
http://archive.stats.govt.nz/browse_for_stats/population/estimates_and_projections/SubnationalPopulationProject
ions_HOTP2013base-2043.aspx
Place of residence
Forty-two percent of Napier’s population aged 65+ lived in the Taradale and Greenmeadows
areas at the time of the 2013 Census (Figure 8). About three quarters of Napier’s senior
population live more than 2.5 kilometres from the city centre; most live more than 4.5
kilometres from the centre.
Figure 8 - Percent of population aged 65+ by suburb, 2013
Source: 2013 Census of Population and Dwellings
12Figure 9 shows where seniors live in Napier. The orange and red areas have the highest
proportion of older people (over 60% of residents are aged 65+). These pockets of high
density reflect the locations of retirement villages.
Figure 9 - Distribution of population 65+ years, Napier, 2013
Source: 2013 Census of Population and Dwellings
13Population characteristics
Among those aged 65+, nine out of ten identified as European (92%) (Figure 10). A further
5% identified as Māori, 0.6% Pacific people, and 1.7% Asian. The ‘Other’ ethnic group
makes up another 2% (most people in this group identified New Zealander as one of their
ethnicities). Overall, Napier’s senior population is less ethnically diverse than both New
Zealand’s as a whole and the under 65s resident in Napier.
Napier residents aged 65+ identify with a range of ethnic groups.
Figure 10 - Ethnic groups of population aged 65+, Napier and New Zealand, 2013
Source: 2013 Census of Population and Dwellings
Note: People reporting more than one ethnic group were counted in each stated category.
Totals do not add to 100%.
Most Napier residents aged 65 and over live in private dwellings (95%) but the proportion
decreases with age – of those aged 85+, three quarters live in private dwellings (76%).
These levels are the same nationally.
Most Napier residents 65+ live in private dwellings and in couple only
households.
Just over half of the 65+ group who are in private dwellings, live in a couple only household
(54%) (Figure 11). A further one-third live alone (33%). This pattern is reversed among those
aged 85+.
14Figure 11 - Household composition for people living in occupied private dwellings by age group 65+, Napier, 2013
Source: 2013 Census of Population and Dwellings
Older Māori and Pacific residents are more likely to live in households containing either
multiple family/whānau members or several families. Napier Māori and Pacific people aged
65+ were three to four times more likely than others to live in dwellings with multiple
members from the same family/whānau (27% of Māori 65+ and 41% of Pacific people 65+,
compared to 10% of all 65+ year olds).
In addition, Pacific and Asian people aged 65+ were the most likely of all ethnic groups to
live in a multi-family/whānau household with more than one family (18% of Pacific and 13%
of Asian, compared to 1% of all 65+ year olds).
Māori and Pacific people in Napier were considerably less likely to live in a couple only
household (35% of Māori, 24% of Pacific, compared to 54% of all 65+ year olds).
Of those aged 65+ living in non-private dwellings, almost all were in residential care (97%).
This represents five percent of Napier’s population aged 65+. Of the 549 Napier residents
aged 65+ living in residential care:
62% were 85+
17% were 80-84
10% were 75-79
10% were 65-74.
Almost two-thirds of Napier residential care residents are aged 85+.
Sixty-three percent of people aged 65+ living in private dwelling households have access to
the internet (Figure 12). This compares to 82% of those aged 15-64.
15Figure 12 - Access to telecommunications in private dwellings 65+, Napier and New Zealand, 2013
Source: 2013 Census of Population and Dwellings
The proportion of people living in households who have access to the internet decreases
with age:
75% of 65-74 year olds
53% of 75-84 year olds
28% of 85+ year olds.
Household internet access decreases with age.
Access to the internet also varies by ethnicity. While older Pacific people have access levels
similar to all seniors in Napier (60%), Asians have higher access (66%), but older Māori
have lower levels of internet access – less than half, 47%.
Overall, access to a mobile phone is higher than internet access - 72% of over 65s living in
private dwelling households have access to a mobile phone. This is lower amongst the over
85s however – 37%. Mobile phone access is also slightly lower among over 65 Māori (67%)
but higher among Pacific people of the same age (80%).
While older Napier residents (including Pacific and Asian residents) have near-universal
access to a landline telephone (97%), this is lower amongst Māori at 90%.
In the week before the 2013 Census, one in five 65+ year olds (19%) were in full-time or
part-time employment (Figure 13). Slightly fewer older Napier residents work than nationally.
Across the three broad age groups within the 65s and over, there is a decline in the
percentage employed as people age. Nevertheless, a proportion of people from all three of
the age groups are in employment:
16 58% of people aged 65-74 are employed (31% full-time, 27% part-time)
13% of people 75-84 are employed (4% full-time, 9% part-time)
4% of people 85+ are employed (1% full-time, 3% part-time).
Figure 13 - Employment status 65+, Napier and New Zealand, 2013
Source: 2013 Census of Population and Dwellings
Older Māori were more likely to be in employment in the week before the Census (26%
compared to 19% overall) as were Pacific people (21%). Both were mainly in full-time work.
One in five older Napier residents work full-time or part-time - older Māori and
Pacific people were the most likely to be working.
National data indicates the number of older New Zealanders working is increasing over
time.5
People aged 65+ who were working in the week before the 2013 Census were most likely to
be employed as professionals (18%) or managers (16%). Almost equal proportions of
employed people aged 65+ were labourers (14%) or clerical/administrative workers (13%).
Māori and Pacific workers in Napier aged 65+ were more likely than average to be employed
as community and personal service workers (24% for Māori and 25% for Pacific people
compared to 10% for Napier over 65s) or labourers (21% for Māori and 25% for Pacific,
compared to 14%).
Older Napier residents received a lower personal income than residents of other ages
(Figure 14). Half of those 65+ had a personal income of between $15,000 and $30,000 in
5
Statistics New Zealand. 2015. 2013 Census QuickStats about people aged 65 and over.
17the 12 months prior to the 2013 Census. While one in five residents 65+ received between
zero and $15,000 in annual income, 24% received more than $30,000.
Figure 14 - Annual personal income by age group 65+, Napier, 2013
Source: 2013 Census of Population and Dwellings
Older Māori and Pacific people are more likely to have a lower personal income (30% of
older Māori and 35% of Pacific earnt up to $15,000 in 2013, compared to 20% of all those
over 65). Conversely, older Māori and Pacific people were less likely to earn between
$15,001 and $60,000 but were equally as likely to earn $60,001 or more.
Older Māori and Pacific people have the lowest annual incomes.
The median annual income nationally for people aged 65+ is $20,900.6 The most comment
sources of income are New Zealand superannuation or veterans pension, and interest,
dividends, rent or other investments.
Eight out of ten (80%) of Napier residents aged 65+ were involved in some form of unpaid
activity in the month before the 2013 Census. Two in 10 were not involved in any unpaid
activities.
The most common types of unpaid activities for over 65s (Figure 15) were:
Household work, cooking, repairs, gardening etc for own household (76%)
Other helping or voluntary work for or through any organisation, group or marae
(20%)
Looking after a child who does not live in own household (12%).
These rates are similar nationally.
6
Statistics New Zealand. 2015. 2013 Census QuickStats about people aged 65 and over.
18Figure 15 - Unpaid activities by age group 65+, Napier, 2013
Source: 2013 Census of Population and Dwellings
Napier women aged 65+ were slightly more likely than their male counterparts to help or do
voluntary work for an organisation, group or marae, and to look after children.
Many older Napier residents are involved in unpaid activities, with older women
being more likely than older men to do voluntary work for an organisation.
While residents aged 85+ are less likely to do unpaid work overall, a number volunteer for an
organisation, group or marae (7%) or look after others who are ill or have a disability (8%).
Overall, Māori and Pacific people aged 65+ were less likely to do unpaid activities, possibly
because they are more likely to be working. However, both Māori and Pacific people over 65
are more likely than average to look after a child who is a member of their household (10%
of Māori and 19% of Pacific people, compared to 4% of all over 65s).
Older Māori are less likely to do unpaid work overall, but are much more likely to
look after a tamariki who is a member of their whānau, or to be in full-time
employment.
People with Disabilities
In 2013, 56% of Napier residents aged 65+ identified they live with a disability (5,600
people). Disability rates increase with age - amongst those aged 80+, the rate was 76%.
Napier’s rates are similar to the overall New Zealand trend (Figure 16).
19Figure 16 - Disability rates by age group, Napier and New Zealand, 2013
Source: 2013 Census of Population and Dwellings
The most common disability identified by Napier over 65s was physical limitations7 (85%),
followed by a sensory disability - hearing (50%), vision (17%). Some people identified
multiple impairments.
People with disabilities aged 65+ make up just over a third of Napier’s total population living
with a disability (37%), compared to 33% nationally. The proportion is higher when looking at
the 55+ age group, which comprises over half of all people living with a disability in Napier
(53%). Napier’s ageing population means there will be an increasing proportion of people
experiencing disability in our community in the future.
Older Māori are more likely than non-Māori to have a disability, particularly Māori
men.
National survey data indicates that people with a disability are more likely than those without
to have lower incomes, no educational qualification, and be less likely to be employed.8
Older men and women are equally likely to have a disability, and older Māori are slightly
more likely than older non-Māori to have a disability (particularly so amongst Māori men).9
7
‘Physical’ includes both mobility and agility impairments (Statistics NZ definition).
8
Office for Disability Issues. Key Facts About Disability in New Zealand. http://www.odi.govt.nz/home/about-
disability/key-facts-about-disability-in-new-zealand/ Accessed 17 July 2018.
9
Statistics New Zealand. 2013 Disability Survey. Customised data.
20Injuries
New Zealand’s Accident Compensation Corporation received almost 5,800 new claims from
Napier residents aged 65+ for the 11 months from July 2017 to the end of May 2018.10 Over
half of these claims were lodged for older women (58%), a trend which has remained
consistent over time (Figure 17). The reverse is the case for those aged under 65, where
more claims are lodged for males (53%) than females. Four percent of all new claims lodged
by Napier’s over 65s, were from claimants identifying as Māori.
The number of new claims amongst older Napier residents is increasing over time, likely to
be driven by the growing ageing population.
Figure 17 - Number of new claims to ACC, 65+ by sex, Napier, financial years 2012/13-2017/18
Source: ACC data request
Injury locations differ markedly, but not unexpectedly, by age. Older Napier residents are
more likely than younger residents to be injured in the home or community environment
(93% compared to 64%, Figure 18). In contrast, younger residents are more likely than
seniors to be injured while playing sports, or working.
10
This figure is likely to increase once full financial year data become available.
21Figure 18 - Number of new claims to ACC, by age group and claim category, Napier, 2017/18
Source: ACC data request
ACC data shows claim frequency is rising fastest amongst seniors, mainly for falls in the
home which is the most common cause of injury amongst older people.11 Nationally, up to
60% of people aged over 65 experience a fall and many of these result in injury,
hospitalisation or sometimes death.12
Injuries in the home, mainly falls, are more common among older residents.
Falls account for almost two-thirds (59%) of new ACC claims amongst those aged 65 and
over in Napier (compared to 33% amongst the under 65s). Injuries where the largest number
of new claims were made by the over 65s include falls (59%), lifting/carrying/straining (11%),
gardening (9%), and steps and stairs (5%) (Figure 19). All of these occurred in the home
and community setting.
11
Accident Compensation Corporation. Annual Report 2017. Investing in New Zealanders. Wellington: New Zealand
Government.
12
Safe Communities Foundation NZ. 2016. Falls Injuries and Prevention. Fact Sheet 8.
22Figure 19 - Largest number of new claims to ACC by claim type, 65+, Napier, 2017/18
Source: ACC data request
The cost of claims among the over 65s living in Napier for falls alone is $3.13 million per
year. This the highest cost for any one injury, followed at a distance by treatment injuries at
$554,000 per year. Injuries associated with lifting/carrying/straining, gardening, steps and
stairs, and bicycling all cost over $200,000 each per year.
ACC has launched a nationwide injury prevention programme to reduce the number of falls
and to improve recovery from falls.13 This programme is coordinated locally by Enliven
Hawke’s Bay.14
Napier Social Monitor Survey
The Napier Social Monitor survey is commissioned by Napier City Council as part of the
Council’s Social Indicator Monitoring Programme. The survey has been undertaken since
1998.
A random sample of 400 Napier residents is contacted over the phone and online and asked
a number of questions about their current quality of life. The objectives of the Napier Social
Monitor are to establish:
Satisfaction with living in Napier
Nature of the community and community relationships
Opportunity to express views about the future direction of Napier City and New
Zealand
Perceptions of safety
Satisfaction with housing
Satisfaction with overall health and access to healthcare facilities
Perception of quality of life
Current employment, community work and volunteer work
13
https://www.livestronger.org.nz/ Accessed August 2018.
14
http://psec.org.nz/learn-more/enliven/ Accessed August 2018.
23 Involvement in education and training
Access to a car, smartphone, and the internet.
Information from the Social Monitor also informed development of the Positive Ageing
Strategy. Data presented here is from the 2017 Social Monitor comparing responses from
those aged 65+ (96 people) to those aged 55-64 (61 people) and all age groups as a whole.
In some instances, 2017 and 2014 data are compared (where available).
Many of the seniors surveyed for the 2017 Monitor have lived in Napier for more than 10
years (91%). Participants were from a range of suburbs. Slightly more older men than older
women responded (55% compared to 45%), and 14% of all older respondents identified as
Māori. The relatively small sample size means sub group analysis is only possible by age
group (55-64 and 65+).
Overall, the data indicates:
Seniors are reasonably positive about living in Napier, although the level of positivity
has declined slightly for a number of indicators since the 2014 survey.
Overall, seniors have high levels of perceived safety for themselves and
whānau/family living in Napier. Fewer however feel very safe compared to three
years ago.
Many of the seniors surveyed live in their own home, with the majority indicating
satisfaction with their current housing (regardless of whether they rent or own).
Seniors are generally positive about their current personal health, however higher
levels report poorer health than any other age group.
While seniors have higher interaction with social service groups, those undertaking
volunteer activities appear to be declining. This is the case across all age groups but
is especially noticeable amongst seniors.
A portion of seniors are still actively engaged in employment, and a portion are also
interested in further training and education.
One in five seniors don’t have access to the internet, indicating a reliance on other
forms of communication to source information. Internet access levels are likely to
increase in the future as 55-64 year olds (who have much higher internet use) age.
Napier community
Respondents were asked to rate how well the people of Napier take care of and provide for
each other. The majority of those aged 65+ (88%) view Napier as good, very good or
excellent as a caring community (compared to 85% of 55-64 year olds; 88% overall). A small
percentage of seniors rate Napier as poor or extremely poor (8.3%) (Figure 20).
24Figure 20 - How well Napier cares and provides for each other, by age group, 2017
Source: Napier Social Monitor, Napier City Council, 2017
Note: Totals may not add to 100% as ‘don’t know’ and ‘not specified’ responses not shown.
These results are slightly less positive than in 2014, when 90% of seniors felt Napier was
good, very good or excellent at being a caring community.
The survey asked if people used the service(s) of any social service organisation such as
Age Concern, St John Ambulance, RSA, Birthright, WINZ, Lifeline and so on. One in five
seniors (21%) use at least one social service organisation. This compares to 10% of those
aged 55-64 years, and 20% overall.
Compared to the previous survey, the proportion of those aged 65+ using a social service
organisation increased (from 15% in 2014 to 21% in 2017).
Twenty percent of seniors are a member of a voluntary social service group. In comparison,
16% of 55-64 year olds and 12% of all ages are members of such a group.
Community relationships
Respondents were asked to rate the current relationship between different ethnic groups in
Napier. Two-thirds of seniors (67%) rate the relationship as either very or fairly satisfactory.
This compares to 51% of 55-64 year olds and 57% overall (Figure 21).
Many seniors are positive about relationships between different ethnic groups
in Napier.
A further 17% of seniors rate the relationship as sometimes satisfactory and sometimes not.
An additional 9% rate it as not very satisfactory.
25Figure 21 - Views on current relationship between different ethnic groups in Napier, by age group, 2017
Source: Napier Social Monitor, Napier City Council, 2017
Note: Totals may not add to 100% as ‘don’t know’ and ‘not specified’ responses not shown.
These results are more positive than in 2014, when 48% of seniors perceived the
relationship between different ethnic groups in Napier as very or fairly satisfactory.
Views on future direction of Napier City
Respondents were asked how much opportunity they have to express their views about the
future direction of Napier. One in four seniors aged 65+ (42%) feel they have very little, no or
virtually no opportunity and 22% have just enough (Figure 22).
Seniors are more likely than any other age group however to say they have plenty or quite a
lot of opportunity to state their views about the future of Napier (34%, compared to 26% of
55-64 year olds and 30% overall).
Respondents aged 65+ who felt they had plenty or quite a lot of opportunity to express their
views increased slightly between 2014 and 2017 (from 32% to 34%).
Older people are more likely than other age groups to feel they have an
opportunity to express their views about the future direction of Napier.
26Figure 22 - Opportunity to express views about future direction of Napier, by age group, 2017
Source: Napier Social Monitor, Napier City Council, 2017
Note: Totals may not add to 100% as ‘don’t know’ and ‘not specified’ responses not shown.
Safety
Almost all respondents aged 65+ rate their feeling of safety in Napier for themselves and
other whānau/family members as average or better (97%) (Figure 23). Most give a rating of
very or fairly safe (77%) and a further 20% give a rating of average. Seniors are the most
likely age group to feel they and other whānau/family members in Napier are safe (77%,
compared to 66% of 55-64 year olds, and 69% of all ages surveyed)
Figure 23 - Feeling of safety in Napier, by age group, 2017
Source: Napier Social Monitor, Napier City Council, 2017
Note: Totals may not add to 100% as ‘don’t know’ and ‘not specified’ responses not shown.
2777% of older residents feel very or fairly safe in Napier.
Overall, views on personal safety amongst seniors are more positive than in 2014, but the
percentage feeling very safe is lower than it was three years ago (42% in 2014 down to 34%
in 2017).
Housing
Most survey respondents aged 65+ and 55-64, live in their own home (94% and 92%,
respectively). This compares to 83% of all age groups surveyed. Of the small proportion of
surveyed seniors renting, some say they are renting because that is their preferred choice,
and others because house prices are too expensive.
The proportion of people satisfied (very or fairly satisfied) with their current housing is 96%
among seniors, and 95% among 55-64 year olds (compared to 94% overall).
Health and wellbeing
Seniors are mostly happy with their current personal health, with 83% rating it as excellent,
very good or good (Figure 24). This is lower however than 55-64 year olds (92%) and all
ages (89%).
Almost one in ten seniors (9%) rate their personal health as poor and a further 7% as
extremely poor; the highest of all ages surveyed.
Figure 24 - Personal health rating, by age group, 2017
Source: Napier Social Monitor, Napier City Council, 2017
Note: Totals may not add to 100% as ‘don’t know’ and ‘not specified’ responses not shown.
People were asked if their quality of life had improved over the last five years. Over one-third
of seniors (39%) agree that it has improved, with 59% reporting no improvement (Figure 25).
Improved quality of life was reported by 51% of 55-64 year olds and 56% of all ages
surveyed.
28Slightly fewer seniors reported an improved quality of life during the past five years in the
2014 survey (34%).
Figure 25 - Quality of life improved during last five years, by age group, 2017
Source: Napier Social Monitor, Napier City Council, 2017
Note: Totals may not add to 100% as ‘don’t know’ and ‘not specified’ responses not shown.
Work, training, social services
Volunteer community work and other work
Over a quarter of seniors undertake regular volunteer community work (26%). This
compares to 25% of 55-64 year olds, and 28% of all ages surveyed. This figure for seniors
has decreased since the 2014 survey, when 37% reported they did regular volunteer
community work. A similar (but less obvious) trend was also the case for all other age
groups.
Just over one in ten seniors are in the workforce (3% work full-time, 8% work part-time). The
majority of the remainder (80%) are retired.
The majority of those aged 55-64 years are either in full-time (48%) or part-time (18%)
employment.
Training
Respondents were asked if they would consider some sort of education or training (beyond
high school level) in something that interests them. One in ten 65+ year olds indicated an
interest in future learning, compared to 53% of 55-64 year olds, and 55% of all ages
surveyed.
Communication, information
Seniors are more likely to have access to the internet than to a smartphone (Figure 26).
Eighty percent indicate they have access to the internet (compared to 98% of 55-64 year
olds, and 93% of all ages surveyed). This includes accessing the internet at home, work,
school, or in public spaces like the library.
29In comparison, 56% of seniors have access to a smartphone. This is lower than the 82% of
55-64 year olds, and 80% of all age groups surveyed.
Older residents are less likely to have access to a smart phone or the internet.
Figure 26 - Access to internet or smartphone, by age group, 2017
Source: Napier Social Monitor, Napier City Council, 2017
Note: Totals may not add to 100% as ‘don’t know’ and ‘not specified’ responses not shown.
Transport
Nine out of ten respondents aged 65+ have access to a car during the day (90%). Car
access is higher amongst those aged 55-64 years (97%) and all ages (93%).
30Napier Positive Ageing Strategy Survey
The Napier Positive Ageing Strategy Survey helped inform development of the Strategy, and
provided people with an opportunity to give their views about what would make Napier a
more age friendly city.
The survey was distributed both electronically and as hard copy between February and May
2018 through a number of avenues (as discussed earlier).
The survey asked for:
ideas for an age friendly Napier vision
feedback on the suggested priority areas
an indication of the most important priority areas
identification of any missing priority areas
views about what is currently working well and what could be improved in each
priority area.
Respondents to the survey were also given the opportunity to provide their name and
contact details if they were interested in providing feedback on the draft version of the
Strategy once developed.
Information collected in the survey not only assisted with informing development of the
Strategy, but will also be valuable for guiding the Strategy’s implementation plan.
Who responded
A total of 385 residents responded to the survey. While the survey is not necessarily
representative of Napier’s population, it provides valuable information from a cross-section
of residents, most of whom are aged 65+ years (81%, Figure 27).
Figure 27 - Age group of survey respondents, 2018
Source: Napier Positive Ageing Survey, Napier City Council, 2018
31Perspectives about ageing were provided by residents who have lived in Napier for
anywhere between less than 10 years (16%) to 40 or more years (39%) (Figure 28).
Figure 28 - Number of years resided in Napier, 2018
Source: Napier Positive Ageing Survey, Napier City Council, 2018
Almost three quarters of respondents were female (73%), 90% identified New Zealand
European as at least one of their ethnic groups, and seven percent as Māori. A further seven
percent identified at least one other ethnicity, including a Pacific ethnicity.
Seven percent of survey respondents identified as Māori, and a further seven
percent as another ethnicity (non-Māori, non-European).
Half of the survey respondents live in either Greenmeadows (25%) or Taradale (24%).
Responses were received from residents living in all of Napier’s suburbs (Figure 29).
32Figure 29 - Place of residence of survey respondents, 2018
Source: Napier Positive Ageing Survey, Napier City Council, 2018
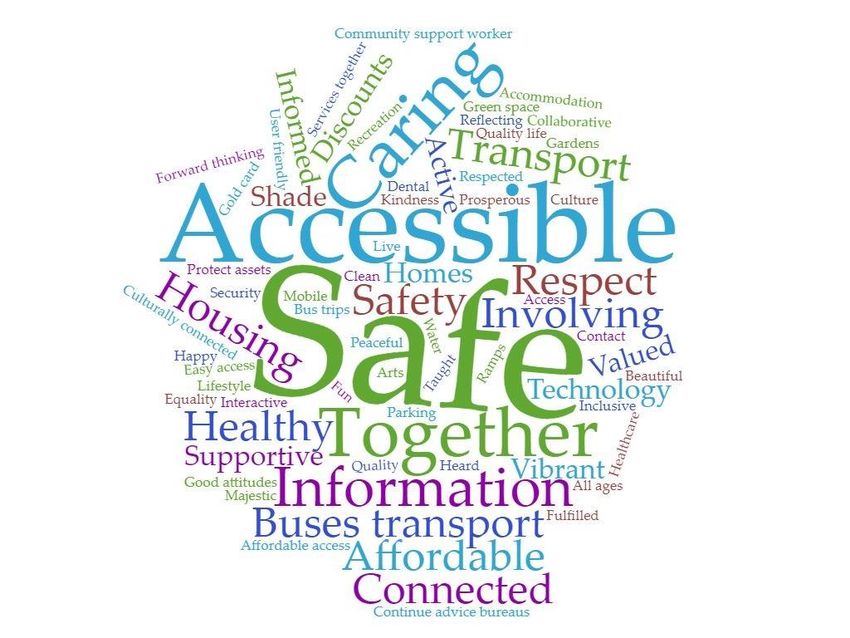
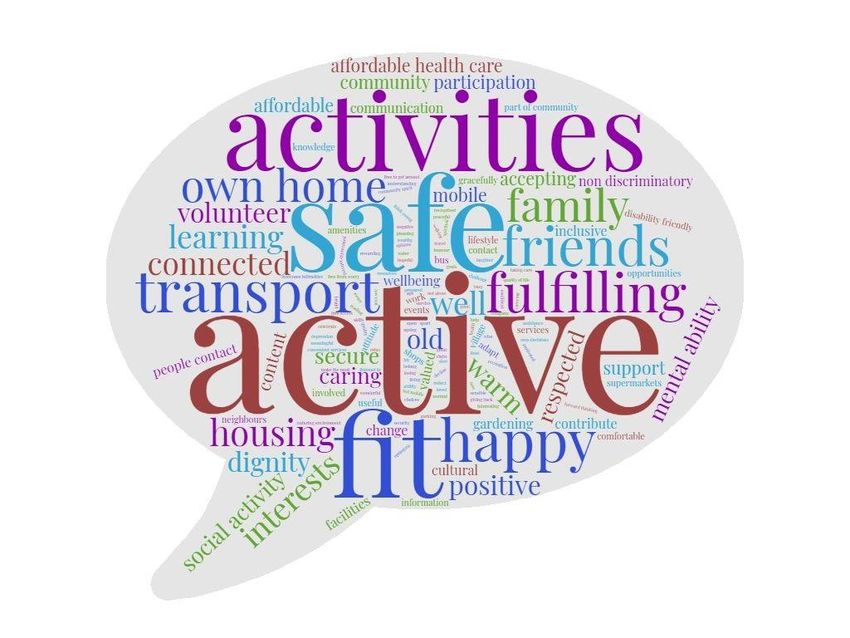
Meaning of ‘Positive Ageing’
The survey asked for peoples thoughts about the meaning of ‘positive ageing’. We received
a range of responses, with many people providing detailed feedback.
The responses are illustrated below in ‘word clouds’, where words and descriptions identified
more often are given greater prominence. Three word clouds are shown: one for
respondents aged 65 and over (Figure 30), a second for respondents of all ages identifying
as Māori (Figure 31), and a third for respondents aged under 65 (Figure 32).
There are commonalities across all three word clouds, and also some key differences:
all groups identify safety as an important part of positive ageing
having access to activities is also important to all
Māori and the younger age group were most likely to identify being healthy, while
the older cohort (65+) were more likely to mention being fit and active
Māori and the older age group mentioned transport and being happy as important
In addition, Māori interpret positive ageing as being financially secure and having
access to services and amenities
Older people (65+) view positive ageing as being fulfilling and involving friends and
family
Those under 65 years see positive ageing as a time to be valued and respected.
33Figure 30 - Views of ‘Positive Ageing’, survey respondents aged 65+, 2018
Source: Positive Ageing Survey, Napier City Council, 2018
34Figure 31 - Views of ‘Positive Ageing’, survey respondents identifying as Māori, 2018
Source: Positive Ageing Survey, Napier City Council, 2018
35Figure 32 - Views of ‘Positive Ageing’, survey respondents aged under 65, 2018
Source: Positive Ageing Survey, Napier City Council, 2018
Priority areas
Seven priority areas were identified during workshops and discussions with seniors,
agencies, and providers in the community. These were:
Being informed and involved
Being safe
Community spirit
Getting around
Health and wellbeing
Housing
Things to do.
The survey sought to determine the extent to which people agreed or disagreed with these
priority areas. An explanation of each priority was provided, and respondents were asked to
indicate if they agreed this should be a priority for the Positive Ageing Strategy.
The priority areas resonated with survey respondents with some small
differences for Māori and by age group.
Figure 33 shows the percent of respondents agreeing with each area. Overall the survey
findings indicate strong agreement with all seven of the identified priorities. Over 90% of
respondents agreed that the following are priority areas:
Being safe (98%)
36 Health and wellbeing (97%)
Community spirit (95%)
Getting around (95%)
Housing (93%).
Slightly fewer agreed that Things to do (90%) and Being informed and involved (87%) are
priority areas, however these proportions are still high.
Figure 33 - Percent of respondents saying ‘yes, this is a priority area’, all ages, 2018
Source: Positive Ageing Survey, Napier City Council, 2018
Respondents identifying as Māori were even more positive about the following priority areas:
Being safe (100%)
Getting around (100%)
Health and wellbeing (100%)
Being informed and involved (95%)
Community spirit (95%)
Things to do (95%).
Housing rated slightly lower among Māori than overall, with 90%.
Responses to the priority areas were slightly different amongst the various age groups
surveyed (Figure 34). Getting around was a higher priority amongst older people (65-74 and
75+) as was Health and wellbeing. Have things to do was of particular importance to 65-74
year olds, perhaps reflecting a recent or imminent retirement lifestyle change for some in this
age group.
37You can also read