INVESTMENT STRATEGY BRIEF: The 2020 Election, COVID-19, and a way forward - Stifel
←
→
Page content transcription
If your browser does not render page correctly, please read the page content below
November 16, 2020

                                          Insights from Stifel’s CIO Office

                                         INVESTMENT STRATEGY BRIEF:
                                         The 2020 Election, COVID-19, and a way forward

   Michael O’Keeffe, CFA      Nik Eftimov, CFA                 David Motsonelidze, CFA
   Chief Investment Officer   Senior Investment Strategist     Director of Macro Strategy
   Jared Brent                Brian Moody                      Sneha Jose
   Investment Strategist      Investment Strategist            Director of Behavioral Finance
INVESTMENT STRATEGY BRIEF                                                                       1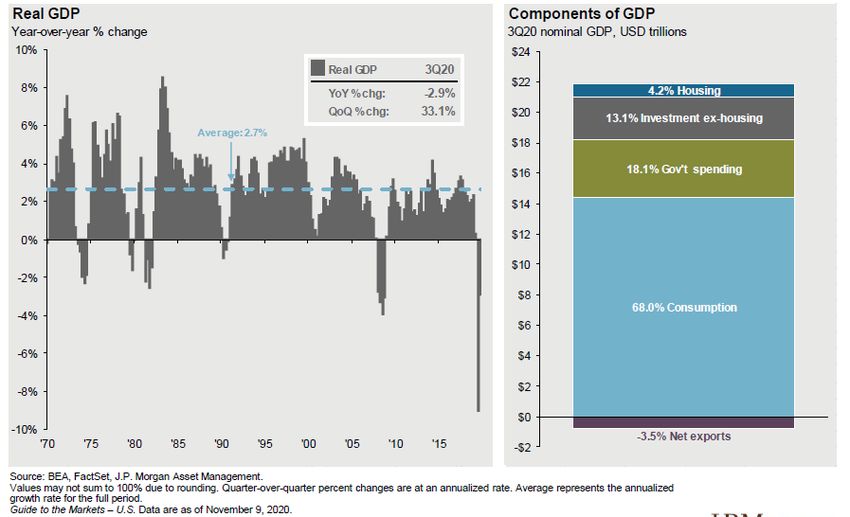
Table of Contents

                            The 2020 Election
                                 page 3
                            COVID-19 Update
                                page 9
                        Macro Environment
                             page 14
                                Markets
                                page 29
                              Our Outlook
                                page 42
                       Finding Our Guidance
                              page 46
INVESTMENT STRATEGY BRIEF                                           2
The 2020 Election INVESTMENT STRATEGY BRIEF 3
2020 Election
WHITE HOUSE                                                CONGRESS
                                                           ■ HOUSE OF REPRESENTATIVES

                                                              219 203
                                                                 Seats             Seats

                                                              233
                                                              Previously
                                                                                197
                                                                                Previously
                                                          13 seats haven’t been called yet by the
                                                          Associated Press
                                                           ■ SENATE

  Joe Biden – 290 Electoral College Votes
  Donald Trump – 232 Electoral Votes
                                                               46
                                                                Seats
                                                                                50Seats
 Georgia (16 votes) hasn’t been officially called yet
 by the Associated Press
                                                                46
                                                             Previously
                                                                                 53
                                                                                Previously
                                                        2 of the 35 seats up for election haven’t
                                                        been called yet by the Associated Press
INVESTMENT STRATEGY BRIEF                                                                           4
2020 Election
PRESIDENT TRUMP TRUMP BIDEN BIDEN
REPUBLICAN SENATE REPUBLICAN SENATE
CONGRESS REPUBLICAN DEMOCRAT
DEMOCRATIC HOUSE DEMOCRATIC HOUSE
A primary focus for the President and Congress under any scenario will be to ensure the economic recovery continues. The election outcome is that Joe Biden will be
President and we will likely have a split Congress. In this scenario while the size of the fiscal stimulus may not be as large as it would have been with a “sweep” by
either party, we would still expect additional fiscal stimulus by the end of the first quarter in 2021. This would be a positive for the U.S. economy and stock market.
Neutral/Modestly Positive Neutral Neutral/Modestly Positive
ECONOMY In the medium term, the extension of the Tax Cut In the medium term, both candidates have policies that could be In the medium term, increased spending
and Jobs Act (TCJA) or lower taxes would be supportive of the economy (Trump: lower taxes, deregulation; on healthcare, environment, and
positive for the economy. However, the Biden: increased spending), but also some that would inhibit growth infrastructure supportive for the overall
president's stance on trade with China and Europe (Trump: trade war; Biden: increased regulation, taxes). A split economy. Higher tax rates could temper
could temper growth. Budget deficit likely Congress may limit the scope of the legislative agenda. growth. Budget deficit likely increases.
increases.
Modestly Positive Neutral Neutral
A re-election of President Trump would be a Equity markets will be driven by traditional fundamentals such as The prospect for increased regulation and
referendum on his first term and a reduction in earnings and valuations. Geopolitics to remain a focus. Near term, at higher taxes will likely be a headwind. In
U.S. STOCK
uncertainty, a positive for markets. In the medium the sector level, healthcare and financials may face headwinds the near term a focus on increased
MARKET
term, lower taxes and regulation would be under a Biden Presidency and industrials and materials could be spending on infrastructure, healthcare,
supportive for profits, valuations, and thereby the impacted by a renewed trade war by Trump. and renewable energy will offset some of
stock market. these headwinds.
Treasury Rates Modestly Higher Neutral Treasury Rates Modestly Higher
An extension of the TCJA or lower taxes would lead The path for Treasury rates will depend largely on traditional Increased spending to fund healthcare
to higher rates. A renewed trade war or fundamentals such as the state of the U.S. economy and inflation and other initiatives to provide an upward
RATES/
geopolitical flare-up could limit the move higher. expectations. Both candidates are campaigning on platforms that bias for rates. Increased regulation may
BONDS
Rates are also likely to be anchored by continued could pressure rates one way or the other, depending on which limit the move higher.
supportive monetary policy. policy they choose to pursue in their first 100 days in office.
However, we don’t foresee rates moving significantly higher.
Source : Stifel Investment Strategy
INVESTMENT STRATEGY BRIEF 52020 Election
Preliminary Observations
• Markets anticipated a “Blue Wave:”
Large fiscal support with public spending:
Infrastructure, environment, and renewable energy
The prospect for inflation, rising rates, and steeper curve
Market leadership rotation
• But Senate majority likely Republican, so a “divided government”
Smaller scale fiscal package
Rates remain in a trading range, lower for longer
Need for yield enhancement opportunities
Possible headwind for financials
Tax increases less likely
Under Biden, increased non-legislative regulation (rules) and evolving trade policy
On trade, more unilateral, transparent, and predictable
Anti-Trust will be in focus
• Investors will refocus on other fundamentals & COVID
Focus will continue on earnings
Timing for vaccine announcement and approval, pricing in good news
If a client has de-risked portfolio, take advantage of volatility to rebuild risk exposure
Can include “quality” oriented investments in equities and bonds
INVESTMENT STRATEGY BRIEF 62020 Election
Prediction Market Probabilities on
Market Response
Democratic Control
Source: Stifel Investment Strategy via Strategas Research Partners, Bloomberg and Predictit, as of November 13, 2020
INVESTMENT STRATEGY BRIEF 72020 Election
Average S&P 500 Performance Following Change in White House Party
S&P 500 (Data Since 1950)
May August
January
July
October
March
Source: Stifel Investment Strategy via Strategas Research Partners, as of November 10, 2020
INVESTMENT STRATEGY BRIEF 8COVID-19 Update INVESTMENT STRATEGY BRIEF 9
Coronavirus Dashboard

Source: Stifel Investment Strategy via Bloomberg, as of November 15, 2020
INVESTMENT STRATEGY BRIEF                                                                           10
Coronavirus Dashboard

Source: Stifel Investment Strategy via COVID-19 Tracking Project, as of November 15, 2020
INVESTMENT STRATEGY BRIEF                                                                                  11
Coronavirus Dashboard

Source: Stifel Investment Strategy via Bloomberg, as of November 15, 2020
INVESTMENT STRATEGY BRIEF                                                                           12
Look Through to the Other Side: Medical Research
   • Genome sequencing - in less than 10 days mapped the COVID-19 DNA
   • Currently 219 companies pursuing vaccines

     Coronavirus Vaccine Tracker
        PRECLINICAL               PHASE 1               PHASE II               PHASE III             APPROVAL

            150+                       36                     15                    12                        6
       Vaccines not yet in     Vaccines testing     Vaccines in expanded     Vaccines in large-    Vaccine approved
          human trials        safety and dosage         safety trials       scale efficacy tests    for limited use in
                                (Small Group)          (100-1,000’s)        (10,000 – 60,000)      China, Russia, and
                                                                                                           UAE
   • Phase II typically take 2-3 years – but for COVID-19, it is expected to take 8 months
   • 5 of 6 companies in operation Warp Speed have agreements to deliver 400 million doses to the U.S. government
           • Pfizer and Moderna plan to file for Emergency Use Authorization (E.U.A.) with the FDA following
             preliminary phase III efficacy rates of 90% and 94.5%, respectively
   • Vaccine for broader distribution possibly available in 2021
   • 319 companies are pursuing treatments: purpose specific vs. designed for other diseases
           • 214 are now in clinical testing – 35 are in Phase III, 95 are in Phase II, and 52 are in Phase I
                  • Gilead Sciences’ antiviral drug Remdesivir received E.U.A. for patients requiring hospitalization
                  • Eli Lilly’s antibody therapy Bamlanivimab received E.U.A. for treatment of mild-moderate COVID-19
                    cases
Source: Stifel Investment Strategy data via Milken Institute and New York Times, as of November 16, 2020
INVESTMENT STRATEGY BRIEF                                                                                                13
Macro Environment INVESTMENT STRATEGY BRIEF 14
Introduction: Macro, Markets, and Themes
MACRO                                          MARKETS                                    THEMES
U.S. Economy                                   Market Environment                         Mega Themes
• Q3 2020 GDP at 33.1%                         • Increased volatility                     • Productive Competition
• Peaking jobless claims                       • Modestly higher returns forward          • Fourth Industrial Revolution
• Declining unemployment rate                  • Exited bear market                          …and Globalism
• Non-farm Payrolls 2.8 million (rolling 3-                                               • Shifting Demographics
  month total)                                 Equity Market
                                                                                             …and Millennials
• Wage Growth, 4.5%                            • Earnings growth recovering, valuations
                                                                                          • Geopolitical Tensions
• Inflation higher, 1.6% (Core CPI)              picking up
                                                                                             …and Protectionism
• V-shaped recovery                            • Longer-term driven by fundamentals
                                                                                          • Managing through economic recovery
• President executive orders                   • Market is up 61% since its low

Central Bank Activity                          Bond Market
• Carefully rebuilt the tools                  • Rates rose, curve steepened, 10Y 3M no   Potential Headwinds
• Dovish global central banks                    longer inverted                          • Coronavirus pandemic
• Global M2 increasing                         • Household credit rising but remains      • Inflation and price pressures picking
• Federal Reserve (Fed) – unprecedented          modest relative to GDP                     up faster than expected
  measures                                     • Stretched corporate credit no longer     • Slower U.S. GDP growth
• Expanding balance sheet                        under pressure                           • Trade and tariff tensions
                                               Foreign Exchange & Commodities             • Heightened geopolitical risks (UK,
Global Economy                                                                              Europe, Iran)
• Global manufacturing reaching pre-           • Dollar (DXY) down 3.7% YTD on rate
  COVID levels                                   differentials and improving data         Existing Tailwinds
• Supportive Global Fiscal Policy              • Gold up 24.8% YTD to $1,893              • Massive monetary support
• Asia ex Japan GDP, 5.3% in 2019              • Oil (WTI) down 34.2% YTD on              • Historic fiscal support
• Japan Real GDP, 0.7% in 2019                   geopolitical tensions and Coronavirus    • Started crisis with a strong economy
• Europe core stronger than periphery                                                     • Moderna’s and Pfizer’s drugs are
                                                                                            showing some hopes
Geopolitical Events                                                                       • May have hit a pandemic peak in
• Protectionism and trade                                                                   some hot spots
• 2020 Presidential Election
• Gulf tensions
• China, Russia, Middle East, North Korea
Source: Stifel Investment Strategy data via Bloomberg, as of November 13, 2020
INVESTMENT STRATEGY BRIEF                                                                                                      15
Unprecedented Policy Response
Monetary Policy
• $2.3 trillion program to support the economy
• Federal Reserve (Fed) has been expanding its balance sheet by buying:
Investment Grade Collateralized Loan Obligations (CLOs), Commercial Mortgage-Backed
Securities (CMBS), Investment Grade and High Yield Corporate Bonds, Treasury Securities
• The Fed is signaling continued monetary policy support as they expect the recovery to come in 2021
Fiscal Policy
• $2.3 trillion Coronavirus Aid, Relief, and Economic Security Act Program (CARES)
• $484 billion Stimulus Package
• The question going forward: The timing and size of the next stimulus package?
President’s Executive Orders
• Defer payroll taxes for those earning less than $100,000 a year
• Defer student loan payments
• Discourage evictions
• Extend enhanced unemployment benefits - $400 per week
$300 a week to be supplied by the Federal Government
$100 a week provided by state (optional)
Source: Stifel Investment Strategy via Bloomberg, as of November 11, 2020
INVESTMENT STRATEGY BRIEF 16Macro Environment: The Consumer
The Consumer
Redbook Ret. Sales 1.1 Personal Income (%) 0.9 Pers. Spending (%) 1.4
long term 1 year long term 1 year long term 1 year
Very Positive
Year over year change Based on a 3-month moving average Based on a 3-month moving average
Retail Sales (YoY) 5.4 Avg. Hrly. Earnings 4.5 Unemploym. Rate (%) 6.9
Neutral
long term 1 year long term 1 year long term 1 year
Based on a 3-month moving average Year-over-year change
Consumer Confidence 100.9 Nonfarm Payrolls ('000) 638 Consumer Credit 4.7
Very Negative
long term 1 year long term 1 year long term 1 year
Annual rate
Source: Stifel Investment Strategy via Bloomberg, as of November 13, 2020
INVESTMENT STRATEGY BRIEF 17Macro Environment: Housing
Housing
NAHB Home Builder's 85.0 Mortg. Apps (%) 3.8 Pend. Home Sales (%) (2.2)
long term 1 year long term 1 year long term 1 year Very Positive
Based on 26-week moving average Based on a 3-month moving average
CS Home Prices (%) 5.7 Exist. Home Sales (%) 9.4 New Home Sales (%) (3.5)
Neutral
long term 1 year long term 1 year long term 1 year
Based on 3-month moving average Based on 6-month moving average
Housing Starts ('000) 1415.0 Building Permits ('000) 1545.0
Very Negative
long term 1 year long term 1 year
Source: Stifel Investment Strategy via Bloomberg, as of November 13, 2020
INVESTMENT STRATEGY BRIEF 18Macro Environment: Business
Business
NFIB Small Bus. Opt. 104.0 Bus. Inventories (YoY) (5.5) Truck Ship. (YoY %) 8.4
long term 1 year long term 1 year long term 1 year
Based on a 3-month moving average
Markit Comp. PMI 56.3 Markit Manufac. PMI 53.4 Markit Services PMI 56.9
Very Positive
long term 1 year long term 1 year long term 1 year
ISM Manuf. 59.3 ISM Nonmanufact. 56.6 Chicago PMI 61.1
Neutral
long term 1 year long term 1 year long term 1 year
Core Capex Orders 1.0 Factory Orders 1.1 Constr. Spending (%) 0.3
Very Negative
long term 1 year long term 1 year long term 1 year
Based on a 3-month moving average Based on a 3-month moving average Based on a 3-month moving average
Nonres. Spending 20.3 Wholesale Inventories 0.4 Durable Goods Orders 1.9
long term 8 quarters long term 1 year long term 1 year
Based on a 3-month moving average Based on a 3-month moving average
Source: Stifel Investment Strategy via Bloomberg, as of November 13, 2020
INVESTMENT STRATEGY BRIEF 19Macro Environment: Business Bloomberg Corporate Bankruptcy Index The Bloomberg Corporate Bankruptcy Index measures both the occurrence and severity of current and recent U.S. bankruptcy activity for corporations with at least $100 million in reported liabilities. The index is a barometer of bankruptcy activity that equally considers the number of bankruptcies and the U.S. dollar amount of liabilities relative to their 2000 to 2012 medians which are set at 100. Source: Stifel Investment Strategy data via Bloomberg, as of November 13, 2020 INVESTMENT STRATEGY BRIEF 20
Macro Environment: Business
  Business
         Number of S&P 500 Companies Cut or Suspended Dividends

• Following the initial burst of companies cutting/suspending dividends to preserve cash flow, this has
  stabilized in recent months
• Companies with sound long-term fundamentals are likely to reinstate their dividends as we get past
  the COVID-19 related macro shock
    Source: Stifel Investment Strategy data via Strategas Research Partners, as of November 13, 2020
   INVESTMENT STRATEGY BRIEF                                                                              21
Macro Environment: Inflation
Inflation
Core Inflation (CPI) 1.6 Inflation (CPI) 1.2 Inflation (PCE) 1.4
long term 1 year long term 1 year long term 1 year
Very Positive
Core Inflation (PPI) 1.1 Inflation (PPI) 0.5 Core Inflation (PCE) 1.5
Neutral
long term 1 year long term 1 year long term 1 year
Trimmed Inflation 0.9
Very Negative
long term 1 year
All Inflation numbers reflect percent year-over-year changes.
Source: Stifel Investment Strategy via Bloomberg, as of November 13, 2020
INVESTMENT STRATEGY BRIEF 22Coronavirus Dashboard
Indicator Pre-Outbreak 2020 Low Current Description
Timely measure representing about 9,000 stores that gives us an
Redbook Retail Sales (%) 5.0 -9.7 1.1 indication of consumer spending
Timely measure that tracks the number of individuals who have filed for
Jobless Claims (thousands) 216.3 6867.0 709.0 jobless claims for the first time
A composite economic indicator consisting of key metrics that lead the
Leading Economic Indicators YoY (%) 0.9 -13.0 -3.9 economic cycle
A measure of how well economic data is faring relative to consensus
Global Economic Surprise Index 5.8 -79.1 59.8 expectations
Bloomberg Consensus 2020 World Real GDP (%) 3.1 -3.9 -3.9 Economist survey estimate of global real GDP
IMF 2020 World Real GDP (%) 3.4 -4.9 -4.4 IMF estimate of global real GDP
Bloomberg Consensus 2020 U.S. Real GDP (%) 1.9 -5.7 -3.9 Economist survey estimate of U.S. real GDP
ISM New Orders - Manufacturing 52.0 27.1 67.9 One of the key leading economic indicators
Global Money Supply ($ trillions) 80.9 79.2 92.6 A measure of global liquidity showing the state of monetary policy
Global central banks and governments have taken unprecedented
Monetary/Fiscal support
stimulative measures to support the global economy
Federal Reserve Bank of New York Weekly
Economic Index (WEI)
2.0 -11.5 -2.7 An index designed to provide a signal on the state of the U.S. economy
Forward-looking consumer view of both present and expected economic
U. of Michigan Consumer Confidence 99.8 71.8 77.0 conditions
Forward-looking consumer view of both present and expected economic
Conference Board Consumer Confidence 130.4 85.7 100.9 conditions
NAHB Housing Market Index 75.0 30.0 85.0 Homebuilders' confidence - a good proxy of future housing activity
U.S. Empire State Manufacturing Index 4.8 -78.2 10.5 How businesses feel about the economy in the state of New York
Dallas Fed Manufacturing Index -0.2 -74.0 19.8 How businesses feel about the economy in the state of Texas
How businesses feel about the economy in the states of Pennsylvania,
Philadelphia Fed Manufacturing Index 17.0 -56.6 32.3 New Jersey, and Delaware
Timely survey (bi-monthly) which gives a real-time view of the
Markit Manufacturing PMI 51.9 36.1 53.4 manufacturing sector, covering all-sized U.S. companies
Timely monthly survey which gives a real-time view of the
ISM Manufacturing PMI 50.9 41.5 59.3 manufacturing sector, covering large-sized U.S. companies.
Markit Services PMI 53.4 26.7 56.9 A timely measure to gauge service sector activity
ISM Services PMI 55.5 41.8 56.6 A timely measure to gauge service sector activity
Source: Stifel Investment Strategy via Bloomberg, Goldman Sachs, the COVID Tracking Project, OpenTable, Flightradar24, as of November 13, 2020
INVESTMENT STRATEGY BRIEF implies current reading close to or greater than pre-outbreak level
23Coronavirus Dashboard implies current reading close to or greater than pre-outbreak level Source: Stifel Investment Strategy via Bloomberg, Goldman Sachs, the COVID Tracking Project, OpenTable, Flightradar24, as of November 13, 2020 INVESTMENT STRATEGY BRIEF 24
Macro Environment: Economy

INVESTMENT STRATEGY BRIEF                                25
Macro Environment: Labor Market
Labor Market

                               100.9                                               5.4%
                     Conference Board                                             Retail Sales
                    Consumer Confidence                                    (as of September 30, 2020)
                    (as of October 31, 2020)

                          709,000                                             Over   6.9%
                                                                                        44
                          Jobless Claims                                     Unemployment Rate
                   (as of November 6, 2020)                                   million*
                                                                             (as of October 31, 2020)
                                                                             Jobless Claims

Source: Stifel Investment Strategy data via Bloomberg, as of November 13, 2020
INVESTMENT STRATEGY BRIEF                                                                               26
Macro Environment: Fed Monitoring
Fed Monitoring
2.17
755.3
1.54
0.46
3.51
5-year, 5-year forward inflation swap rate is a measure of expected inflation (on average) over the five-year period that begins five years from today.
Initial Jobless Claims measures the number of individuals who filed for unemployment insurance for the first time during the past week.
Atlanta Fed GDP Now is a running estimate of GDP growth based on available data for current quarter.
Bloomberg Financial Conditions Index tracks the overall stress in the U.S. money market, bond market, and equity market and provides a useful gauge
to assess the availability and cost of credit in the U.S. financial market.
Source: Stifel Investment Strategy data via Bloomberg, as of November 13, 2020
INVESTMENT STRATEGY BRIEF 27Macro Environment: GDP Survey
U.S. GDP Q1 2020 Q2 2020 Q3 2020 Q4 2020 2020* 2021*
Consensus Estimates -5.0 -31.4 33.1 4.0 -3.9 3.8
Stifel** -2.6 -28.4 18.0 1.1 -0.5 2.5
IHS Markit 3.0 -35.5 33.2 3.7 -3.6 3.1
Goldman Sachs -9.0 -33.0 35.0 3.0 -3.4 5.8
Pantheon Macro -6.0 -30.0 35.0 5.0 -3.5 5.0
Capital Economics -3.5 -30.0 30.0 4.5 -3.7 4.5
Strategas 0.0 -33.0 25.0 5.0 -3.5 5.0
Julius Baer -4.0 -25.0 29.5 2.0 -3.7 3.5
UBS -5.1 -31.7 29.7 2.8 -3.6 3.6
Wells Fargo -1.2 -36.8 28.6 6.1 -3.5 4.2
Bloomberg Economics 3.0 -37.0 28.0 2.5 -4.2 2.6
Barclays
TD Bank
3.1% -1.5
-1.9
-31.7
-33.4
30.0
29.8
5.0
2.8
-3.5
-4.0
4.5
3.4
Hourly Earnings YoY
JPMorgan Chase -10.0 -32.9 34.5 3.0 -3.6 2.8
Bank of America Merrill Lynch -7.0 -35.0 33.0 3.0 -3.6 4.5
Federal Reserve -3.7 4.0
*Annualized percent change from prior quarter and year-over-year change are shown for quarterly and yearly periods, respectively.
**Based on Stifel sell-side Economics department estimates.
Source: Stifel Investment Strategy data via Bloomberg, as of November 10, 2020
INVESTMENT STRATEGY BRIEF 28Markets INVESTMENT STRATEGY BRIEF 29
Introduction: Equity Performance
Performance
                                                              2019

                                                              2020

Source: Stifel Investment Strategy data via Bloomberg, as of November 13, 2020

INVESTMENT STRATEGY BRIEF                                                                        30
Past Market Declines
The right hand side of the chart below shows the returns of the S&P 500
over the subsequent 12 months. The green bars refer to periods of full
recovery within that time.
279 mths
3 mths
7 mths
58 mths
12 mths
6 mths Months to
11 mths
15 mths recovery
7 mths
22 mths
81 mths
17 mths
3 mths
19 mths
4 mths
55 mths
48 mths
4 mths
4 mths
5 mths
Source: Stifel Investment Strategy via Bloomberg, as of November 13, 2020
Each market decline reflects a decline of at least 15% in the S&P 500’s index value, without dividends reinvested.
INVESTMENT STRATEGY BRIEF 31Past Epidemics
Outbreak Year (s) Impact on Countries # of Deaths # of Infections Mortality Rate Contagiousness*
COVID-19 2019- Global 1,303,651 53,387,477 2.44% 1.5-3.5
Swine Flu 2009-2010 Global 150,000-300,000 60.8 million 0.03% 1.5
SARS 2003-2004 China and 26 others 800 8,000 10% 3.0
Hong Kong Flu 1968-1970 SEA, USA, Europe 1-4 million N/A** 0.20% 2.0
Asian Flu 1957-1958 China, USA, Europe 1-2 million N/A** 0.20% 1.8
Spanish Flu 1918-1919 Global 25 million 500 million 5% 2.0
MSCI All Country World Index
(Net Total Return) COVID-19
Coronavirus
Zika
Ebola
MERS
Coronavirus
Avian Flu
Swine Flu
SARS
Source: Stifel Investment Strategy via Bloomberg, Boston Consulting Group, Bridgewater Associates, National Health Commission China, American Journal of
Epidemiology, U.S. National Library of Medicine, BCG Henderson Institute Analysis, CDC, John Hopkins University, as of November 13, 2020
*Average number of persons infected by each sick individual at the peak of transmission based on Boston Consulting Group study. **not available.
INVESTMENT STRATEGY BRIEF 32Market Cycles Bull and Bear Markets Since 1932 Source: Stifel Investment Strategy data via Bloomberg, Strategas Research Partners, as of November 13, 2020 INVESTMENT STRATEGY BRIEF 33
Coronavirus: Market Reaction

• The index has significant exposure to the companies that specialize in providing products that focus
  on the ability to work from home.

    Source: Stifel Investment Strategy data via Bloomberg, as of November 13, 2020
   INVESTMENT STRATEGY BRIEF                                                                               34
Equity Market Valuations Source: Stifel Investment Strategy via Bloomberg, as of November 13, 2020 Source: Stifel Investment Strategy via Bloomberg, as of November 13, 2020 INVESTMENT STRATEGY BRIEF 35
Market Monitor: Fixed Income vs Equities

Source: Stifel Investment Strategy data via Bloomberg, as of November 13, 2020
INVESTMENT STRATEGY BRIEF                                                                 36
Market Monitor: Equities
Earnings Season Update
                                                   S&P 500 Earnings Growth

Source: Stifel Investment Strategy via FactSet, as of November 13, 2020; Current 3rd Quarter 2020 earnings growth is the blended rate
(combines actual results for companies that have reported and estimated results for companies that have yet to report). Earnings growth
estimates for the rest represent consensus forecasts.
INVESTMENT STRATEGY BRIEF                                                                                                                 37
Market Monitor: Equities
S&P 500 Q3 EPS
-7.9%
Source: Stifel Investment Strategy data via Factset, as of November 13, 2020
INVESTMENT STRATEGY BRIEF 38Market Monitor: Equities
S&P 500 Earnings Season
Percent of S&P 500 Companies Beating Earnings Estimates By Quarter
84%
65%
Source: Stifel Investment Strategy data via Strategas Research Partners, as of November 13, 2020
INVESTMENT STRATEGY BRIEF 39Market Monitor: Equities
S&P 500 Earnings Season
Earnings Surprise Factor for S&P 500
19%
3.5%
Source: Stifel Investment Strategy data via Strategas Research Partners, as of November 13, 2020
INVESTMENT STRATEGY BRIEF 40Market Monitor: U.S. Fixed Income Rates and Spreads OAS Spread is the measurement of the spread of a fixed-income security rate and the risk-free rate of return, which is adjusted to take into account an embedded option Source: Stifel Investment Strategy data via Bloomberg, as of November 13, 2020 INVESTMENT STRATEGY BRIEF 41
Our Outlook

INVESTMENT STRATEGY BRIEF                 42
Asset Allocation

INVESTMENT STRATEGY BRIEF                      43
Dynamic Asset Allocation
               Asset Class         Previous    Current                                                    Comments

                                                         Our base case assumes that the recovery which started in the second half of 2020 continues in 2021, supported
            U.S. Equity               ■          ■       by fiscal and monetary stimulus, measured reopening of the economy, and vaccine availability. Markets, however,
                                                         have to a good degree priced in this scenario. Dynamically, we remain neutral to our long-term strategic asset
                                                         allocation.
                                                         Smaller businesses, or those in weaker financial condition, have suffered, and some have gone out of
            U.S. Large Cap            ■          ▼       business as a result of the COVID-19 shutdowns. Risks still remain, but we are more upbeat looking forward
                                                         as the improving economic data suggests that the economy may be regaining ground.

                                                         The large cap value segment of the market has underperformed large cap growth as many of the underlying
               Large Value vs.                           companies were more impacted by the COVID lockdowns and social distancing measures. Now that the
                                      ■          ▲       uncertainty of the election is largely behind us and an effective vaccine seems likely, value stocks are poised
               Large Growth
                                                         to outperform as the economic recovery continues and we embark on a path to some resemblance of normal.

                                                         Smaller businesses, or those in weaker financial condition, have suffered, and some have gone out of
            U.S. Small Cap            ■          ▲       business as a result of the COVID-19 shutdowns. Risks still remain, but we are more upbeat looking forward
                                                         as the improving economic data suggests that the economy may be regaining ground.

               Small Value vs.                           We recommend a diversified approach, investing in both small cap value and growth.
               Small Growth           ■          ■
Equity
                                                         Much of the developed world and some emerging market countries are in the midst of a second or third wave
                                                         of coronavirus cases. This has led to renewed national lockdowns and slowing economic growth. Some of
             Non-U.S. Equity          ■          ■       these regions had weaker economic growth and more limited monetary policy tools going into the crisis. The
                                                         easing of these restrictions, a widely available vaccine, and the cooling of trade rhetoric would cause us to
                                                         revisit our dynamic leanings.
            Non-U.S.
                                                         We are neutral within non-U.S. equity between developed and emerging markets as we find the risks to be
            Developed                 ■          ■       balanced between both.
            Markets

                                                         European countries are seeing a resurgence, with new record infections forcing many of the larger economies
               Europevs.                                 to impose renewed lockdowns. This is weighing on the economic recovery. Japan approved a $1 trillion
                                      ■          ■
               Asia                                      stimulus package earlier in the year as we see economic activity restarting, but the country had negative GDP
                                                         growth going into the crisis due to the increased consumption tax rate.

                                                         Risks are balanced. A weaker dollar and the reopening of China’s economy should support emerging countries.
            Emerging Markets          ■          ■       However, weaker healthcare systems and low oil prices represent headwinds for some emerging economies. Note,
                                                         within non-U.S. equity, we are neutralbetween non-U.S. developed markets and emerging markets.

         Overweight              Underweight              Neutral
                                                                          Our U.S. Large Cap Equity guidance is based on the Russell 1000 Index which includes the
                                                                          Russell Top 200 and Russell Midcap Indices.
 INVESTMENT STRATEGY BRIEF                                                                                                                                              44
Dynamic Asset Allocation
Asset Class Previous Current Comments
Within fixed income, we are neutral between U.S. investment grade and U.S. high yield.
U.S. Investment Grade ■ ■
Corporates
Government/Agency We recommend a diversified approach to the full spectrum of investment-grade fixed
■ ■ income.
MBS
Inflation should remain in check in the near term as the economy starts to recover. Longer
Fixed Inflation Protected term, there is the potential for inflation to rise. The Federal Reserve (Fed) has revised its
Income
■ ■ policy framework to allow for inflation to be above 2% for extended periods of time.
The Fed is expected to stay accommodative for the foreseeable future, and while interest
Duration rates will likely move higher as the economy recovers, we don’t anticipate rates rising
■ ■ significantly. We believe we are in a lower for longer environment and remain neutral
duration.
Spreads have narrowed, and the risk of default is slowly easing. Note, within fixed income,
U.S. High Yield
■ ■ we are neutral between U.S. investment grade and U.S. high yield.
For investors interested in alternative investments and able to handle illiquidity, exposure to
Private Assets
■ ■ some combination of private equity, private debt, and/or private real estate can be
considered as part of a diversified portfolio.
Alternatives For investors interested in alternative investments and able to handle less liquidity who
Hedge Funds have conviction about manager skill, exposure to hedge funds can be a helpful part of a
■ ■ diversified portfolio. This is especially true in volatile, low-return environments.
Overweight Underweight Neutral
INVESTMENT STRATEGY BRIEF 45Finding Our Guidance INVESTMENT STRATEGY BRIEF 46
Stifel Guidance

The following summarizes how we deliver our economic and market analysis and corresponding
investment guidance, along with some helpful links.

    • Each day we broadcast Stifel Investor Insights on iHeartRadio.
    • Sight|Lines is a weekly note for clients, along with a video summary and a podcast on
      Spotify, Apple, Omny, and Google.
    • Market Pulse is shared when the S&P 500 Index moves up or down 2%.
    • The monthly Investment Strategy Brief video series shares our update on the current
      economic and market environment. The podcast: Spotify, Apple, Omny, and Google.
    • The weekly, monthly, and quarterly Market Perspectives provide a recap of the most
      recent period’s global market results.
    • The monthly Favorite 15 shares our favorite 15 slides for the month.
    • Stifel’s Allocation Insights provides our dynamic asset allocation leanings quarterly.
    • The Stifel Outlook: provides our annual outlook and related articles.
    • Stifel's Approach to Asset Allocation summarizes our asset allocation approach and
      provides a catalogue of various recommended asset mix models.
    • The Stifel Financial ID video series provides an overview of our work in behavioral
      finance and the related Stifel Financial ID model.

INVESTMENT STRATEGY BRIEF                                                                      47
Appendix: Disclosures Indices are unmanaged, do not reflect fees and expenses, and are not available for direct investment. Past performance does not guarantee future results. Investing involves risk, including the possible loss of principal. Asset allocation and diversification do not ensure a profit or protection against loss. Alternative Investments or Non-Traditional Assets – Alternative investments may include, but are not limited to: Real Estate Investment Trusts (REITs), Commodities, Futures, Hedge Funds, Venture Capital, Limited Partnerships, etc. Real Estate – When investing in real estate companies, property values can fall due to environmental, economic, or other reasons, and changes in interest rates can negatively impact the performance. Commodities and Futures – The risk of loss in trading commodities and futures can be substantial. You should therefore carefully consider whether such trading is suitable for you in light of your financial condition. The high degree of leverage that is often obtainable in commodity trading can work against you as well as for you. The use of leverage can lead to large losses as well as gains. Hedge Funds – Investors should be aware that hedge funds often engage in leverage, short-selling, arbitrage, hedging, derivatives, and other speculative investment practices that may increase investment loss. Hedge funds can be highly illiquid, are not required to provide periodic pricing or valuation information to investors, and often charge high fees that can erode performance. Additionally, they may involve complex tax structures and delays in distributing tax information. While hedge funds may appear similar to mutual funds, they are not necessarily subject to the same regulatory requirements as mutual funds. Venture Capital – Venture capital investments involve substantial risks. The risks associated with investing in companies in the start-up or expansion stages of development are greater than those of companies in later stages, because the companies’ business concepts generally are unproven and the companies have little or no track record. Limited Partnerships – Generally, limited partnership investments are suitable only for a narrow class of relatively sophisticated investors. Limited partnership investments may be speculative in nature and be subject to resale restrictions or illiquidity. An investment is appropriate only for investors who have the capacity to absorb a loss of some or all of their investment. Bonds – When investing in bonds, it is important to note that as interest rates rise, bond prices will fall. High-yield bonds have greater credit risk than higher quality bonds. Duration – Duration is a measure of the sensitivity of the price -- the value of principal -- of a fixed-income investment to a change in interest rates. Duration is expressed as a number of years. Standard Deviation – Standard deviation is a measure of the dispersion of a set of data from its mean. It is calculated as the square root of variance by determining the variation between each data point relative to the mean. If the data points are further from the mean, there is higher deviation within the data set. International and Emerging Markets – There are special considerations associated with international investing, including the risk of currency fluctuations and political and economic events. Investing in emerging markets may involve greater risk and volatility than investing in more developed countries. Private Equity – Private equity funds are not appropriate for all investors. Investors should be aware that private equity funds may contain speculative investment practices that can lead to a loss of the entire investment. Private equity funds may invest in entities in which no secondary market exists and, as such, may be highly illiquid. The funds are not required to provide periodic pricing or valuation information to investors and often charge high fees that can erode performance. Additionally, they may involve complex tax structures and delays in distributing tax information. Short Positions – The investor should note that when a short position moves in an unfavorable way, the losses are theoretically unlimited. The broker will demand more collateral and the manager might have to close out that short position at an inopportune time to limit any further losses. Small Company Securities – Small company securities are typically more volatile and carry additional risks, since smaller companies generally are not as well established as larger companies. INVESTMENT STRATEGY BRIEF 48
Appendix: Index Descriptions

Bloomberg Barclays U.S. Treasury Bills 1-3 Months Index includes all publicly issued zero-coupon U.S. Treasury Bills that have a remaining maturity of less than three months and
more than one month, are rated investment grade, and have $250 million or more of outstanding face value.
Bloomberg Barclays U.S. Corporate IG Index is an unmanaged index considered representative of fixed-rate investment-grade taxable bond debt.
Bloomberg Barclays U.S. Aggregate Corporate Index is an unmanaged index considered representative of fixed-rate investment-grade taxable bond debt.
Bloomberg Barclays U.S. Corporate High Yield is an unmanaged index considered representative of fixed-rate, noninvestment-grade debt.
Bloomberg Barclays U.S. Government Bond Index is an unmanaged index considered representative of fixed-rate, investment-grade US Government debt.
Bloomberg Barclays Global Aggregate This index provides a broad-based measure of the global investment-grade, fixed-rate debt market.
DXY Index is a measure of the value of the U.S. dollar relative to the value of a basket of currencies of the majority of the U.S.'s most significant trading partners.
S&P 500 Index is a capitalization-weighted index of 500 stocks. The index is designed to measure performance of the broad domestic economy through changes in the aggregate
market value of 500 stocks representing all major industries.
Russell 1000 Index represents approximately 1,000 of the largest companies in the U.S. equity markets, the Russell 1000 is a subset of the Russell 3000 Index. The Russell 1000
(maintained by the Russell Investment Group) comprises over 90% of the total market capitalization of all listed U.S. stocks and is considered a bellwether index for large
cap investing.
Russell 2000 Index measures the performance of the 2,000 smallest companies in the Russell 3000 index.
MSCI EAFE Index captures large and mid cap representation across Developed Markets countries around the world, excluding the U.S. and Canada. With 914 constituents, the
index covers approximately 85% of the free float-adjusted market capitalization in each country.
MSCI Emerging Markets (EM) Index captures large and mid cap representation across 23 Emerging Markets (EM) countries. With 837 constituents, the index covers approximately
85% of the free float-adjusted market capitalization in each country.
Morgan Stanley Market implied pace of hikes index (MSPOKE) is the number of Fed rate hikes in the 12 months following the first rate hike implied by the Eurodollar interest rate
futures market.
The MSCI World Index is a free float-adjusted market capitalization-weighted index that is designed to measure the equity market performance of developed markets.
Wilshire 5000 Index is a market-capitalization-weighted index of the market value of all stocks actively traded in the United States.
VIX Index shows the market's expectation of 30-day volatility. It is constructed using the implied volatilities of a wide range of S&P 500 index options.

INVESTMENT STRATEGY BRIEF                                                                                                                                                           49
Appendix: Index Descriptions

EURO STOXX 50 is a stock index of Eurozone stocks designed by STOXX, an index provider owned by Deutsche Börse Group. According to STOXX, its goal is "to provide a blue-chip
representation of Supersector leaders in the Eurozone
Cash & Cash Eq. is represented by the Bloomberg Barclays U.S. Treasury 3-6 months Bill Index, comprised of treasury bills issued by the U.S. government with less than one year to
maturity.
U.S. Gov’t Bonds is represented by the Bloomberg Barclays U.S. Government Bond Index, comprised of the U.S. Treasury and U.S. Agency indexes.
U.S. Corp IG Bonds is represented by the Bloomberg Barclays U.S. Corporate Bond Index, comprised of the investment grade, fixed –rate, taxable corporate bond market.
High-Yield Bonds is represented by the Bloomberg Barclays U.S. Corporate High Yield Bond Index, comprised of U.S. Dollar denominated, high-yield, fixed- rate corporate bond
market securities.
U.S. LC (Large Cap) equities is represented by Russell 1000 Index, comprised of 1,000 of the largest U.S. securities based on a combination of their market cap and current index
membership.
U.S. SC (Small Cap) equities is represented by the Russell 2000 Index, comprised of 2,000 of the smallest U.S. securities based on a combination of their market cap and current
index membership.
Dev Int’l Equities is represented by the MSCI EAFE Index, comprised of equity securities that belong to markets outside of the U.S. and Canada.
EM Equities is represented by the MSCI EM Index, comprised of equity securities that belong to emerging markets.
Moderate Bench stands for moderate benchmark portfolio return which is a blended portfolio of stocks (60% weight, represented by MSCI AC World Index) and bonds (40%
weight, represented by Bloomberg Barclays U.S. Agg Gov/Credit).
MSCI AC World Index is comprised of equity securities belonging to 23 developed markets and 24 emerging markets countries.
Bloomberg Barclays U.S. Government/Credit Bond Index is comprised investment grade, dollar-denominated, fixed-rate Treasuries, government-related and corporate securities.

Stifel, Nicolaus & Company, Incorporated │Member SIPC & NYSE │www.stifel.com
3 Bryant Park │1095 Avenue of the Americas │ New York, New York 10036                                                                                              1120.3334374.1

INVESTMENT STRATEGY BRIEF                                                                                                                                                            50
You can also read