Azimut Group FY 2019 Results - March 5th, 2020
←
→
Page content transcription
If your browser does not render page correctly, please read the page content below

Azimut Group
     FY 2019 Results

       March 5th, 2020
Table of Contents

•    FY 2019 Highlights & FY19 Preview       3

•    Asset Management & Distribution         13

•    FY 2019 Financials                      16

•    Summary & Outlook                       24

•    About Azimut                            27

                                         2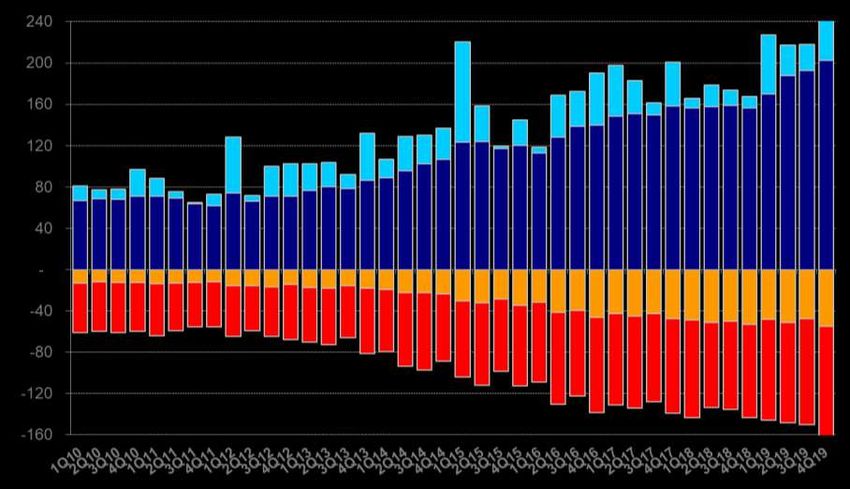
Table of Contents

•    FY 2019 Highlights & FY19 Preview       3

•    Asset Management & Distribution         13

•    FY 2019 Financials                      16

•    Summary & Outlook                       24

•    About Azimut                            27

                                         3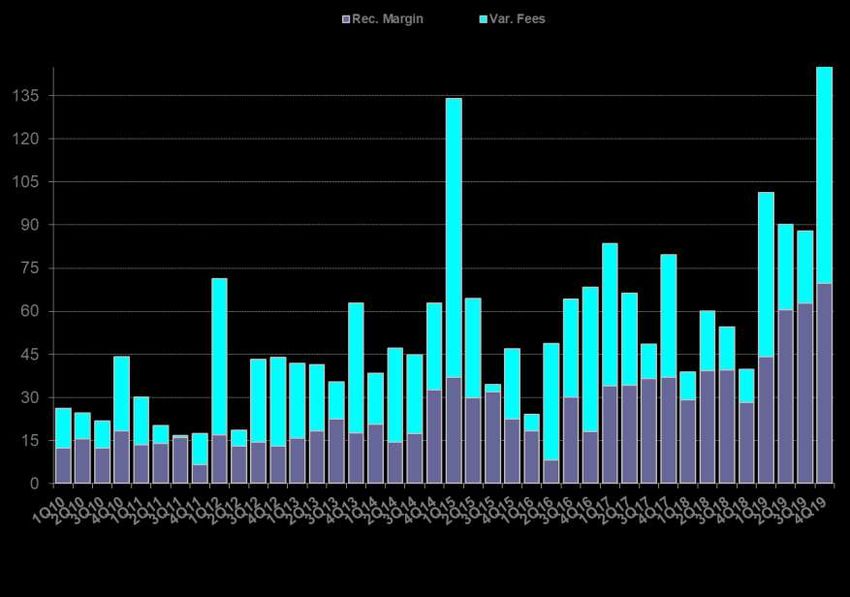
Delivered 3rd consecutive Business Plan since IPO

                                             2005-2009 Plan                      2010-2014 Plan                        2015-2019 Plan
                                       Target           Actual   Status    Target       Actual      Status     Target        Actual          Status

Total Assets                                                               €27bn         €29bn                 €50bn         €59bn
Of which ex-                           €14bn             €14bn               10%          9%                          15%      29%
Italy

Net                                                                       €1-1.5bn       €2bn+                €2.5bn         €5.8bn(1)
Inflows(1)

                                                                                                                      >75%
Dividend                                                                               €0.44p.s.                              ~84%(2)

                                                                                                             Payout
                                                                          >€0.10p.s.
Policy                                                                                 45% Payout                            (€ 7(2) p.s.)
                                                                                                                      >60%

Net Profit                                                                                                   €300mn          €370mn

                                                                  On average DPS of €1.4 per annum
                                                                      over the 5-Y Business Plan

Source: Company data
Note (1): average yearly net inflows over the 5 year plan.                   4
Note (2):Cumulative Dividend 2016-2020.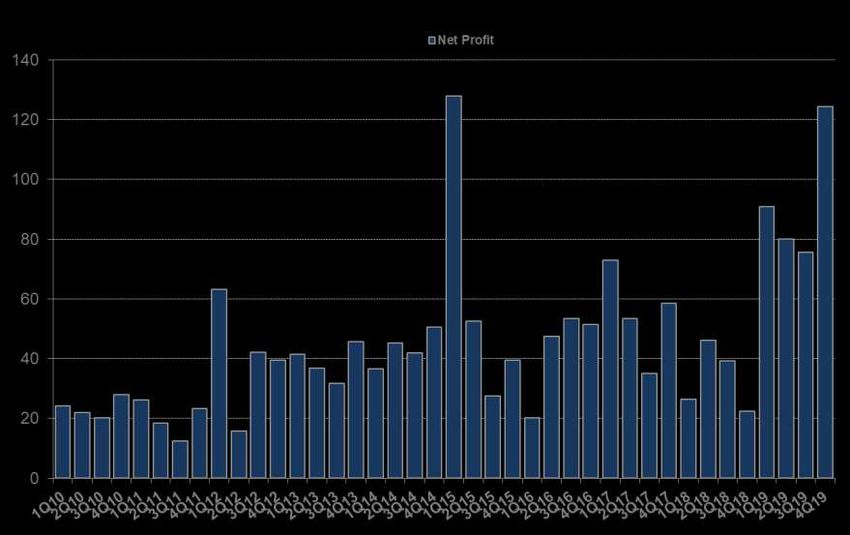
A diversified business model for sustainable, l/t growth

                                                                     Azimut.
                                          Integrated Distribution and Asset Management platform

                                                                                                                             Emerging/International
       Public Markets                                                        Private Markets
                                                                                                                                    Markets

   ~   €42bn                                                             ~   €1.2bn*                                              ~   €17bn
  ➢ Mutual Funds                                                        ➢ Private Equity, Private                             ➢ Local Asset
                                                                          Credit and Club Deals                                 Management
  ➢ Separate Managed
    Accounts                                                            ➢ VC & Start-Ups                                      ➢ Mutual Funds
  ➢ Unit Linked & Advisory                                              ➢ Real Estate and Social                              ➢ Separate Managed
                                                                          Infrastructure                                        Accounts

                              Total Assets Evolution (€bn)                                                            2024E Assets Breakdown
                                                                                                       59.1      Private Markets &
                                                                                           50.4 50.8                 Alternatives                International
                                                                                                                                  >15%
                                                                                    43.6                                                       and/or Emerging
                                                                             36.7                                                        35%        Markets
                                                                     30.0
                                                              24.0
                                            19.6
              13.9 15.7 13.0 15.8 16.5 16.5
 8.7 11.6                                                                                                        Traditional /    50%
                                                                                                              Developed Markets
2004 2005 2006 2007 2008 2009 2010 2011 2012 2013 2014 2015 2016 2017 2018 2019
Source: Company data
Note: includes mainly the latest closing of Italia 500 VC fund and GlobALInvest        5
FoF for a total of €140mn.
FY 2019: financial highlights

Strong increase in recurring revenues coupled with a remarkable cost control
                          Revenues (€mn)                                   Operating Costs (€mn)
               Recurring Fees   Variable Fees     Other

                                +40%
                                            1,050                                    +9%
                                                91
                                                                                                 604
                                                                           556
                 748                            207                                   -2%

                   63
                   57

                                                753
                  629

                FY 2018                    FY 2019

➢ +20% increase in recurring fees thanks to growth in         ➢ Disciplined management of SG&A costs in Q4 and
  AUM and new fee structure                                     overall in the FY
➢ Improving Revenue margin Q on Q (in Bps)                    ➢ Distribution costs increase due to recruitment and
                                                                increase in recurring revenues
➢ Strong performance of products reflected in
  record performance fees

Source: Company data
                                                          6
FY 2019: financial highlights

 A significant step up in Recurring Earnings, delivered throughout the 4 quarters
                 Evolution of Quarterly Recurring EBIT (excluding performance fees) over time

                                                                               2019 Average: €63mn
                                                                                + Performance Fees
       70

       60
                                                                             Assuming full
                                                                            Quarter repricing
       50

       40
                 2010-2018 Average: €22mn
 €mn

       30

       20

       10

       0

Source: Company data
                                                      7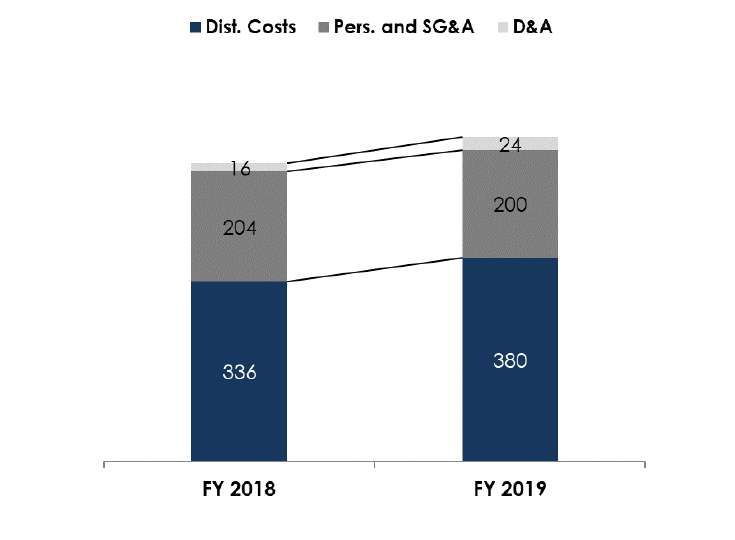
Group Inflows & AUM evolution

 Strong growth in AUM thanks to solid inflows & good performance delivered to clients
 Total Assets breakdown (€bn)
                                    Italy    International *
                                              *                                  Total Assets reaching all time high at
                                                                                 €59.1bn
                                            c. 2x                                Net Inflows in 2019 at €4.6bn, almost entirely
                                                                          59.1
                                                                                 organic, from both Italy and International
                                            8.5x
                                                                          17.1     Italy on an organic basis grew 130% vs.
                                                    50.4       50.8                2018

                                    43.6                                           International business continues to
                                                    12.5       13.8                increase its contribution thanks to global
                                                                                   diversification
                    36.7             7.7
                                                                                 Net Performance in 2019: +8.5%, above
                     4.3                                                         industry
     30.0
      2.1                                                                        Global Organic (ex. M&A) Net Inflows
                                                                                 (€bn):
                                                                                                               4.1
                                                                                   4

                                                                          42.0
                                                                                   4

                                    35.9            37.9       37.0
                                                                                   4

                     32.4                                                          4

     27.9                                                                          4

                                                                                   4       3.5
                                                                                   3

                                                                                   3

                                                                                   3

     2014           2015            2016            2017       2018       2019             2018                2019

Source: Company data
Note*: through AZ International Holdings                              8
International Business: AuM and latest developments

TOT.           €17.1bn
AUM            (+25% YoY)

                            ✓ New JV in Egypt with € 360mln AUM: top performing equity boutique increasing our Middle
                              Eastern & Turkish presence and our Sharia-compliant competences
                 28%        ✓ Growing in the U.A.E. with the opening of the Abu Dhabi office and additional institutional
EMEA

                              clientele
                            ✓ Solid performance in CH and Monaco with moderate AUM growth and client acquisition
                €4.8bn
               (+22% YoY)   ✓ Turkish operations: confirmed positive net inflows and profits trend also in 2019

                            ✓ Brazilian business contributing with strong performance and net new money growth, despite
                              a subdued local market
Americas

                 36%
                            ✓ Mexico focusing on FA growth and productivity as well as overall franchise development

                €6.1bn      ✓ New JV in USA focused on Private Markets: aimed at investing initially minority stakes in the
               (+24% YoY)     GP of alternative managers, allowing for an increased product offering for our global clients

                            ✓ New JV in China with Youmy Wealth Management focusing on distribution partnerships with
Asia-Pacific

                36%           family offices with domestic funds already launched
                            ✓ In Australia exploiting new trends post Royal Commission guidelines
                            ✓ Taiwan and Singapore: sustained recruitment of Sales and Private Bankers
                €6.1bn
               (+25% YoY)

Source: Company data
                                                                  9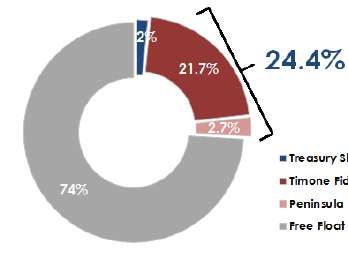
International Business: further improving trends

 EBITDA keeps on growing at a significantly higher pace than Assets

 Total Assets (€bn)                                                          Total Revenues(1) (€mln)

  20

  16

  12

   8

   4

   0
        2012    2013   2014    2015    2016   2017    2018    2019

 EBITDA(1) (€mln)                                                            EBITDA Margin

                                                                             40%

                                                                             30%

                                                                             20%

                                                                             10%

                                                                              0%
                                                                                   2012   2013   2014   2015   2016   2017   2018   2019

Source: Company data.
Note (1): reclassified as per management accounts, excluding one-offs   10
Italy Private Markets Update
AuM Today Total AUM
Investment Fund Type Country Size (€M)
(€M)(1) (€M)
IPO CLUB PE ITA 150 150
ANTARES AZ1 PD ITA 128 128
CORPORATE CASH PD ITA 50 50
Currently €0.9-1.0
FINANCE FOR FOOD PE ITA 150 87
Managed bln
FSI PE ITA 70 70
CORPORATE CASH PLUS PD LUX 295 295
Private Debt PD ITA 120 120
DEMOS 1 PE ITA 350 160(2)
GLOBALINVEST PE (FoF) ITA 300 100
ITA 500 PE (VC) ITA 40 40
Under fund PRIVATE DEBT (reopening) PD ITA 50 €1.3-1.4
raising /
Real Assets Real Assets ITA 300 bln
lauching phase
OPHELIA (ELTIF LUX) [under approval] PE LUX 200
NPEs (“Elpis 1”) NPE ITA 150
Azimut Digitech VC ITA 50-65
Equity – 4 projects PE 400-600
Being defined Debt – 4 projects PD 700-800 €1.8-2.2
(late 20-early
ESG (ELTIF) [under approval] PE / PD ITA 200 bln
21)
Real Assets – 2 projects Real Assets 500-600
Real Estate: new c. € 800m funds dedicated to Real Estate and Social Infrastructure
(ESG compliant)
Source: Company Data
Note (1): Committed capital 11
Note (2): AUM at first closing (ie excluding inflows in February 2020)Summing up: 2019, a spectacular year for both clients and
shareholders
✓ +8.5% net weighted average performance, best in over 10 years
✓ New product accessibility, unique in the Italian market (i.e. Private Markets)
✓ Global team: only Italian asset manager offering an in-house global asset
management platform
✓ Digital front-end for Financial Advisors delivered
✓ Best performing asset management stock globally in 2019
✓ Total return of over +1,000% since the IPO in 2004
✓ Best performing FTSE MIB stock in Italy in 2019
✓ Strong and compact partnership (Timone) standing at ca. 20% of total share
capital with long term lock-ups, increasing annually through stock purchases
✓ Delivered 3rd consecutive 5 year business plan since IPO
Ready for the next challenge
Source: Company data
12Table of Contents
• FY 2019 Highlights & FY19 Preview 3
• Asset Management & Distribution 13
• FY 2019 Financials 16
• Summary & Outlook 24
• About Azimut 27
13Breakdown of Global 2019 Net Inflows
Balanced contribution between domestic and international businesses, almost entirely organic
48% 17% 22% 13%
Global
2019
Italy Americas Asia-Pacific EMEA (Ex-Italy) Net Inflows
Equity
€50m
0.1
€bn
0.5 (M&A)
Source: Company data
14Azimut Net Weighted Average Performance to clients
2019: +8.5% net weighted average performance to clients, above industry
10.00%
9.00%
8.00%
7.00%
6.00%
5.00%
4.00%
3.00%
2.00%
1.00%
0.00%
-1.00%
Dec-18 Jan-19 Feb-19 Mar-19 Apr-19 May-19 Jun-19 Jul-19 Aug-19 Sep-19 Oct-19 Nov-19 Dec-19
Azimut Net WAP Risk Free
Source: Company data at 31/12/2019 and Bloomberg
Italian industry: FIDMGEND. Risk free: MTSIBOTR Index. 15Global Asset Management Team (1/2)
Expertise (AUM weighted)
ROUND THE CLOCK MARKET COVERAGE
• Equity: 38%
AMERICAS EMEA ASIA-PACIFIC
• Fixed Income: 26%
• Allocation: 17%
• Alternative: 12%
• Macro: 6%
✓ 103 PM & Analysts
✓ 14 Average Years of Experience
✓ 16 Asset Management Hub
✓ 8 funds domiciles
✓ 200+ Investment Fund /
✓ /1,300 Companies/Issuers under Coverage
Source: Company data at 31/12/2019 and Bloomberg
Italian industry: FIDMGEND. Risk free: MTSIBOTR Index. 16Global Asset Management Team (2/2)
Worldwide awards for our performance over time
Europe
Award Ranking 5* Rating 5* Rating
Best Asset Top 10 AM Europe NM NM
2013-2018 Award
Management Italy Augustum Augustum
Best Fund over
2012-2018 Corporate High Quality
3 Years 2020
2018 2018
Brasil
(1/2)
Rating Rating
Award Award Award Award
Best Multi Best Equity Best Latam Best Small
Equity / Fixed Strategy Fund Equity / Fixed Fund Manager Mid Cap
Income Manager Income Manager 2015/2016 Fund of the
2008-2017 2017 2009-2017 2015/2016 Decade
Turkey & Middle East
Award Award Award Award
Best Balanced Equity Fund Equity Fund Equity Fund
Fund Runner Up Egypt 1/3/5Y
Turkey Turkey 2017 Egypt
2015-2018 2016-2018 2012-2017
17Net Inflows – Azimut Group vs. Avg. Italian Industry
Group total Net New Money as % of AuM: consistently above Italian industry levels
25% Azimut Group Italian Funds’ Industry 25%
Azimut
average:
15% +11.8% 15%
5% 5%
-5% -5%
Industry
average:
-1.3%
-15% ➢ With Poste one-off -15%
reclassification
-25% -25%
2007 2008 2009 2010 2011 2012 2013 2014 2015 2016 2017 2018 2019
Source: Company out of Assogestioni monthly figures. Assogestioni excludes foreign
operations. 18
Azimut includes consolidated numbers at Group level.Focus on Italy: main KPIs showing encouraging trends
Gross New Financial Advisor Hires Split of AuM and FA by geography
Millenials
FA 198
Banks
153 146
141
128
78%
94 of FAs
80% 16% of FAs
of AuM 17% of AuM
2014 2015 2016 2017 2018 2019
Total Number of Financial Advisors
Millenials
6%
FA of FAs
Wealth Managers 1,747 1,788
1,637 1,638
1,524 1,576
3%
of AuM
2014 2015 2016 2017 2018 2019
Source: Azimut.
19Table of Contents
• FY 2019 Highlights & FY19 Preview 3
• Asset Management & Distribution 13
• FY 2019 Financials 16
• Summary & Outlook 24
• About Azimut 27
20Consolidated reclassified Income Statement (IAS/IFRS Compliant)
Income Statement
€/000 FY 2019 FY 2018 4Q 2019 4Q 2018
Entry commission income 6,133 5,401 2,012 619
Recurring fees 752,741 629,198 202,369 156,269
Variable fees 206,517 56,548 94,522 11,448
Other income 13,285 8,487 3,981 2,157
Insurance revenues 71,098 48,821 22,584 12,343
Total Revenues 1,049,774 748,454 325,468 182,836
Distribution costs (379,776) (336,195) (96,948) (87,241)
Personnell and SG&A (200,201) (203,650) (53,215) (53,084)
Depreciation, amort./provisions (24,387) (15,763) (9,347) (2,919)
Operating costs (604,364) (555,608) (159,510) (143,245)
Operating Profit 445,410 192,846 165,958 39,592
Interest income 16,936 (23,312) 4,660 (15,193)
Net non operating costs 678 (6,238) 6,720 (4,279)
Interest expenses (11,871) (7,414) (4,096) (1,872)
Profit Before Tax 451,153 155,882 173,241 18,248
Income tax (58,413) (24,836) (35,441) (6,952)
Deferred tax (6,491) 9,534 (8,697) 2,860
Net Profit 386,250 140,580 129,103 14,155
M inorities 16,239 18,434 5,641 3,873
Consolidated Net Profit 370,011 122,146 123,462 10,282
Source: Company data 21Net Financial Position (IAS/IFRS Compliant)
Net Financial Position
€/000 31-12-19 30-06-19 31-12-18
Amounts due to banks: (59,491) (198,274) -
Loan BPM (59,491) (198,274) -
Securities issued: (852,475) (350,858) (354,166)
Azimut 17-22 senior bond 2.0% (354,523) (350,858) (354,166)
Azimut 19-24 senior bond 1.625% (497,952)
TOTAL DEBT (911,966) (549,132) (354,166)
CASH AND CASH EQUIVALENTS 984,685 474,396 323,113
NET FINANCIAL POSITION 72,719 (74,736) (31,053)
Lease Liabilities IFRS16 adoption (43,463) (48,318)
-123054 -
NET FINANCIAL POSITION (including IFRS16 impact) 29,256 (123,054) (31,053)
NFP at the end of December mostly includes:
€166mn ordinary dividends paid in cash in May 2019
€60mn stamp duty and policyholder tax advance
Other acquisitions / M&A operations for ca. €63mn
Treasury shares (not booked within the NFP) stand at 1.6% as of 31/12/2019
Lease liabilities do not constitute a cash item
Source: Company data
22Capital Management & Returns to Shareholders
Average DPS of €1.4 per share paid annually throughout the latest 5-Year Business Plan
1.6 €1.40
1.4
1.2
1.0
DPS
0.8
0.6 €0.51
0.4
0.2 €0.15
0.0
EPS DPS Average Payout
141%
150.0%
2.62
119%
81% 100.0%
77%
60% 60% 2.00
40% 45% 1.86
35% 38% 50.0%
22% 1.68
1.50 1.50
1.31 1.30 0.0%
1.21 1.17
Total ordinary dividend proposed: €1.0p.s.*
1.00
1.07
1.00
0.91
Average DPS paid 0.78
in the latest 5 year plan: €1.4 p.s. (with an average 84% payout)
-50.0%
0.71 0.70
Reconfirmed
0.62
0.55
dividend/capital return policy: flexible use of cash (Dividend vs. Buybacks) while
maintaining an attractive return to shareholders -100.0%
0.25 0.25
0.20
Source: Company data
23
Note*: Subject to AGM approval
-150.0%Table of Contents
• FY 2019 Highlights & FY19 Preview 3
• Asset Management & Distribution 13
• FY 2019 Financials 16
• Summary & Outlook 24
• About Azimut 27
24Summary
Diversification across geographies and products with a focus on bottom line
➢ 2019 has been an outstanding year for Azimut
Record financial results & strong EBITDA growth overseas
Reputable One of the best net performance to clients
Asset Extraordinary Private Markets Kick-off event
Management
➢ 2020 looks more challenging
Volatility spike due to unforeseen events
ro ing in
Quality More selective investor appetite, focus on asset
ri ate
Distribution allocation
Mar ets
Low yield environment set to continue
➢ However, business model remains strong:
Good cost control demonstrated in 2019
Better quality profit generation (less reliant on market
performance)
Increasing Strong Geographical and product diversification
International Balance
diversification Sheet ➢ Areas of focus for 2020:
Private Markets growth (Italy & US)
International business profitability
Alignment of Continuation of cost discipline
interest Domestic market contribution
➢ Renewed focus on delivering €300mn+ of Net profit
in 2020 (under normal market conditions)
25
25Outlook on the Private Markets business
Private Market AUM Evolution
A new business segment € bn
aimed at generating additional long term
performance to clients and returns for
shareholders
10+
+8
2020
AUM
Target:
2.0
+0.8
1.2
0.4
2018 Today 2020 2024
26Table of Contents
• FY 2019 Highlights & FY19 Preview 3
• Asset Management & Distribution 13
• FY 2019 Financials 16
• Summary & Outlook 24
• About Azimut 27
27Azimut international presence
Azimut overseas business stands at 29% of Total Assets at December 2019
Ireland Monaco
Italy Switz.
Brazil Lux. Turkey Australia
Chile U.A.E. Egypt China
Mexico Hong Kong
USA Singapore
Taiwan
Asset Management
Distribution
Private Markets
Source: Company data
28Azimut Group Structure
Azimut Holding
(Listed: AZM.IM)
100% AZ International Holdings(6)
(2010)
100% 100% 100% 100%
An Zhong (AZ) IM AZ Brasil Holdings AZ IM Singapore Katarsis CA
(2011) (2013) (2013) (2011)
100% 63% 100%
100% AZ Fund(4) AZ IM HK 100% AZ IM AZ Quest Eskatos CM
Asset (1999) (2011) (2011) (2015) (2011)
Management 51% 100% 100%
AZ Swiss(5) AZ Sestante Azimut ME
(2012) (2015) (2019)
100% 100% 100% 100%
100% Azimut Capital Azimut Portföy CGM-Azimut Monaco(3) Azimut DIFC AZ US Holdings
Management (2004) (2011) (2011) (2017) (2015)
51% 100% 100% 75%
AZ Sinopro FP AZ-México Holdings Azimut Egypt AM AZ Apice LLC
(2013) S.A. de CV (2014) (2019) (2016)
100% 100% 100%
Distribution 100% Azimut Financial AZ Sinopro IP(2) Màs Fondos S.A. AZ Brasil Holdings
Insurance (2015) (2013) (2014) (2013)
100% 58% 90%
AZ Andes SpA AZ NGA Azimut Brasil WM
Holding(1)
(2015) (2014) (2015)
Life 100%
AZ Life
(2003)
Insurance
96.5%
100% Azimut Enterprises AACP
(2014) (2019)
Private
Markets 100% Azimut Libera Impresa
SGR (2014)
Source: Company data as at 31/12/2019. Note (1): Controls distribution companies M&O Consultoria, FuturaInvest and Azimut Brasil
Wealth Management. Note (2): controls AZ Sinopro Insurance Planning. Note (3): Controls 100% of CGM Italia SGR. Note (4): 30% is
owned by Azimut Capital Management and 19% by Azimut Financial Insurance, both fully owned by Azimut Holding. Note (5): 29
controls SDB Financial Solutions. Note (6): Showing only material subsidiaries with a majority ownership, Sigma Funds Management
under liquidation.Azimut Group business overview
Azimut Holding
(Listed: AZM.IM)
Life
Insurance Asset Management Distribution Private Markets
Ireland Italy Luxembourg Italy Monaco Italy
Ireland Monaco Turkey Switzerland
EMEA
Switzerland Turkey UAE Egypt
UAE Egypt
ASIA-PACIFIC
Hong Kong China Taiwan Australia
Singapore Australia Hong Kong Singapore
China
AMERICAS
Brazil Mexico USA
Brazil Mexico
Chile USA
Source: Company data
Note: Presence related only to majority holding ownerships 30Private Markets Kick off Event: the largest ever made in Italy
14,000
PARTICIPANTS
280
75
CONFERENCES
SPEAKERS
200
ONE TO ONE MEETINGS
50,000
COFFEES
Source: Company data
31Azimut funds breakdown
Breakdown by asset class reflecting client behaviour and risk appetite
AuM by Category AuM by Underlying Asset
(8.8%)
Equity
9.1%
Fixed
Income
Money 42.0%
Total Equity: 40%(39%)
Market Flexible
(41.3%)
10.1% 45.2% Foreign
(9.9%) Equity 35.1%
(46.1%)
(33.9%)
Balanced
15.7%
(15.0%)
Cash 18.2%
Bond
19.8% Italian Equity (19.7%)
(20.2%)
4.6%
(5.1%)
Source: Company data at 31/12/2019
Note: Numbers in bracket refer to previous quarter. 32Azimut funds breakdown
Breakdown of Equities and Fixed Income by Geography and type
Equities Fixed Income
UK 9.1%
(9,1%)
Investment
Sovereigns
North Asia-Pacific Grade 27.9%
25.0%
America 10.2% (19.5%) (29.9%)
29.2% (9.7%)
(25.9%)
Emerging
6.3%
(7.3%) Securitized
6.7%
(6.2%)
Convertible
Other 13.4% 1.5%
(1.4%)
(14.9%)
Hybrid 15.2% High Yield
(18.0%)
Europe 27.6%
31.7% (27.9%)
(35.9%)
Source: Company data at 31/12/2019
Note: Numbers in bracket refer to previous quarter 33US Private Markets initiative (1/3)
Azimut Alternative Capital Partners (“AACP”): the project Team
Jeffry Brown: previously
Newco set up to build a next generation, diversified and one of the first
✓ multi-affiliate investment firm acquiring initially minority GP Managing Directors at
stakes in alternative asset managers
Dyal Capital
(Neuberger Berman),
one of the leading
Initial focus on U.S. Private Credit, Private Equity, minority stake investors
✓ Infrastructure and RE
in alternative
managers. Prior to
Dyal, senior roles at Bear
Access to strong and consistent cash flow generation Stearns AM and MS AM.
✓ delivered at the GP level, further enhanced in AACP
Executed over 50
given greater diversification and lean cost base
transactions on $135bn
in AUM, including 33 GP
Focus on large, growing and at the same time under- stakes.
✓ shopped segment of sub USD 3bn alternative managers Other key senior
with high current positive EBITDA managers already
identified joining shortly
Source: Company data
34US Private Markets initiative (2/3)
The Structure Azimut targets
$ 7 billion pro-rata AUM
Azimut
Alternative (in excess of $ 20 billion
Capital Partners gross AUM) in 10 years
("AACP") Consistent, high quality EBITDA
cash flow from predictable
Funded through a
Permanent capital recurring fees and further
supporting growth and/or upside from carried interest / meaningful equity
generational change. performance fees. Potentially commitment by Azimut
Potentially accessing additional products/capacity
together with additional
Azimut’s global distribution for our clients worldwide
(local) leverage and
retained earnings
Target to acquire ca. 10
alternative asset
managers, diversified
25%+ 25%+ 25%+ across Private Credit,
Private Equity and at a
Infrastruct. /
Private Private later stage Real
Real Estate
Credit GP Equity GP
GP Estate/Infrastructure
Highly positive EBITDA
generation of underlying
managers
Source: Company data
35US Private Markets initiative (3/3)
Significant addressable Market…
# of Alternative AACP
Managers 1,500 Target Market
300
257
AuM 54
$3bn
Private Equity Private Credit
… With very limited competition
Capital Targeting $ 3bn Type
Petershill Fund I ($1.2bn) Hedge Funds
Dyal Capital Partners II ($2.1bn) Hedge Funds
Petershill Fund II ($1.3bn) Hedge Funds
Blackston Stategic Holdings ($3.3bn) Hedge Funds, Private Equity, Real Estate
Dyal Capital Partners II ($2.1bn) Hedge Funds, Private Equity
Dyal Capital Partners III ($5.3bn) Private Equity
Petershill Fund III ($2.5bn) Private Equity
Dyal Capital Partners IV ($9.0bn) Private Equity
Petershill Fund III ($5.0bn) Private Equity
Bonaccord Capital Partners (Aberdeen) ($0.5bn) Private Equity, Private Credit
Investcorp ($250m) Private Equity, Private Credit
Stonyrock ($250m) Private Equity
Source: Company data
36Azimut pre-IPO history
20+ years of growth and evolution
Pietro Giuliani and the most of the
current top management join the
company and start the As a result of the Bipop
recruitment of top level restructuring, Azimut’s
professionals for the distribution management buys out the
business backed up by Apax Azimut’s Initial
network (organised in 6 regional Public Offering
companies) and the fund Partners. Approximately 700
people invested in the MBO, (AZM.IM) on July
managers team. 7 th, 2004
completed in June 2002.
Bipop-Carire The 6 regional
Azimut is acquires Azimut, distribution
established by which continues to companies merged
Akros operate into Azimut
Finanziaria independently. Consulenza SIM.
1999
1988 - 1998 2001 2002 2004
1992
Azimut Holding Management
20% Apax Partners
and Promotori
65% 35%
Azimut Azimut Azimut Azimut Azimut Azimut
Piemonte Lombardia Triveneto Liguria-Toscana Adriatica Centro-sud
Azimut Holding
80% 100%
Promotori Azimut Consulenza SIM
37Azimut post-IPO development
A dynamic Group at the verge of product and corporate innovation
Obtained a BBB Rating New management
Strengthened and New Senior Bond to team
Libera Impresa rationalized Turkey refinance existing JV in Egypt and USA
JV in Taiwan Strengthened Brazil Convert Repricing recurring
JV in China JV in Brazil Futurimpresa JV in U.A.E. fees
JV in Turkey JV in Singapore (Private Equity) Initiated Share buyback New financing
Azimut IPO
JV in Monaco Convertible bond Growing in Australia plan Expansion in Australia
Insurance: AZ Life JV in Switzerland JV in Chile
Azimut 2013-2020 Strengthened CH Re-Launch of Private
(Ireland)
2.125% Expansion in Australia Markets
2012
2004
2010
2011
2013
2014
2015
2016
2017
2018
2019
AZ International Launch of JV in Mexico Strengthened Timone MBO
Holdings participating Second Turkey JV Australia Strengthened Australia
financial instruments JV in Australia Strengthened Brazil
AZ Swiss Expanded in
Total Assets (€bn) Private Insurance Switzerland
Out of the CRD IV
59.1
regime
50.4 50.8
43.6
36.7
30.0
24.0
19.6
15.7 15.8 16.5 16.5
13.9 13.0
11.6
Source: Azimut 38International expansion – Turkey
2011: Start of a building block leading us to become the largest independent player in Turkey
In 2011 Azimut entered the Turkish market through AZ
International Holdings S.A. (“AIH”) with the aim of
growing on both the production and distribution sides
AZ International Holdings of the business
(2010) In October 2014 Azimut acquired 70% of Notus, a
Turkish independent asset management company.
Notus manages discretionary portfolio mandates for
100% Azimut Portföy individual and corporate clients ensuring diversified
(Asset management & and efficient asset allocation plans across local and
distribution)
international markets.
In December 2014 Azimut acquired 100% of AZ Global
(renamed Azimut Portfoy) to continue its growth plans
in Turkey
In January 2015 Azimut reached an agreement to
acquire 70% of Bosphorus Capital (later merged into
Azimut Portfoy).
In September/October 2015 Azimut announced the
reorganization of it’s Turkish platform to extract stronger
commercial synergies and operational efficiencies,
concentrating it’s business in Azimut Portfoy
The commercial and industrial integration within Azimut
Portföy creates the Turkish largest independent player
with a 5% market share
39International expansion – Egypt
2019: Enter the Egyptian asset management industry
In 2019 Azimut entered the Egyptian market through AZ
International Holdings S.A. (“AIH”) with the aim of
growing on both the production and distribution sides
AZ International of the business
Holdings (2010) In January 2019 Azimut acquired 100% of Rasmala
Egypt, a Egyptian independent asset management
company. Rasmala Egypt manages conventional and
100% Azimut Egypt AM Shariah compliant portfolio management in Egypt with
(2019) AUM of EGP 8.46bn (USD 474mn).
The Company has a high quality team of portfolio
managers and analysts with 10 investment
professionals managing a range of strategies
embedded in public funds and mandates for local
Sovereign institutions, international Sovereign Wealth
Funds, pension plans, public banks and HNWI.
The team’s track record includes periods of extended
instability and volatility for local markets with an overall
624% accumulated returns over the period 2005-June
2018 in local currency, well above 537% for EGX 30 and
324% on average for local funds.
As of 2017 the Arab Bank Corporation Equity Fund,
managed by Rasmala Egypt, ranked first for 3, 5 and 6
years performance
40International expansion – Switzerland
2011: Start of a building block to create an independent asset management player
AZ Swiss & Partners was established in 2012 and, on
January 2016 following the acquisition of Augustum
AZ International
Opus, has received the authorization from the FINMA,
Holdings S.A. (2010)
the Swiss Financial Market Supervisory Authority, to
operate under a LICol license.
In June 2016 AZ Swiss acquired the business of Sogenel
Capital Holding S.A., which will form a new division
100% Katarsis CA within AZ Swiss to be headed by Sogenel’s current
(2011) founder and CEO.
In June 2017, AZ Swiss acquired the entire equity
capital of SDB Financial Solutions S.A. (“SDB”), which
51% AZ Swiss & Partners
(2012) will operate as a subsidiary of AZ Swiss and will
continue to be headed by SDB’s current management
100% team. With this second acquisition and its organic
growth strategy AZ Swiss has achieved total AuM of
SDB Financial
almost € 2bn) as of December 2017.
Solutions S.A. (2017)
With these acquisitions AZ Swiss is starting to deploy its
strategy based on: (i) the management of mutual
funds (both UCITS and FIA) and discretionary portfolios;
(ii) the distribution of funds to qualified investors (HNW
and institutional clients); (iii) the consolidation of
independent asset managers and private bankers in
Switzerland to grow an independent wealth
management platform.
41International expansion – Brazil
2013: Azimut enters LATAM with a JV in the Brazilian asset management market
AZ International Holdings S.A. On 10 October 2013 Azimut acquired 50% of Legan
(2010) (later merged into AZ Quest), an asset management
company with excellent track record.
100%
Subsequently, on 13 February 2014, Azimut
AZ Brasil Holdings Ltda completed the acquisition of 50% of AZ FI Holding
(2013)
(later increased to 100% and renamed Azimut Brasil
Wealth Management Holding).
90%
65% Azimut WM Holding controls M&O (financial services
AZ Quest Azimut Brasil WM through advisory on asset allocation, funds selection
(2015) Holding S.A. (2015)
and financial education) and FuturaInvest
(dedicated to asset management services through
funds of funds and managed accounts).
M&O Consultoria Ltda 100% In February 2015 Azimut completed the acquisition of
(2013)
a 50% stake in LFI (later renamed Azimut Brasil WM),
focused on Wealth Management
FuturaInvest Gestão de 100% In April 2015 Azimut announced the acquisition of a
Recursos Ltda (2013)
60% stake in award-winning Quest Investimentos,
managing mostly equity products and employs one
Azimut Brasil Wealth 100% of Brazil’s best-performing fund managers.
Management (2015)
42International expansion – Mexico
2014: Azimut expands LATAM with a JV in the Mexican market
On 17th June 2014 Azimut through its subsidiary AZ
International Holdings S.A. (“AIH”) acquired 82.14% of
Profie S.A. (renamed AZ Mèxico) a Mexican holding
AZ International company controlling the entire equity capital of Más
Holdings (2010) Fondos S.A. (“Más Fondos”), Mexico’s largest pure
independent asset management distribution company.
Through this partnership, Azimut and Más Fondos will
cooperate to develop an integrated platform centred on
a proprietary financial advisors network working in an
100% AZ-Mèxico Holdings open-architecture environment to exploit the growth
S.A. de CV. (2014)
potential of the Mexican market.
In 2015 Azimut increased its stake in Màs Fondos (to 94%),
reaffirming commitment to build a fully integrated
100%
platform
Màs Fondos S.A. On the 2nd January 2017 Mas Fondos started fund
(2014) management operations in Mexico with the launch of
two local products and an additional one being
launched in the 2H 2017. The launch of the first two funds
is allowing us to continue building an integrated platform
and increase overall profitability. At the 30th of June
about 25% of Mas Fondos asset are managed on the two
funds.
43International expansion – USA
2015: Enter the USA asset management industry
In 2015 Azimut entered the US market through
AZ International AZ International Holdings S.A. (“AIH”) with the
Holdings (2010) aim of growing in the distribution targeting high
net worth individuals and leveraging our Latin
100%
America presence
AZ US Holdings
(2015)
In 2019 Azimut set up a Newco called “Azimut
Alternative Capital Partners” (AACP) to build a
75% next generation, diversified and multi-affiliate
AZ Apice LLC
(2016) investment firm acquiring initially minority GP
stakes in alternative asset managers
97% AACP
(2019) Focus of AACP is on U.S. Private Credit, Private
Equity, Infrastructure and RE under $3bn of AUM
offering permanent capital as well as potentially
access to the Azimut global distribution
44International expansion – China / HK
2010: Definition of a frame agreement with local entrepreneurs/partners
An Zhong (AZ) Investment Management in Hong Kong is
the Holding company. Azimut, through the Holding
AZ International Holdings company, oversees the operating subsidiaries and has
(2010) relocated 3 Senior PMs from Luxembourg. Azimut
manages one of the largest RMB fund in the world
100%
Through the operating subsidiaries Azimut aims at
creating a regional hub and developing local production
An Zhong (AZ) IM
(2011) and distribution of asset management products and
investment advisory services with a focus on qualified
investors.
100% In March 2018, AZ Investment Management (Shanghai)
has been granted registration as Private Fund Manager
An Zhong (AZ) IM HK
(2011) (PFM) by the Asset Management Association of China
(AMAC) - a self-regulatory organization that represents
the mutual fund industry of China. Azimut is the first
100%
eurozone based asset manager to have obtained the
license, assigned to a limited and selected number of
AZ Investment international asset managers.
Management
(2011) The license will allow Azimut’s subsidiary to launch,
manage and offer onshore investment products to
institutional and high net worth investors (HNWIs) in
Mainland China.
45International expansion – Taiwan
2013: Azimut widens its Asian presence with a JV in the distribution business in Taiwan
On 27th June 2013 AZ International Holdings S.A.
AZ International Holdings
(“AIH”) and An Ping Investment (later renamed
(2010)
AZ Sinopro Financial Planning), a Taiwanese
holding controlling the entire capital of Sinopro
Financial Planning Taiwan Limited (“Sinopro”),
signed an investment and shareholders
agreement to start a partnership in the
51% AZ Sinopro FP distribution of asset management products in
(2013)
Taiwan.
In particular, Azimut purchased 51% of An Ping
Investment’s capital from its existing shareholders
for an investment of ca. € 3mn to finance the
100%
AZ Sinopro Investment business development activities, and has also
Planning Ltd (2013) call/put option rights.
100%
The partnership increases Azimut presence in the
Asian market together with a strong and
AZ Sinopro Insurance dedicated financial planning and distribution
Planning Ltd (2015)
partner, which will contribute in developing the
financial knowledge and will respond to planning
and financial consulting needs of Taiwanese
investors
46International expansion – Singapore
2013: Azimut signs a JV with a Singapore based asset management company
On 2nd October 2013 Azimut and Athenaeum Ltd, a
Singapore independent asset management
company, have signed an investment and
shareholders agreement to start a partnership in
AZ International the local market.
Holdings S.A. (2010) Azimut initially purchased 55% of Athenaeum’s
corporate capital through a capital increase,
which was employed to finance the business plan.
Through this partnership, Azimut and Athenaeum
will aim at maximising the potential of Athenaeum’s
100% AZ Investment existing funds and develop an internal sales
Management
Singapore (2013) structure to service institutional and HNWI investors
in South East Asia. In addition, the partners will work
to leverage these asset management
competences via Azimut international presence
and clients.
In January 2016 Azimut acquired the remaining 45%
to extract stronger commercial synergies and
operational efficiencies abroad.
The local partners agreed to continue working
together over the long term to grow the business in
Singapore and focus on managing the local
products as well as cultivating relationships with
family offices and HNWI in the region.
Based on a US$/€ exchange rate of 1:0,74 47International expansion – Australia
2014: Azimut signs an agreement to enter the Australian asset management market
AZ International Holdings S.A.
(2010) On November 3rd, 2014, Azimut acquired a 93%
stake in Next Generation Advisory (“NGA”), an
100% AZ Sestante
Australian based newco established with the
(2015) purpose of consolidating financial planning
businesses providing asset allocation and advisory
services to local retail, HNW and institutional clients.
58% AZ Next Generation
The business plan targets to reach AUD 7.6bn of
Advisory (2014)
All 100% consolidated AuM (ca. €5.3bn) in the next 12 years
The Australian wealth management industry is the
➢ Eureka Whittaker ➢ Empowered ➢ Wealthmed (2017)
Macnaught (2015) Financial largest market in the Asia Pacific region and the 4th
➢ FHM (2017)
Partners (2016)
➢ Pride Advice (2015) largest in the world. Australia has one of the world’s
➢ Henderson Maxwell
➢ Wealthwise (2016)
➢ Lifestyle Financial (2017) leading pension system (Superannuation), which
Planning ➢ Priority Advisory has underpinned the growth of the Australian asset
➢ McKinley Plowman
Services (2015) Group (2016)
(2018) management industry.
➢ Financial Lifestyle ➢ Sterling Planners
➢ Spencer Fuller & In August 2015, a majority stake (76%, later
Partners (2015) (2016)
Associates (2019)
➢ Wise Planners ➢ Logiro (2016) increased to 100%) was acquired in Ironbark Funds
(2015)
➢ On-Track (2016) Management (RE) Ltd (renamed AZ Sestante), a
➢ Harvest Wealth company operating as trustee and manager of
➢ MTP (2017)
(2015)
➢ PnP (2017) Australian mutual funds, necessary to launch and
➢ RI Toowoomba
(2016) offer funds locally.
Based on a AUD/€ exchange rate of 1:0,6948
Note: the AZ NGA controlling structure is a summarized 48
representationInternational expansion – Monaco
2011: Entered the Monaco market with (initially) a 51% stake
On 10th May 2011 Azimut through its subsidiary
AZ International Holdings S.A. (“AIH”) signed a
binding frame agreement with CGM
AZ International Holdings
(Compagnie de Gestion privée Monegasque);
(2010)
the acquisition of a 51% stake has been
completed on 30th December 2011.
The partnership added new competences to
100% CGM-Azimut Monaco Azimut Group targeting UHNWI also thanks to
(Asset management) CGM’s operating subsidiary in Italy.
100%
Current CGM management entered Azimut’s
shareholders’ agreement.
CGM Italia SIM
(2011)
In 2016, Azimut reached an agreement to
acquire the remaining 49% as of 31/12/2017
49Azimut’s shareholder base
Total shares issued: 143.3m Timone: a strong agreement for l/t commitment
Timone Fiduciaria represents the shares of over Participants
Advisors, employees and management
2,000 individual shareholders (FAs, employees, organised in separate areas
managers working for Azimut) tied up in a strong
3 years automatically renewed unless the
shareholders’ agreement. absolute majority of the voting rights refuses.
Duration
In June 2018, more than 1,200 participants of the Already renewed in 2016 and 2019
shareholders agreement invested a total of € 100
Part of each participant’s shares are locked
million in Azimut shares, thereby further increasing
following a table based on the tenure
it’s partnership stake, now at 20% of share capital within the Agreement. The residual can be
sold at any time but subject to pre-emption
right amongst other participants. The price
for this transfer is a 30 days rolling average.
Years matured(1) % of locked
2% Share lock-up
shares
19.6%
9 25%
76%
Peninsula
Free Float A share trust includes 100% of the voting
rights of the participants.
Governance A committee is responsible for managing
and monitoring the participants’ obligations
and rights under the agreement
Source: Azimut, Feb. 2020
Note (1): since receiving the shares
50One of a kind transaction: Timone MBO
In June 2018 completed the most significant investment in Azimut Holding stock since the IPO
✓ Timone strengthened it’s stake in Azimut Holding Key Metrics
from 15.8% to 20.7% at €14.4 avg share price
✓ Participation of more than 1,200 colleagues from
14 countries worldwide
Debt
Total Investment: €155m
Transaction ✓ LBO: financed 50% through equity raised by
Timone: €100m
Summary Timone members and 50% through bank debt,
secured by a pledge on shares acquired and a
€50m
̴7 mln Azimut shares
̴5
cash collateral
✓ Peninsula joined the deal acquiring at % stake acquired
settlement ca. 3.8m shares (2.7% of share Equity
capital) €50m
✓ Strengthen and provide additional stability to
̴ 3.8mln Azimut shares
Peninsula
Azimut governance with strong and renewed
commitment to the market €55m
Strategic
✓ Provide additional levered upside to existing
(younger) Timone members, considering the
̴ 2.7% stake acquired
Rationale stock is significantly undervalued
Shareholding structure:
✓ Messages reinforced by the involvement of a
leading financial investor (Peninsula) sharing the Pre (10 May 2018) Post (10 May 2018)
same view
9%
15.8%
15%
20.7% 23.3%
✓ January 2018: Transaction announced
✓ June 2018: Transaction completed
Timeline ✓ February 2020: fully repaid debt financing at 75%
76% 75%
Timone level through an ABB @ €23.7 per share
(2x virtual return) with the remaining shares fully
locked-in
Source: Company data
51One step ahead: Azimut initiatives in context
Undisputed leader in corporate and product innovation thanks to a unique business model
Banca Generali,
Banca Fideuram,
FinecoBank
International
2010 2017
expansion
FinecoBank
Integrated Asset
Management & 1989 2017
Distribution model
Banca Mediolanum
Private Markets &
Corporate 2014 2017
Finance
Banca Mediolanum
Blockchain and 2015 2017
new technologies
… who’s next?
52Summarized Azimut product offering
A balanced and complete product offering, focused on innovation and performance
HI HER RISK
Italian Equity
Commodity Alpha Commodity Japan
European Equity
European CEEMEA
Real Plus
Global Quality Trend Absolute Asia Absolute
Equity Options Equity Options New World Opportunities
lobal ro th Turkey
Small Cap Europe Target Funds
Global Macro Income Opportunities
FoF Global
Currencies
Global Income Su u
European Dynamic Multistrategy
US Short
America Strategic
Long/short Europe
Term Bond Trend
Alternative Global Italian Excellence Global Macro RMB Funds
Infrastructure Quant
Cash lobal Funds Conservative
Funds*
Unconstrained Smart Ris Hybrid Bonds
Income
Bond Fund remia
Bond Target Market Neutral Arbitrage
Conservative Solidity F1 Conser ati e
Funds Macro Volatility
Global Core Brands
Income Dynamic Conservative Sustainable Global
LOWER RISK
Cat Bond Fund Plus
Allocation Equity
Eskatos
Munis Yield
F1 Alpha Plus
CLASSIC INNOVATIVE
Fixed Income Alternative Equity Balanced Commodity
Note: for illustrative purposes only, may not be not exhaustive.
Does not include FOF, Multiasset, Private Markets. Note*: Including 53
QProtection, QBond, Qinternational. Source: Azimut as of 31/12/2019Strong, consistent growth trends
Continuous growth throughout the decade in different market cycles
Total Assets (€bn) Net Inflows (€bn)
59.1 6.7 6.8
6.5
50.4 50.8 5.6
43.6
4.4 4.6
36.7
30.0
3.2
24.0
19.6
16.5 16.5 1.9
13.9 15.7 13.0 15.8 1.5 1.6 1.5
11.6 1.2 1.2
8.7 0.9 1.1
7.2
0.5
0.1
2003 2004 2005 2006 2007 2008 2009 2010 2011 2012 2013 2014 2015 2016 2017 2018 2019 2003 2004 2005 2006 2007 2008 2009 2010 2011 2012 2013 2014 2015 2016 2017 2018 2019
Clients ('000) Financial Advisors
218 220 1,788
208 1,747
198 1,6371,638
187 1,576
1,524
1,477
173
1,3791,3901,396
160 163
154 156 1,2551,289
148 145 149 1,205
135 1,117
120 947
109 881
101 780
2003 2004 2005 2006 2007 2008 2009 2010 2011 2012 2013 2014 2015 2016 2017 2018 2019 2003 2004 2005 2006 2007 2008 2009 2010 2011 2012 2013 2014 2015 2016 2017 2018 2019
Source: Company data. 542009-2019 A beta stock with a strong P&L
Solid financial performance (€mln)
Rec. Fees Var. Fees SG&A Other Costs
240
200
160
120
80
40
-
-40
-80
-120
-160
Source: Company data as of 31/12/2019
Note: 2014, 2017 and 2018 Net Profit excludes one-offs
55Contacts & Corporate calendar
Investor Relations Contacts Upcoming events
Vittorio Pracca ➢ 23 April 2020: Annual General Meeting
Tel. +39.02.8898.5853
Email: vittorio.pracca@azimut.it ➢ 14 May 2020: Board of Directors approval of 1Q
2020 Results
Galeazzo Cornetto Bourlot
Tel. +39.02.8898.5066 ➢ 30 July 2020: Board of Directors approval of 1H
Email: galeazzo.cornetto@azimut.it 2020 Results
www.azimut-group.com ➢ 12 November 2020: Board of Directors approval of
9M 2020 Results
Disclaimer – Safe harbour statement
This document has been issued by Azimut Holding just for information purposes. No reliance may be placed for any purposes whatsoever on the information
contained in this document, or on its completeness, accuracy or fairness. Although care has been taken to ensure that the facts stated in this presentation are
accurate, and that the opinions expressed are fair and reasonable, the contents of this presentation have not been verified by independent auditors, or other third
parties.
Accordingly, no representation or warranty, express or implied, is made or given by or on behalf of the Company, or any of its members, directors, officers or
employees or any other person. The Company and its subsidiaries, or any of their respective members, directors, officers or employees nor any other person acting
on behalf of the Company accepts any liability whatsoever for any loss howsoever arising from any use of this presentation or its contents or otherwise arising in
connection therewith.
The information in this document might include forward-looking statements which are based on current expectations and projections about future events. These
forward-looking statements are subject to risks, uncertainties and assumptions about the Company and its subsidiaries and investments, including, among other
things, the development of its business, trends in its operating industry, and future capital expenditures and acquisitions. In light of these risks, uncertainties and
assumptions, the events in the forward-looking statements may not occur. No one undertakes to publicly update or revise any such forward-looking statement.
The information and opinions contained in this presentation are provided as at the date of this presentation and are subject to change without notice.
Any forward-looking information contained herein has been prepared on the basis of a number of assumptions which may prove to be incorrect and, accordingly,
actual results may vary. This document does not constitute an offer or invitation to purchase or subscribe for any shares and/or investment products mentioned and no
part of it shall form the basis of or be relied upon in connection with any contract or commitment whatsoever.
The information herein may not be reproduced or published in whole or in part, for any purpose, or distributed to any other party. By accepting this document you
agree to be bound by the foregoing limitations.
The Officer in charge of the preparation of Azimut Holding SpA accounting documents, Alessandro Zambotti (CFO), declares according to art.154bis co.2 D.lgs.
58/98 of the Consolidated Law of Finance, that the financial information herein included, corresponds to the records in the company’s books.
56You can also read


